Method and System for Geographic-Oriented Graphical Representation of Multivariable Input Data Set

a multivariable input data and geographic orientation technology, applied in the field of information processing for intuitive visual representation of input data, can solve the problems of unsuitability for representing a complex set of multivariable input data, unintuitive or unsuitable for multivariable input data, and conventional charts and/or graphs are generally unsuitable for representing a large number of nation-associated data

Inactive Publication Date: 2014-09-18
YOON HARRY
View PDF2 Cites 15 Cited by
  • Summary
  • Abstract
  • Description
  • Claims
  • Application Information

AI Technical Summary

Benefits of technology

[0006]Summary and Abstract summarize some aspects of the present invention. Simplifications or omissions may have been made to avoid obscuring the purpose of the Summary or the Abstract. These simplifications or omissions are not intended to limit the scope of the present invention.
[0007]In one embodiment of the invention, a computerized system generating a geographic-oriented graphical representation of multivariable input data sets is disclosed. This computerized system comprises: a graphical rendering application programming interface configured to receive the multivariable input data sets, one or more sets of viewing options, and geographic and map-related data, wherein the multivariable input data sets comprise at least a first input data set and a second input data set; a graphical rendering engine configured to process and correlate the multivariable input data sets, the one or more sets of viewing options, and the geographic and map-related data to create a graphical representation of a rotatable three-dimensional image of Earth, a sphere or a cube on top of a particular national or state boundary on the rotatable three-dimensional image of Earth, and a stick erected in the particular national or state boundary piercing the sphere or the cube, wherein the sphere or the cube represents a first member of the first input data set and the sphere's or the cube's volume represents a magnitude of the first member of the first input data set, and wherein the stick piercing the sphere or the cube represents a first member of the second input data set and the stick's height represents a magnitude of the first member of the second input data set; a memory unit and at least one of a central processing unit and a graphics processor unit executing the graphical rendering application programming interface and the graphical rendering engine to generate the graphical representation of the rotatable three-dimensional image of Earth, the sphere or the cube on top of the particular national or state boundary on the rotatable three-dimensional image of Earth, and the stick erected in the particular national or state boundary piercing the sphere or the cube; and a display driver operatively connected to a display panel for displaying the graphical representation provided by the graphical rendering application programming interface and the graphical rendering engine executed in the memory unit and at least one of the central processing unit and the graphics processor unit.
[0008]In another embodiment of the invention, a method of generating a computerized geographic-oriented graphical interface for multivariable input data sets is disclosed. This method comprises the steps of: executing one or more programs associated with graphical rendering application programming interfaces (API's) and one or more graphical rendering engines in a CPU, a GPU, a memory unit, and / or another hardware unit in an computerized system; uploading multivariable data sets, viewing options, other input variables, and geographic and map-related data to the CPU, the GPU, the memory unit, and / or another hardware unit in the computerized system; enabling a user to adjust the viewing options and user preferences for geographic-oriented graphical representation of the multivariable data sets uploaded to the CPU, the GPU, the memory unit, and / or another hardware unit in the computerized system; correlating the multivariable data sets and the other input variables with geographical categories from the geographic and map-related data, which are represented on a three-dimensional globe, wherein the multivariable data sets comprise at least a first input data set and a second input data set; representing a first member of the first input data set as a sphere or a cube on top of a particular national or state boundary on the three-dimensional globe, wherein the sphere's volume or the cube's volume represents a magnitude of the first member of the first input data set; representing a first member of the second input data set as a stick erected from a geographic landmark, wherein the stick pierces the sphere or the cube representing the first member of the first input data set within the particular national or state boundary on the three-dimensional globe, and wherein the stick's height represents a magnitude of the first member of the second input data set; and displaying the three-dimensional globe, the sphere or the cube on top of the particular national or state boundary, and the stick piercing the sphere or the cube on a display panel, which is operatively connected to the computerized system.

Problems solved by technology

Conventional methods of visualizing data, such as pie charts, bar graphs, or other conventional charts and / or graphs, are suitable for representing a low number of variables and elements, but they are often unintuitive or unsuitable in representing a complex set of multivariable input data.
Furthermore, if data visualization involves multiple geographic regions, such as multiple national and / or state boundaries, conventional charts and / or graphs are generally unsuitable for representing a large number of nation-associated or state-associated data sets that require geographic categorization.

Method used


Image

  • Method and System for Geographic-Oriented Graphical Representation of Multivariable Input Data Set
  • Method and System for Geographic-Oriented Graphical Representation of Multivariable Input Data Set
  • Method and System for Geographic-Oriented Graphical Representation of Multivariable Input Data Set

Examples


Embodiment Construction

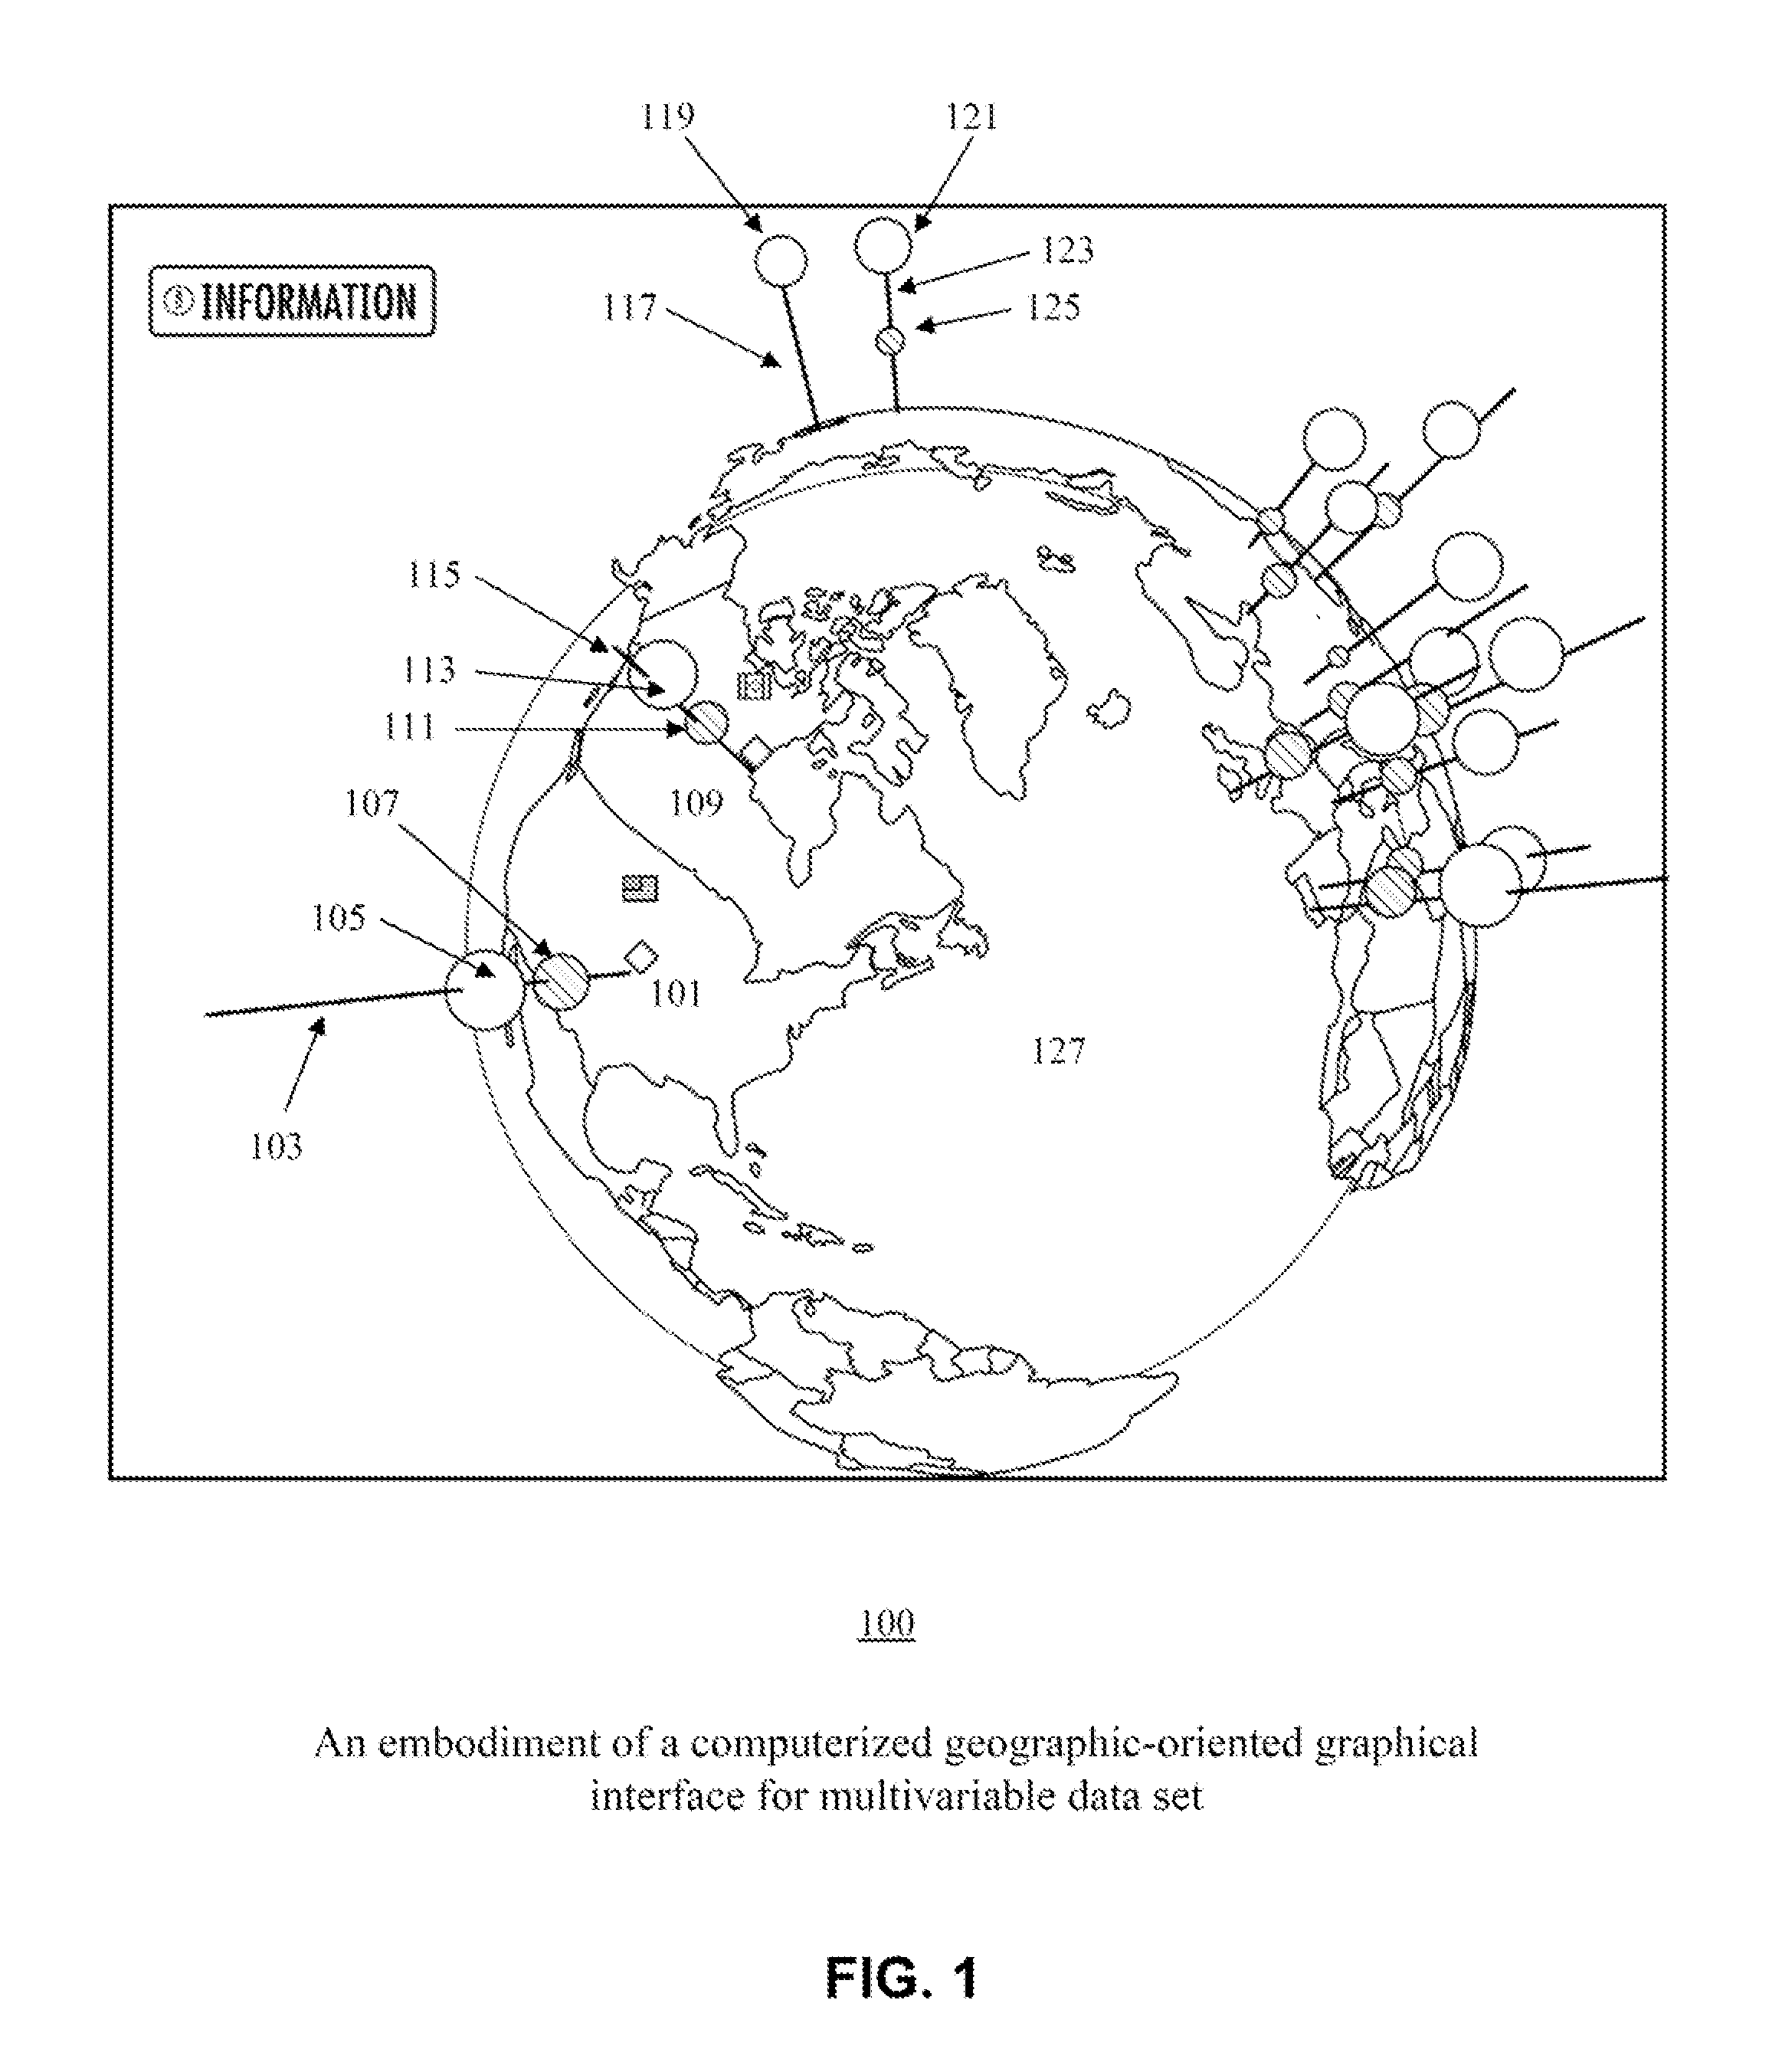
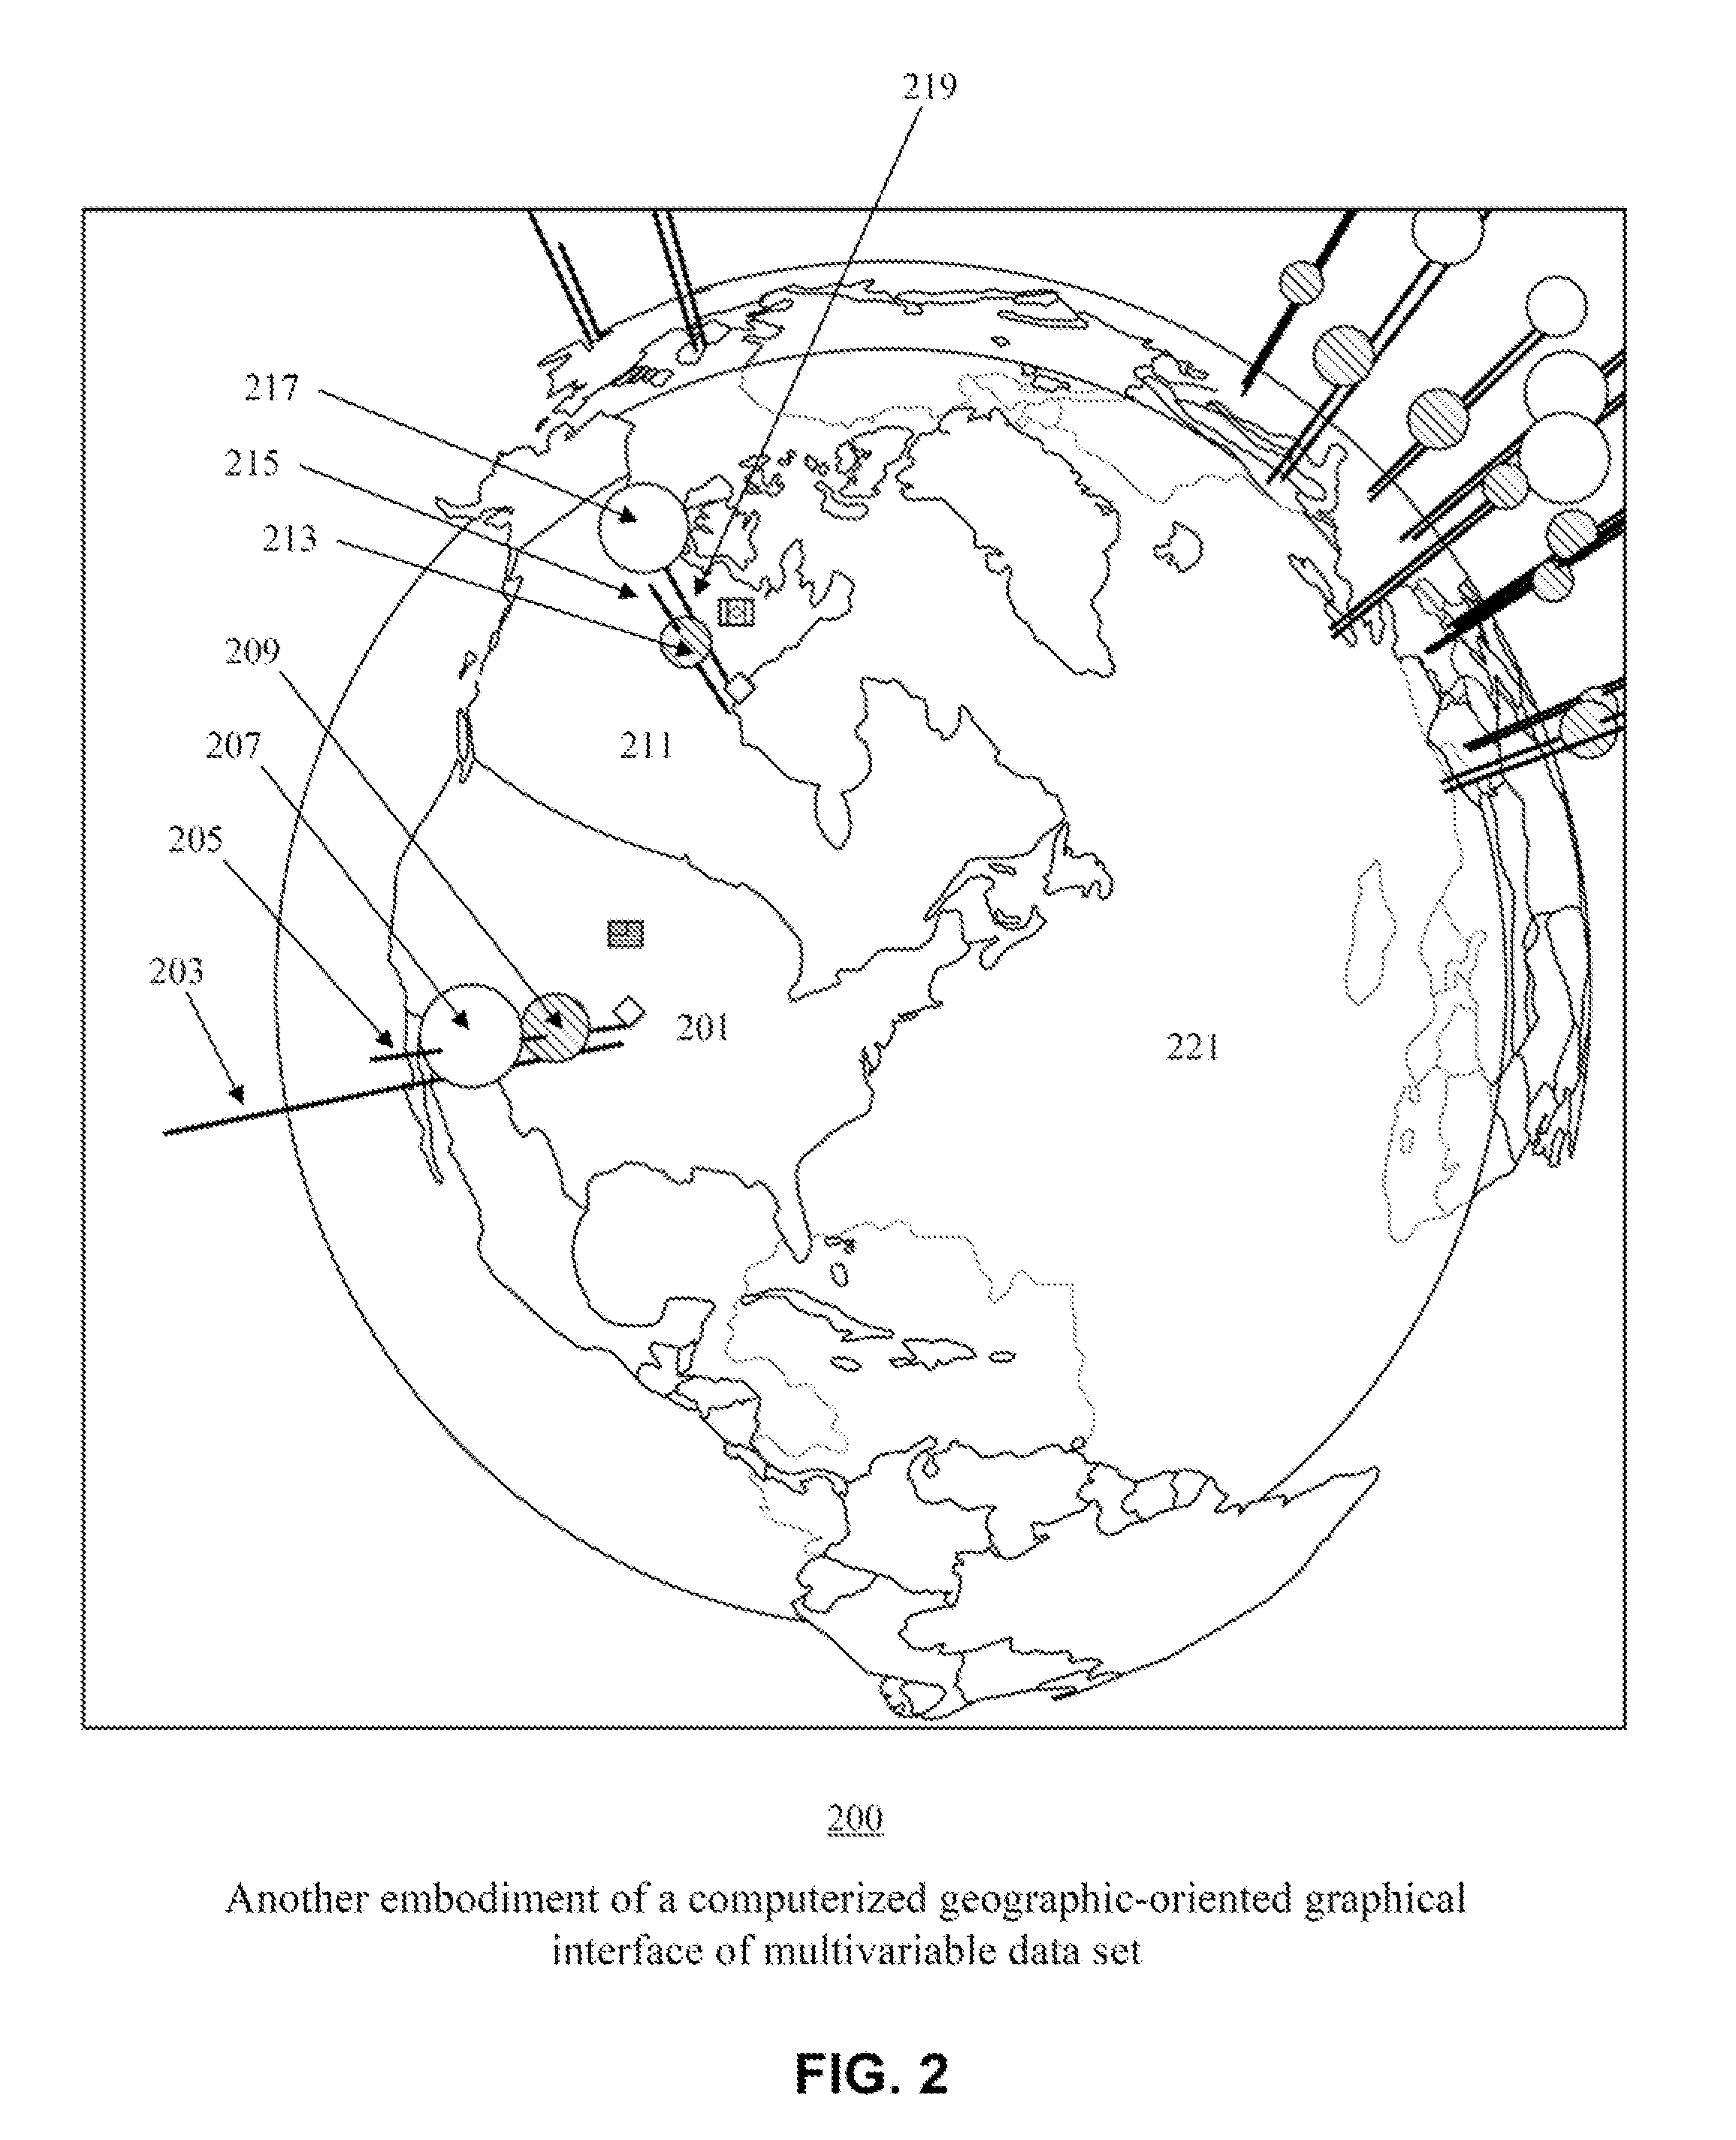
[0016]Specific embodiments of the invention will now be described in detail with reference to the accompanying figures. Like elements in the various figures are denoted by like reference numerals for consistency.

[0017]In the following detailed description of embodiments of the invention, numerous specific details are set forth in order to provide a more thorough understanding of the invention. However, it will be apparent to one of ordinary skill in the art that the invention may be practiced without these specific details. In other instances, well-known features have not been described in detail to avoid unnecessarily complicating the description.

[0018]The detailed description is presented largely in terms of procedures, logic blocks, processing, and / or other symbolic representations that directly or indirectly resemble a system or a method for geographic-oriented graphical representation of multivariable input data set. These process descriptions and representations are the means ...


PUM


Abstract

Methods and systems for computerized geographic-oriented graphical representation of multivariable input data sets are disclosed. In one embodiment, a graphical rendering application programming interface and a graphical rendering engine are configured to correlate the multivariable input data sets and other variables with geographical categories represented from geographic and map-related data, which are represented on a three-dimensional globe. In one example, the multivariable input data sets include a first input data set and a second input data set with multiple variables. A first member of the first input data set is represented as a sphere or a cube on top of a particular national or state boundary on the three-dimensional globe. Furthermore, a first member of the second input data set is represented as a stick erected from a geographic landmark, wherein the stick pierces the sphere or the cube representing the first member of the first input data set.

Description

FIELD OF THE INVENTION[0001]The present invention generally relates to information processing for intuitive visual representation of input data using one or more computerized systems and related methods. In particular, at least some embodiments of the present invention relate to methods and systems for geographic-oriented graphical representation of multivariable input data set.BACKGROUND OF THE INVENTION[0002]In the last several decades, computerized systems, such as personal computers (PC's), mainframe computers, mobile electronic devices, and other electronic devices, have been utilized for visual representation of a variety of input data on a display panel. In many cases, the visual representation of input data using a computerized system is part of an attempt to analyze input data more intuitively, and is also part of an endeavor to conceptualize a theme, a pattern, or a paradigm arising from the input data. In some instances, a mere graphical representation of input data as pi...

Claims


Application Information

Patent Timeline
Patent Type & Authority Applications(United States)
IPC IPC(8): G06T15/10
CPCG06T15/10G06T11/206
Inventor YOON, HARRY
Owner YOON HARRY
Why Eureka
Try Eureka