Data Analytics Animation System and Method

a data analytics and animation system technology, applied in the field of data analytics displays, can solve the problems of inconvenient presentation of animated visualizations, inability to visualize data in real time, and computational burden or slowness, and conventional systems are thus not very efficien

Inactive Publication Date: 2015-04-23
WALMART APOLLO LLC
View PDF16 Cites 17 Cited by
  • Summary
  • Abstract
  • Description
  • Claims
  • Application Information

AI Technical Summary

Benefits of technology

[0005]In accordance with one aspect of the present disclosure a method for animating data analytics on a display is provided. The method includes receiving, at a processor, a first request to display a set of data, the set of data including a plurality of data dimensions having respective data. The method includes generating one or more visualizations of the set of data corresponding to at least two data dimensions. The method includes applying a filter to select one or more data ranges to be displayed along the at least two data dimensions. The method includes displaying each of the one or more visualizations at respective sets of pixels of the display based upon the applied filter. The method includes generating respective animations of the displayed one or more visualizations by simultaneously displaying respective variations in the at least two data dimensions on the respective sets of the pixels of the display. The method includes altering, as the filter is applied, at least one data dimension such that the one or more visualizations are concurrently updated during the respective animations to reflect the altered at least one data dimension.
[0006]In accordance with one aspect of this disclosure, a computer readable medium storing computer executable instructions thereupon for animating data analytics on a display is provided. The instructions when executed by a processor cause the processor to receive a first request, at the input-output interface, to display the set of data, the set of data including a plurality of data dimensions having respective data, generate at least two visualizations of the set of data corresponding to at least two data dimensions, apply a filter to select one or more data ranges to be displayed along the at least two data dimensions, display, at the display, each of the at least two visualizations at respective at least two sets of pixels of the display, generate respective animations of the displayed at least two visualizations by simultaneously displaying respective variations in the at least two data dimensions on the respective at least two sets of the pixels of the display to a viewer viewing the display, and alter, as the filter is applied, at least one data dimension such that the at least two visualizations are updated during the respective animations to reflect the altered at least one data dimension.
[0007]In accordance with one aspect of this disclosure, a data analytics animation system is provided. The data analytics animation system includes a computing device. The computing device includes a database including a memory having instructions stored thereupon to animate data analytics associated with a set of data stored in the database, a processor coupled to the database, an input-output interface coupled to the processor, and a display unit coupled to the processor. The instructions when executed by the processor, cause the processor to receive a first request, at the input-output interface, to display the set of data, the set of data including a plurality of data dimensions having respective data, generate at least two visualizations of the set of data corresponding to at least two data dimensions, apply a filter to select one or more data ranges to be displayed along the at least two data dimensions, display, at the display, each of the at least two visualizations at respective at least two sets of pixels of the display, generate respective animations of the displayed at least two visualizations by simultaneously displaying respective variations in the at least two data dimensions on the respective at least two sets of the pixels of the display to a viewer viewing the display, and alter, as the filter is applied, at least one data dimension such that the at least two visualizations are updated during the respective animations to reflect the altered at least one data dimension.

Problems solved by technology

However, even with the updating, these linked visualizations do not offer much flexibility in visualizing the data in real time as the data is being updated or other parameters of the data are being selected different from the ones being displayed through the visualizations.
For example, such visualizations, such as those implemented using Google Analytics, are restricted to specific languages and environments for statistical computing and graphics, such as “R”, which are computationally burdensome or slow.
Such conventional systems are thus not very efficient when presenting animated visualizations to a time-pressed audience, e.g., C-level executives (Chief Executive Officers or CEOs, etc.).

Method used


Image

  • Data Analytics Animation System and Method
  • Data Analytics Animation System and Method
  • Data Analytics Animation System and Method

Examples


Embodiment Construction

[0016]The aspects of this disclosure are not limited in its application to the details of construction and the arrangement of components set forth in the following description or illustrated in the drawings. The aspects of this disclosure may be configured to be carried out in various ways. Also, the phraseology and terminology used herein is for the purpose of description and should not be regarded as limiting. The use of “including,”“comprising,”“having,”“containing,”“involving,” and variations thereof herein is meant to encompass the items listed thereafter and equivalents thereof as well as additional items.

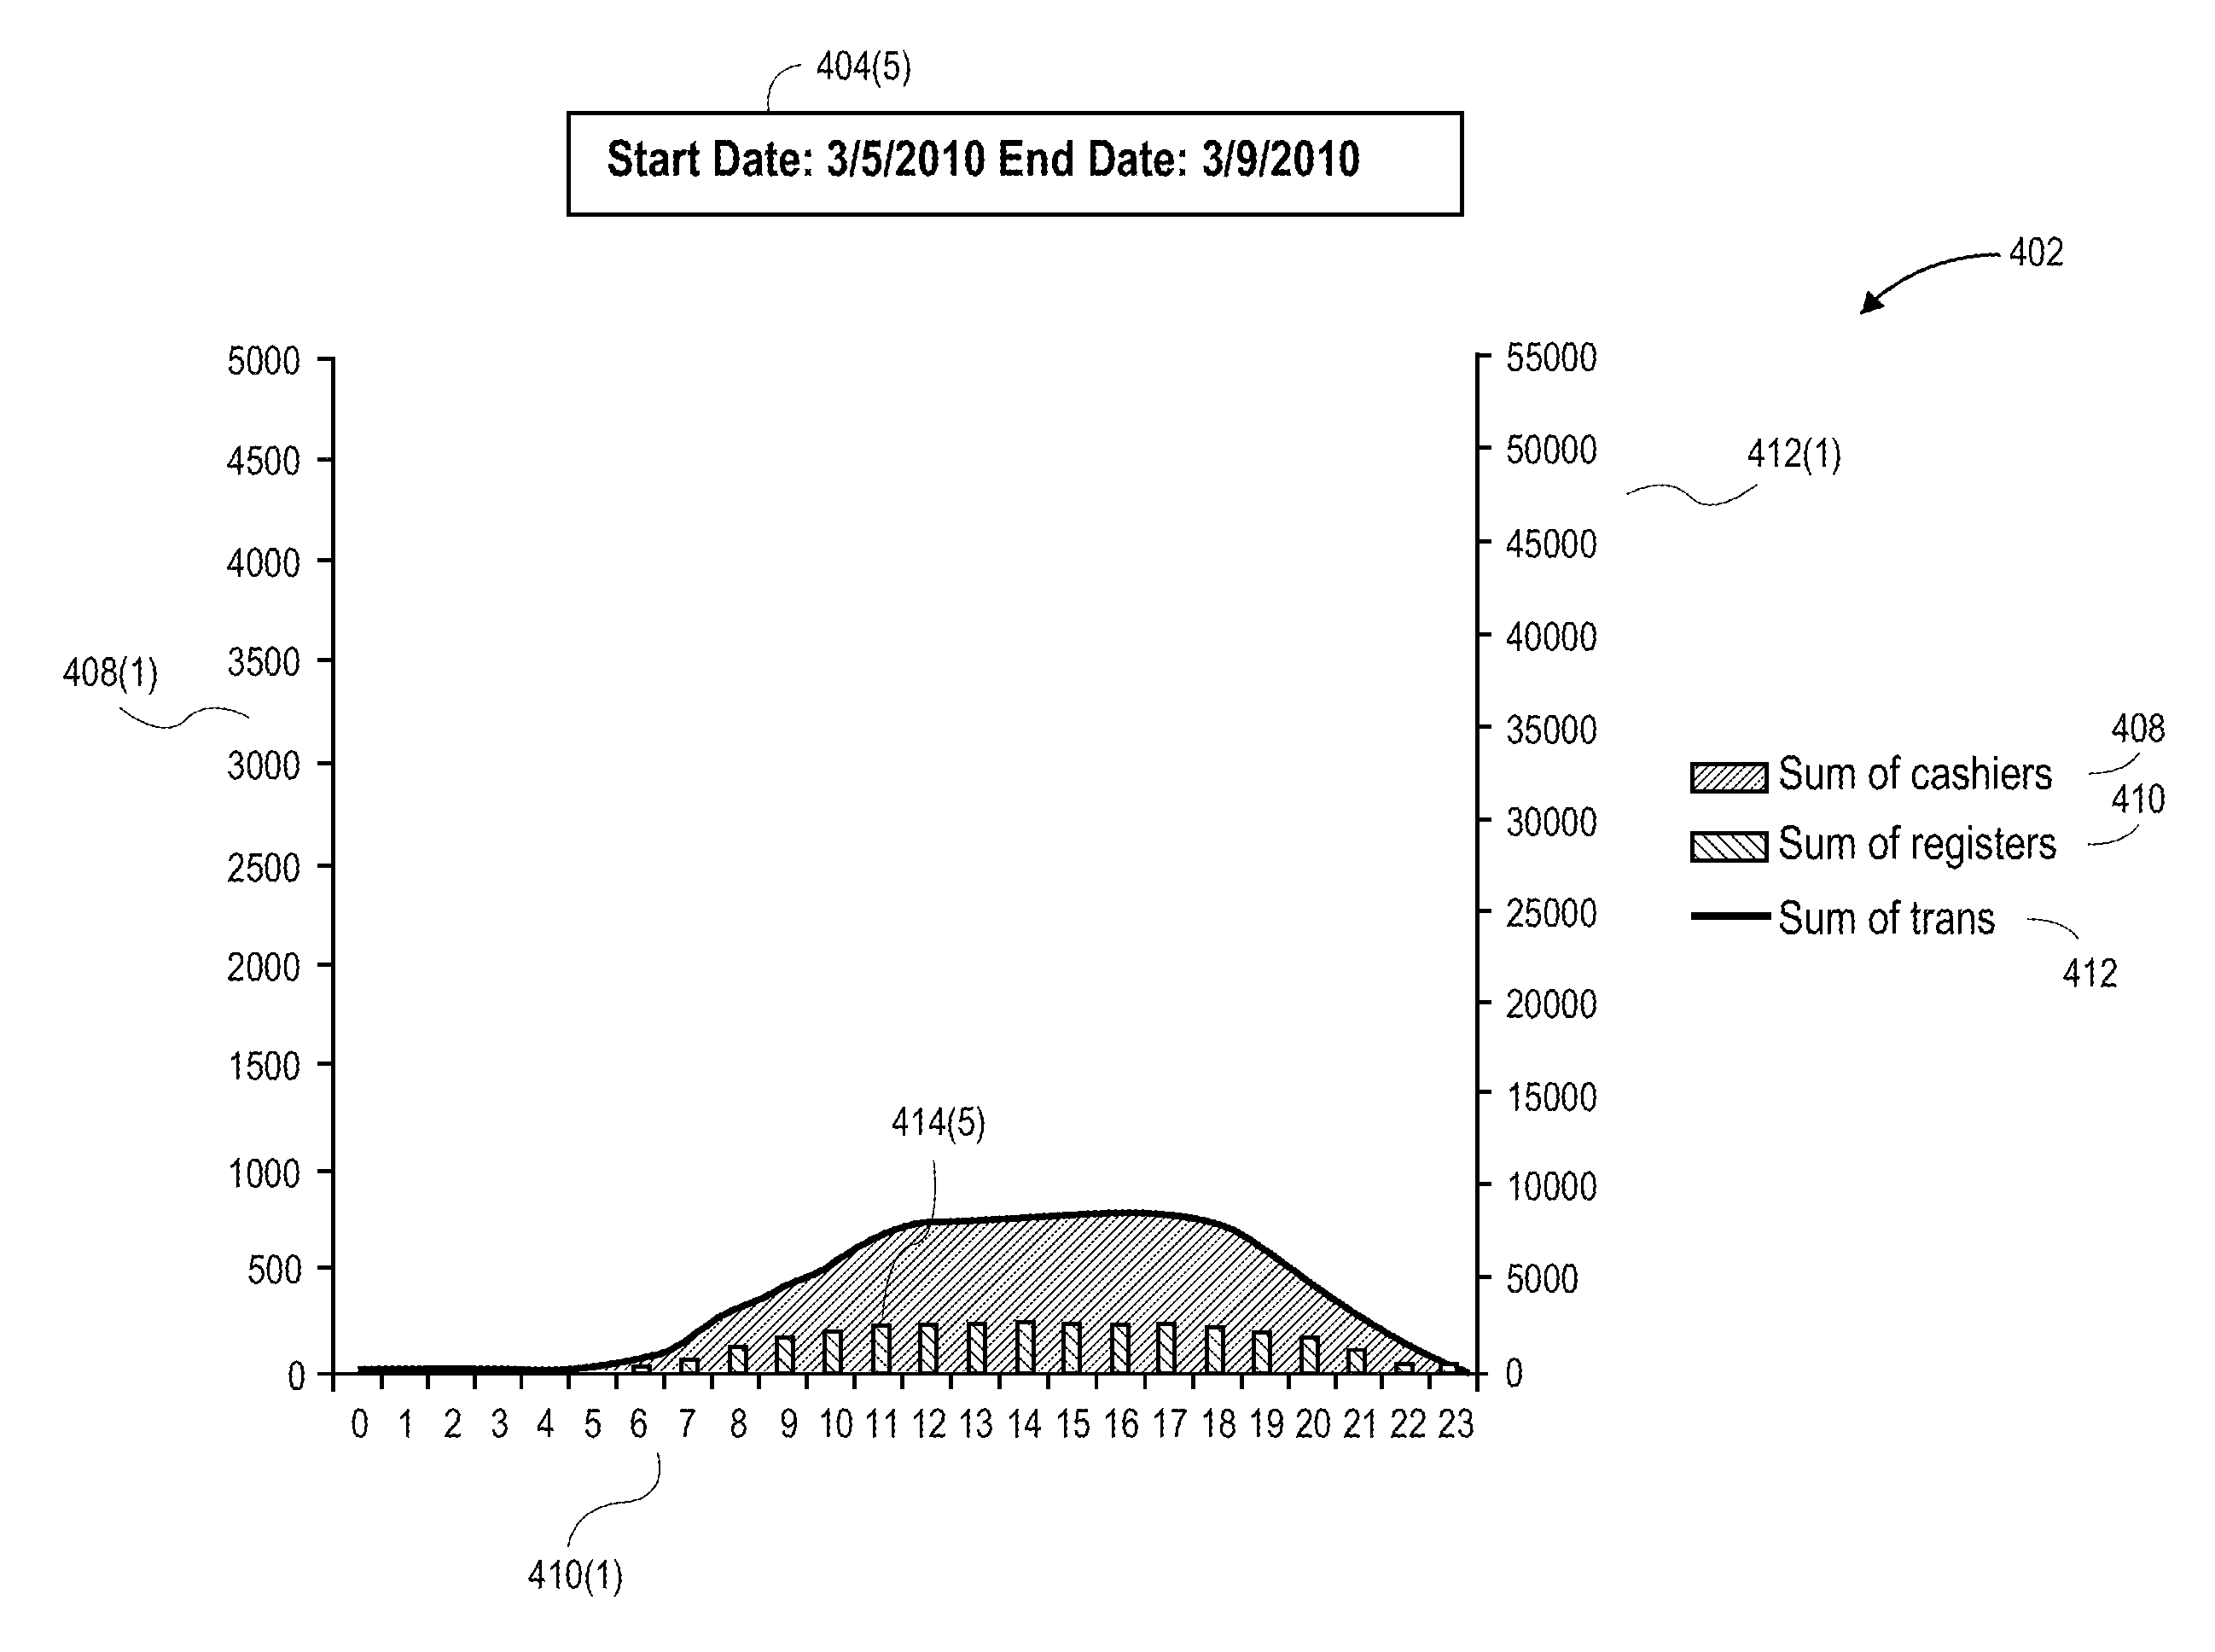
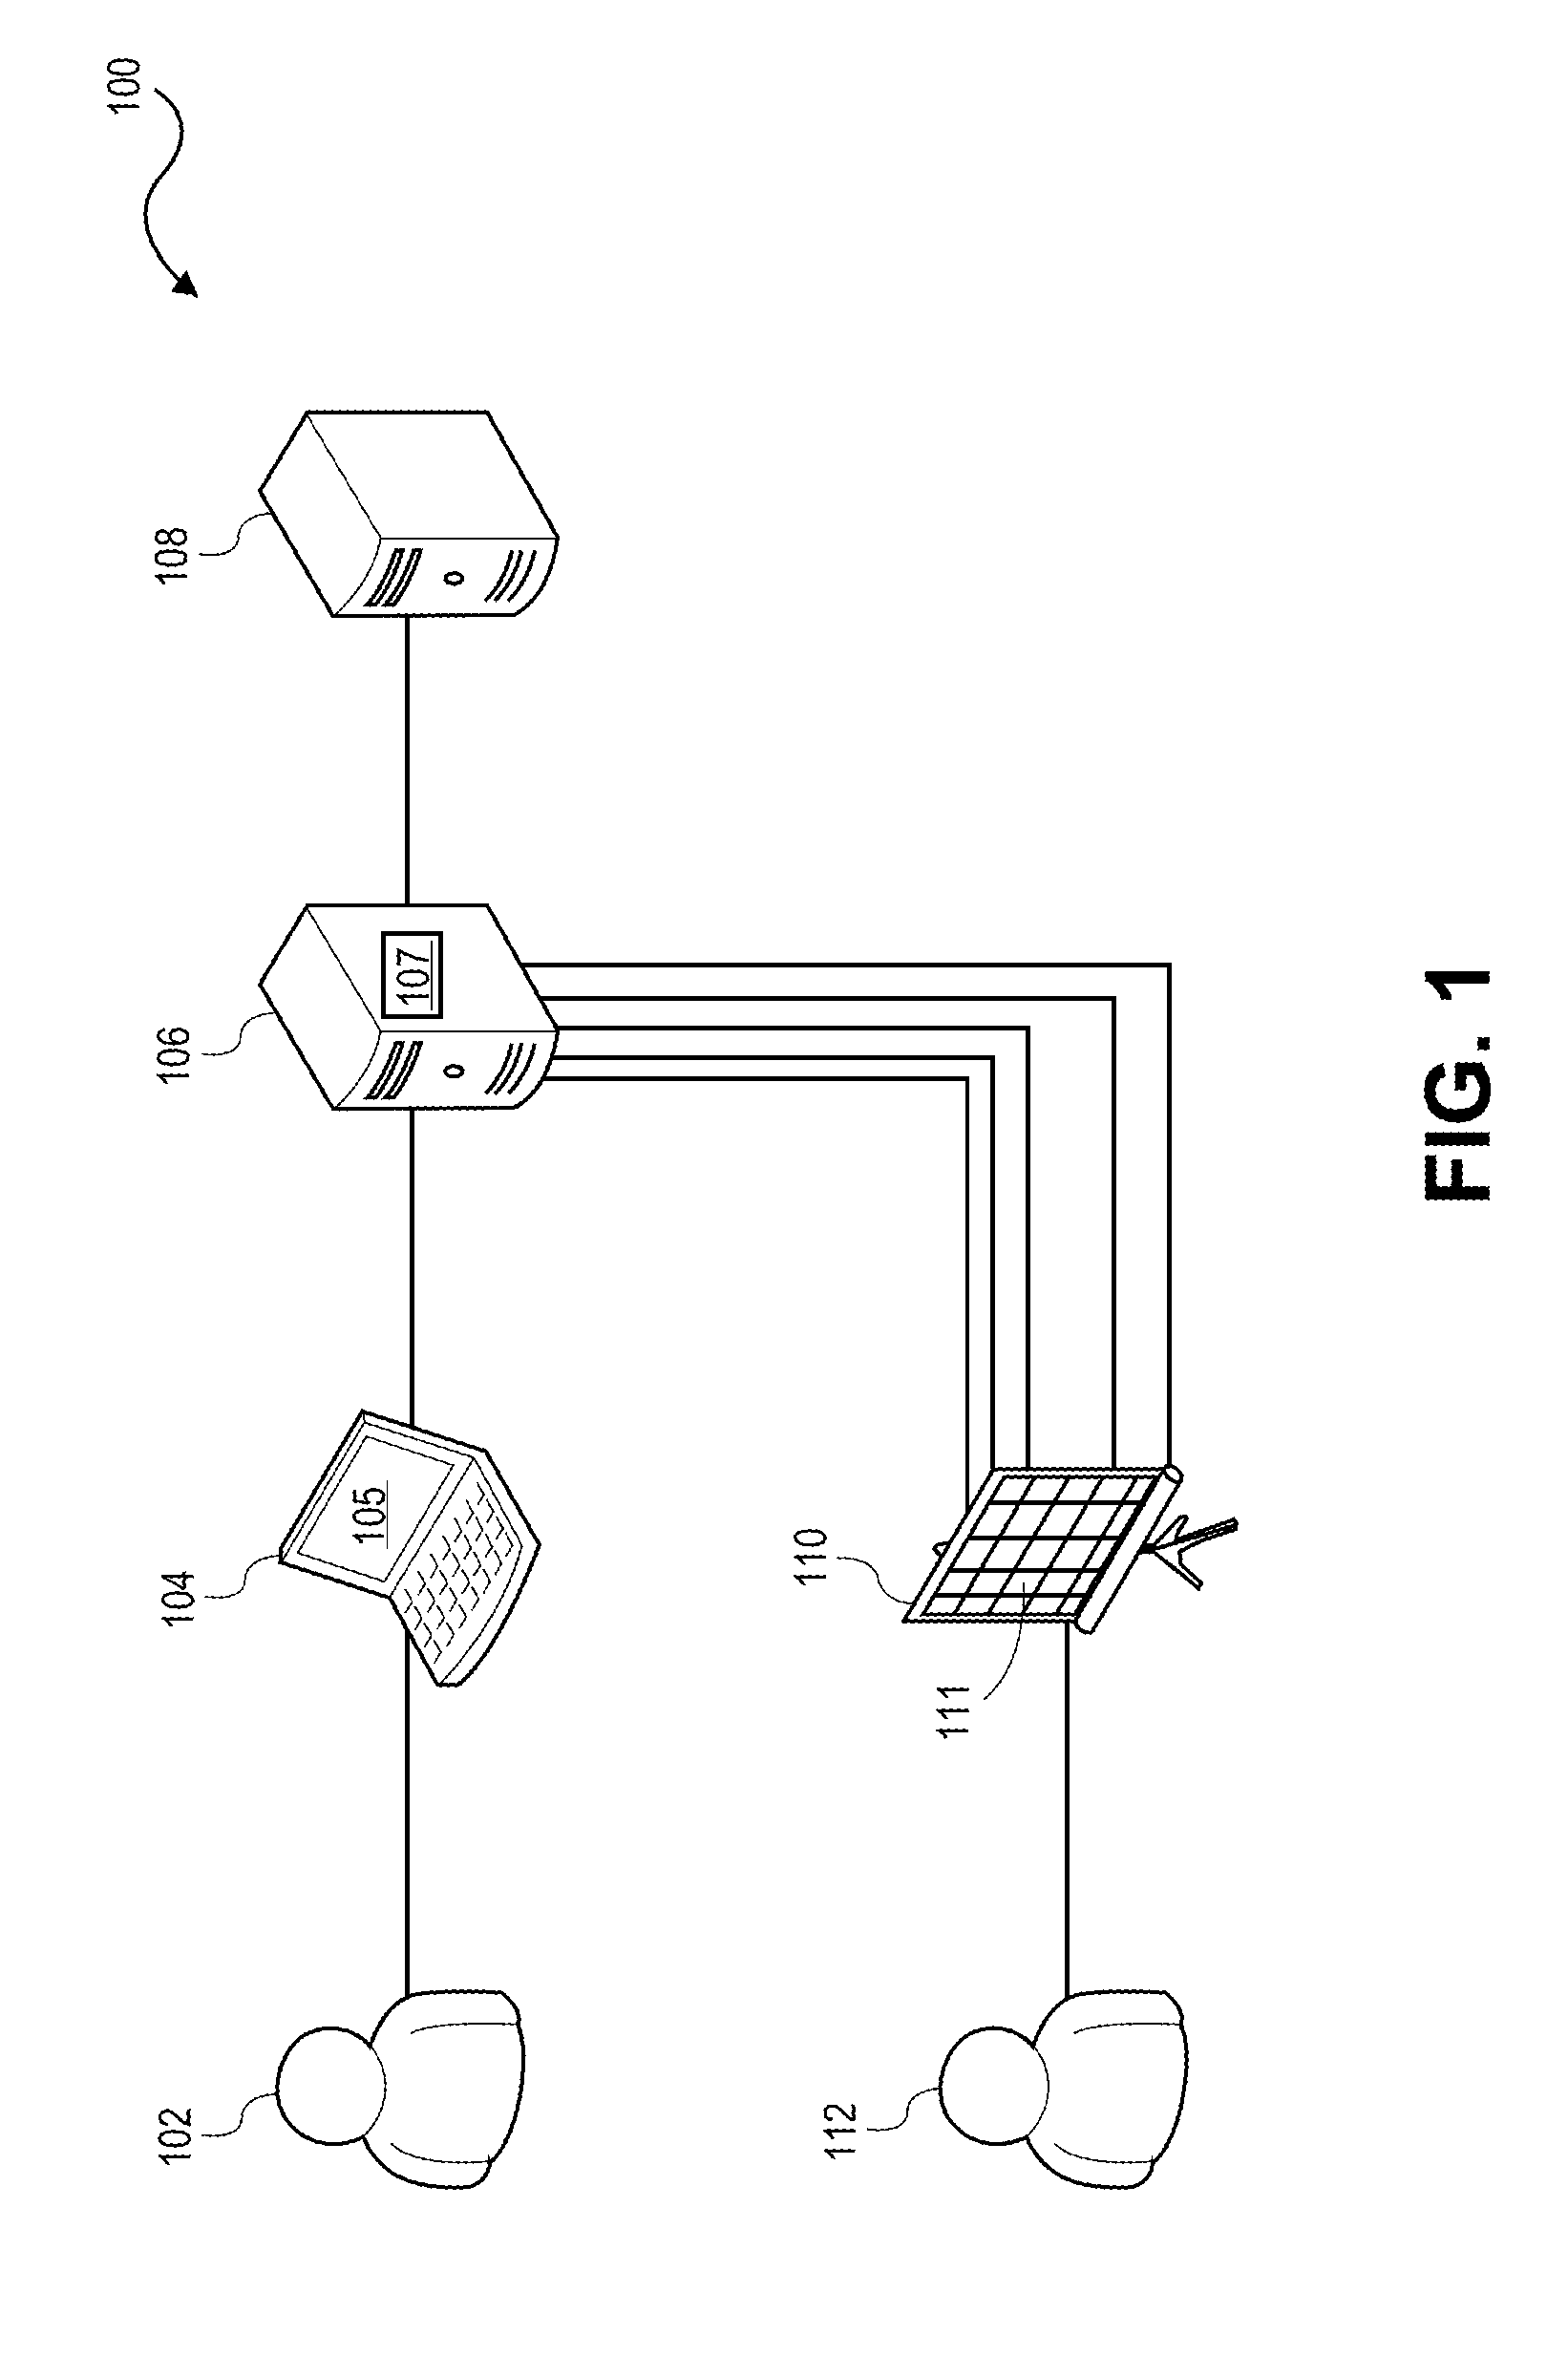
[0017]An aspect of the present disclosure is directed to a data analytics animation system 100 illustrated in FIG. 1. The data analytics animation system 100 is generally configured to show visualizations of different analytical model results displayed in motion using Video Cassette Recorder or “VCR” type controls to switch to different presentation formats such as fast-forwa...


PUM


Abstract

A method for animating data analytics on a display is provided. The method includes receiving, at a processor, a first request to display a set of data, the set of data including a plurality of data dimensions having respective data. The method includes generating one or more visualizations of the set of data corresponding to at least two data dimensions. The method includes applying a filter to select one or more data ranges to be displayed along the at least two data dimensions. The method includes displaying each of the one or more visualizations at respective sets of pixels of the display based upon the applied filter. The method includes generating respective animations of the displayed one or more visualizations by simultaneously displaying respective variations in the at least two data dimensions on the respective sets of the pixels of the display.

Description

FIELD OF THE DISCLOSURE[0001]An aspect of the present disclosure is generally related to data analytics displays, and more particularly to a data analytics animation system and method.BACKGROUND OF THE DISCLOSURE[0002]Conventional visualizations of data analytics, for example, charts and graphs, are fixed or static visualizations with respect to time or other data dimension. Certain linked visualizations navigate through data dimensions and update other visualizations on more than one display areas or panels. However, even with the updating, these linked visualizations do not offer much flexibility in visualizing the data in real time as the data is being updated or other parameters of the data are being selected different from the ones being displayed through the visualizations. For example, such visualizations, such as those implemented using Google Analytics, are restricted to specific languages and environments for statistical computing and graphics, such as “R”, which are compu...

Claims


Application Information

Patent Timeline
Patent Type & Authority Applications(United States)
IPC IPC(8): G06F3/0484
CPCG06F3/0484G06F9/451G06F16/248
Inventor HIGH, DONALDATCHLEY, MICHAELDODDA, PRAVEEN
Owner WALMART APOLLO LLC
Why Eureka
Try Eureka