Heartbeat Categorization
a technology of heartbeat and categorization, applied in the field of electrophysiology, can solve the problem that none of these applications combine signals of multiple cardiac channels
- Summary
- Abstract
- Description
- Claims
- Application Information
AI Technical Summary
Benefits of technology
Problems solved by technology
Method used
Image
Examples
embodiment 100
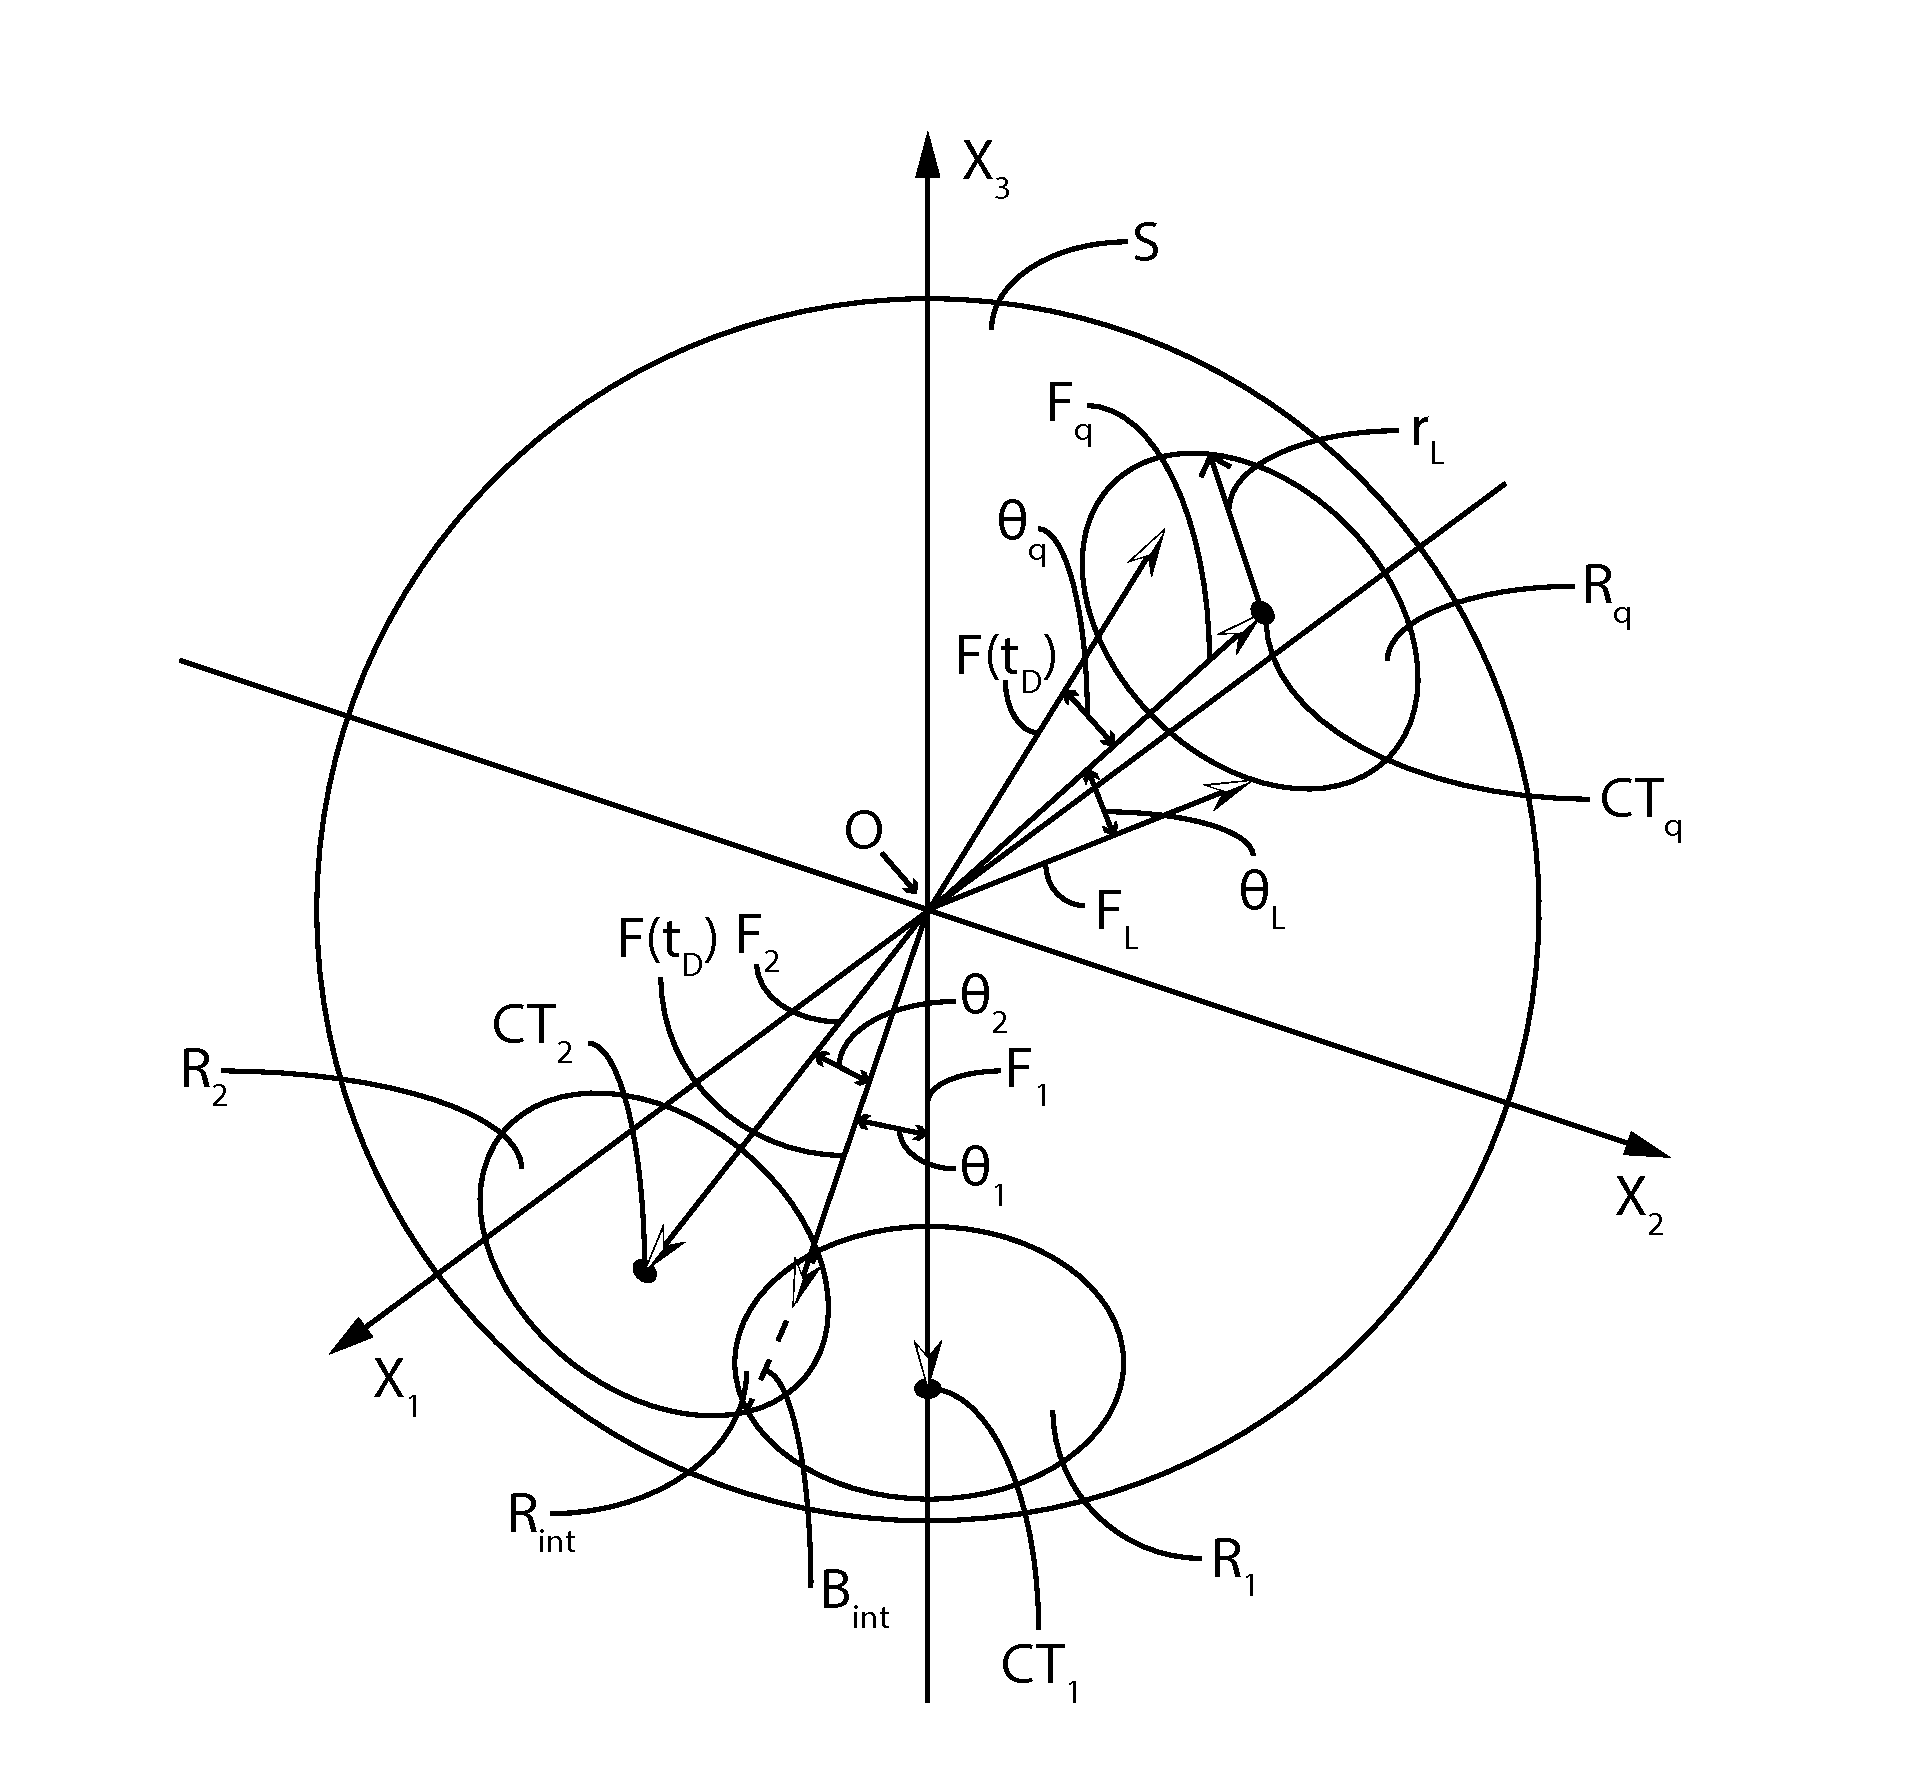
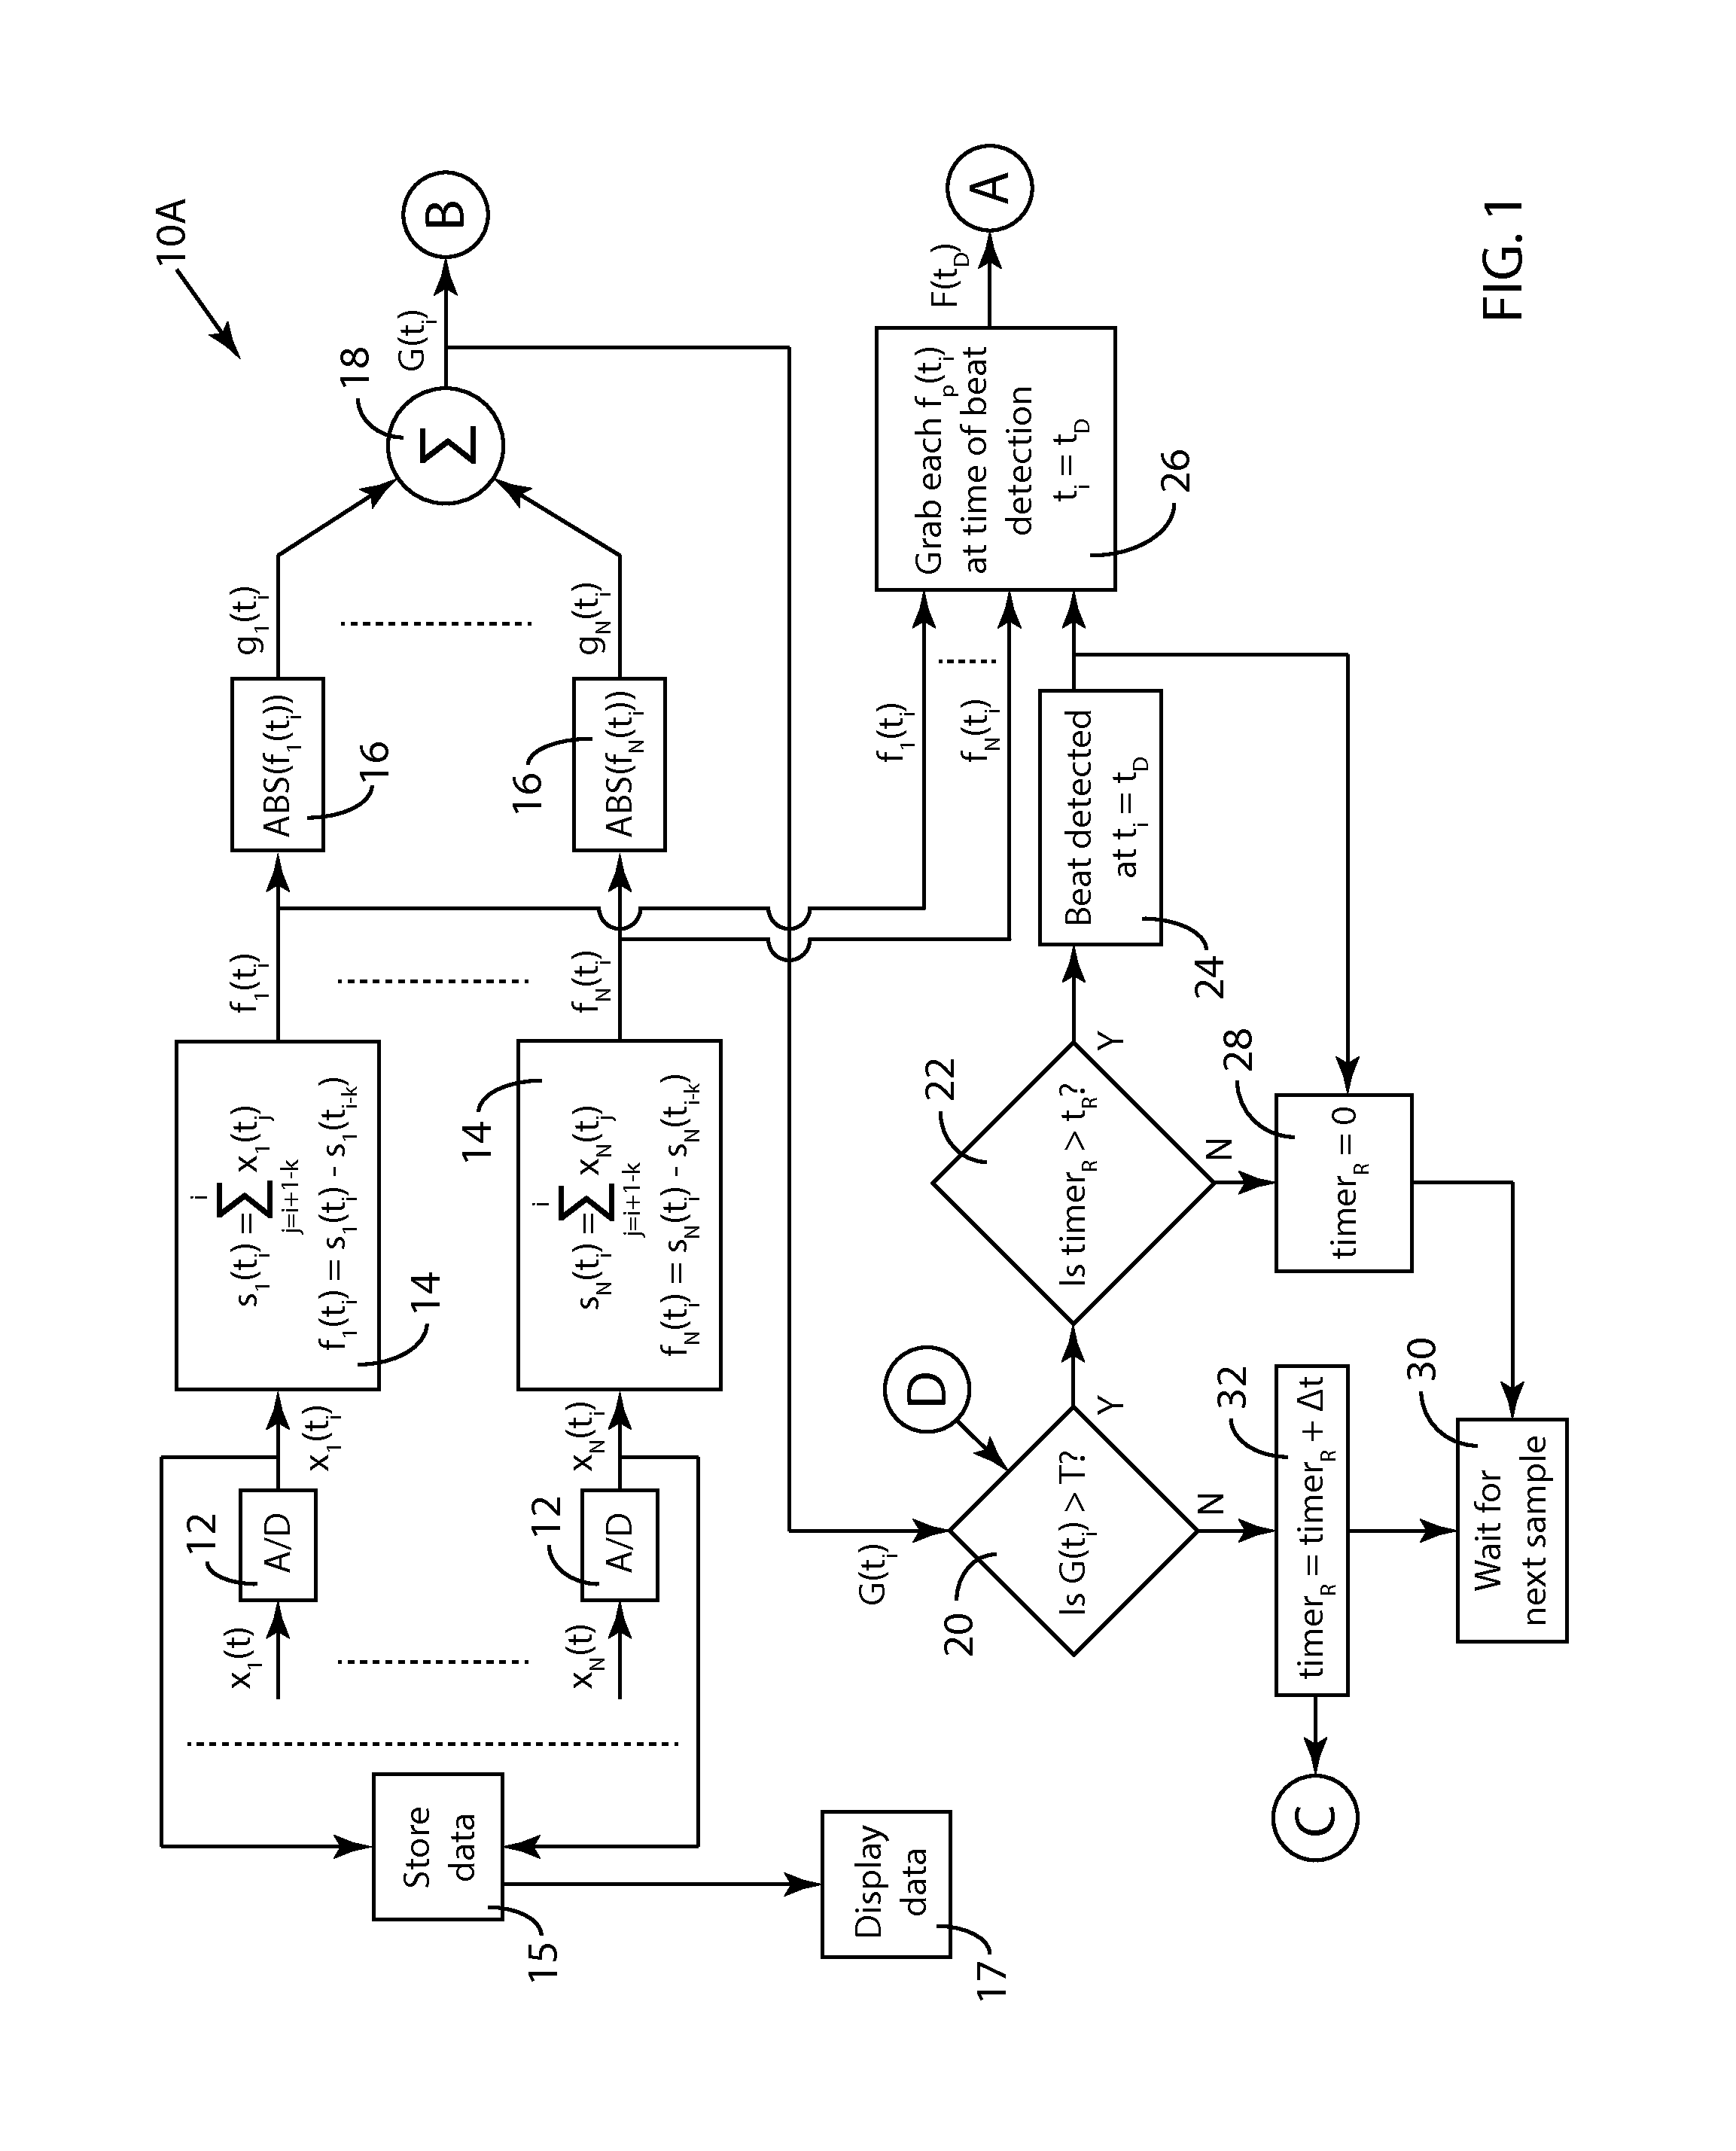
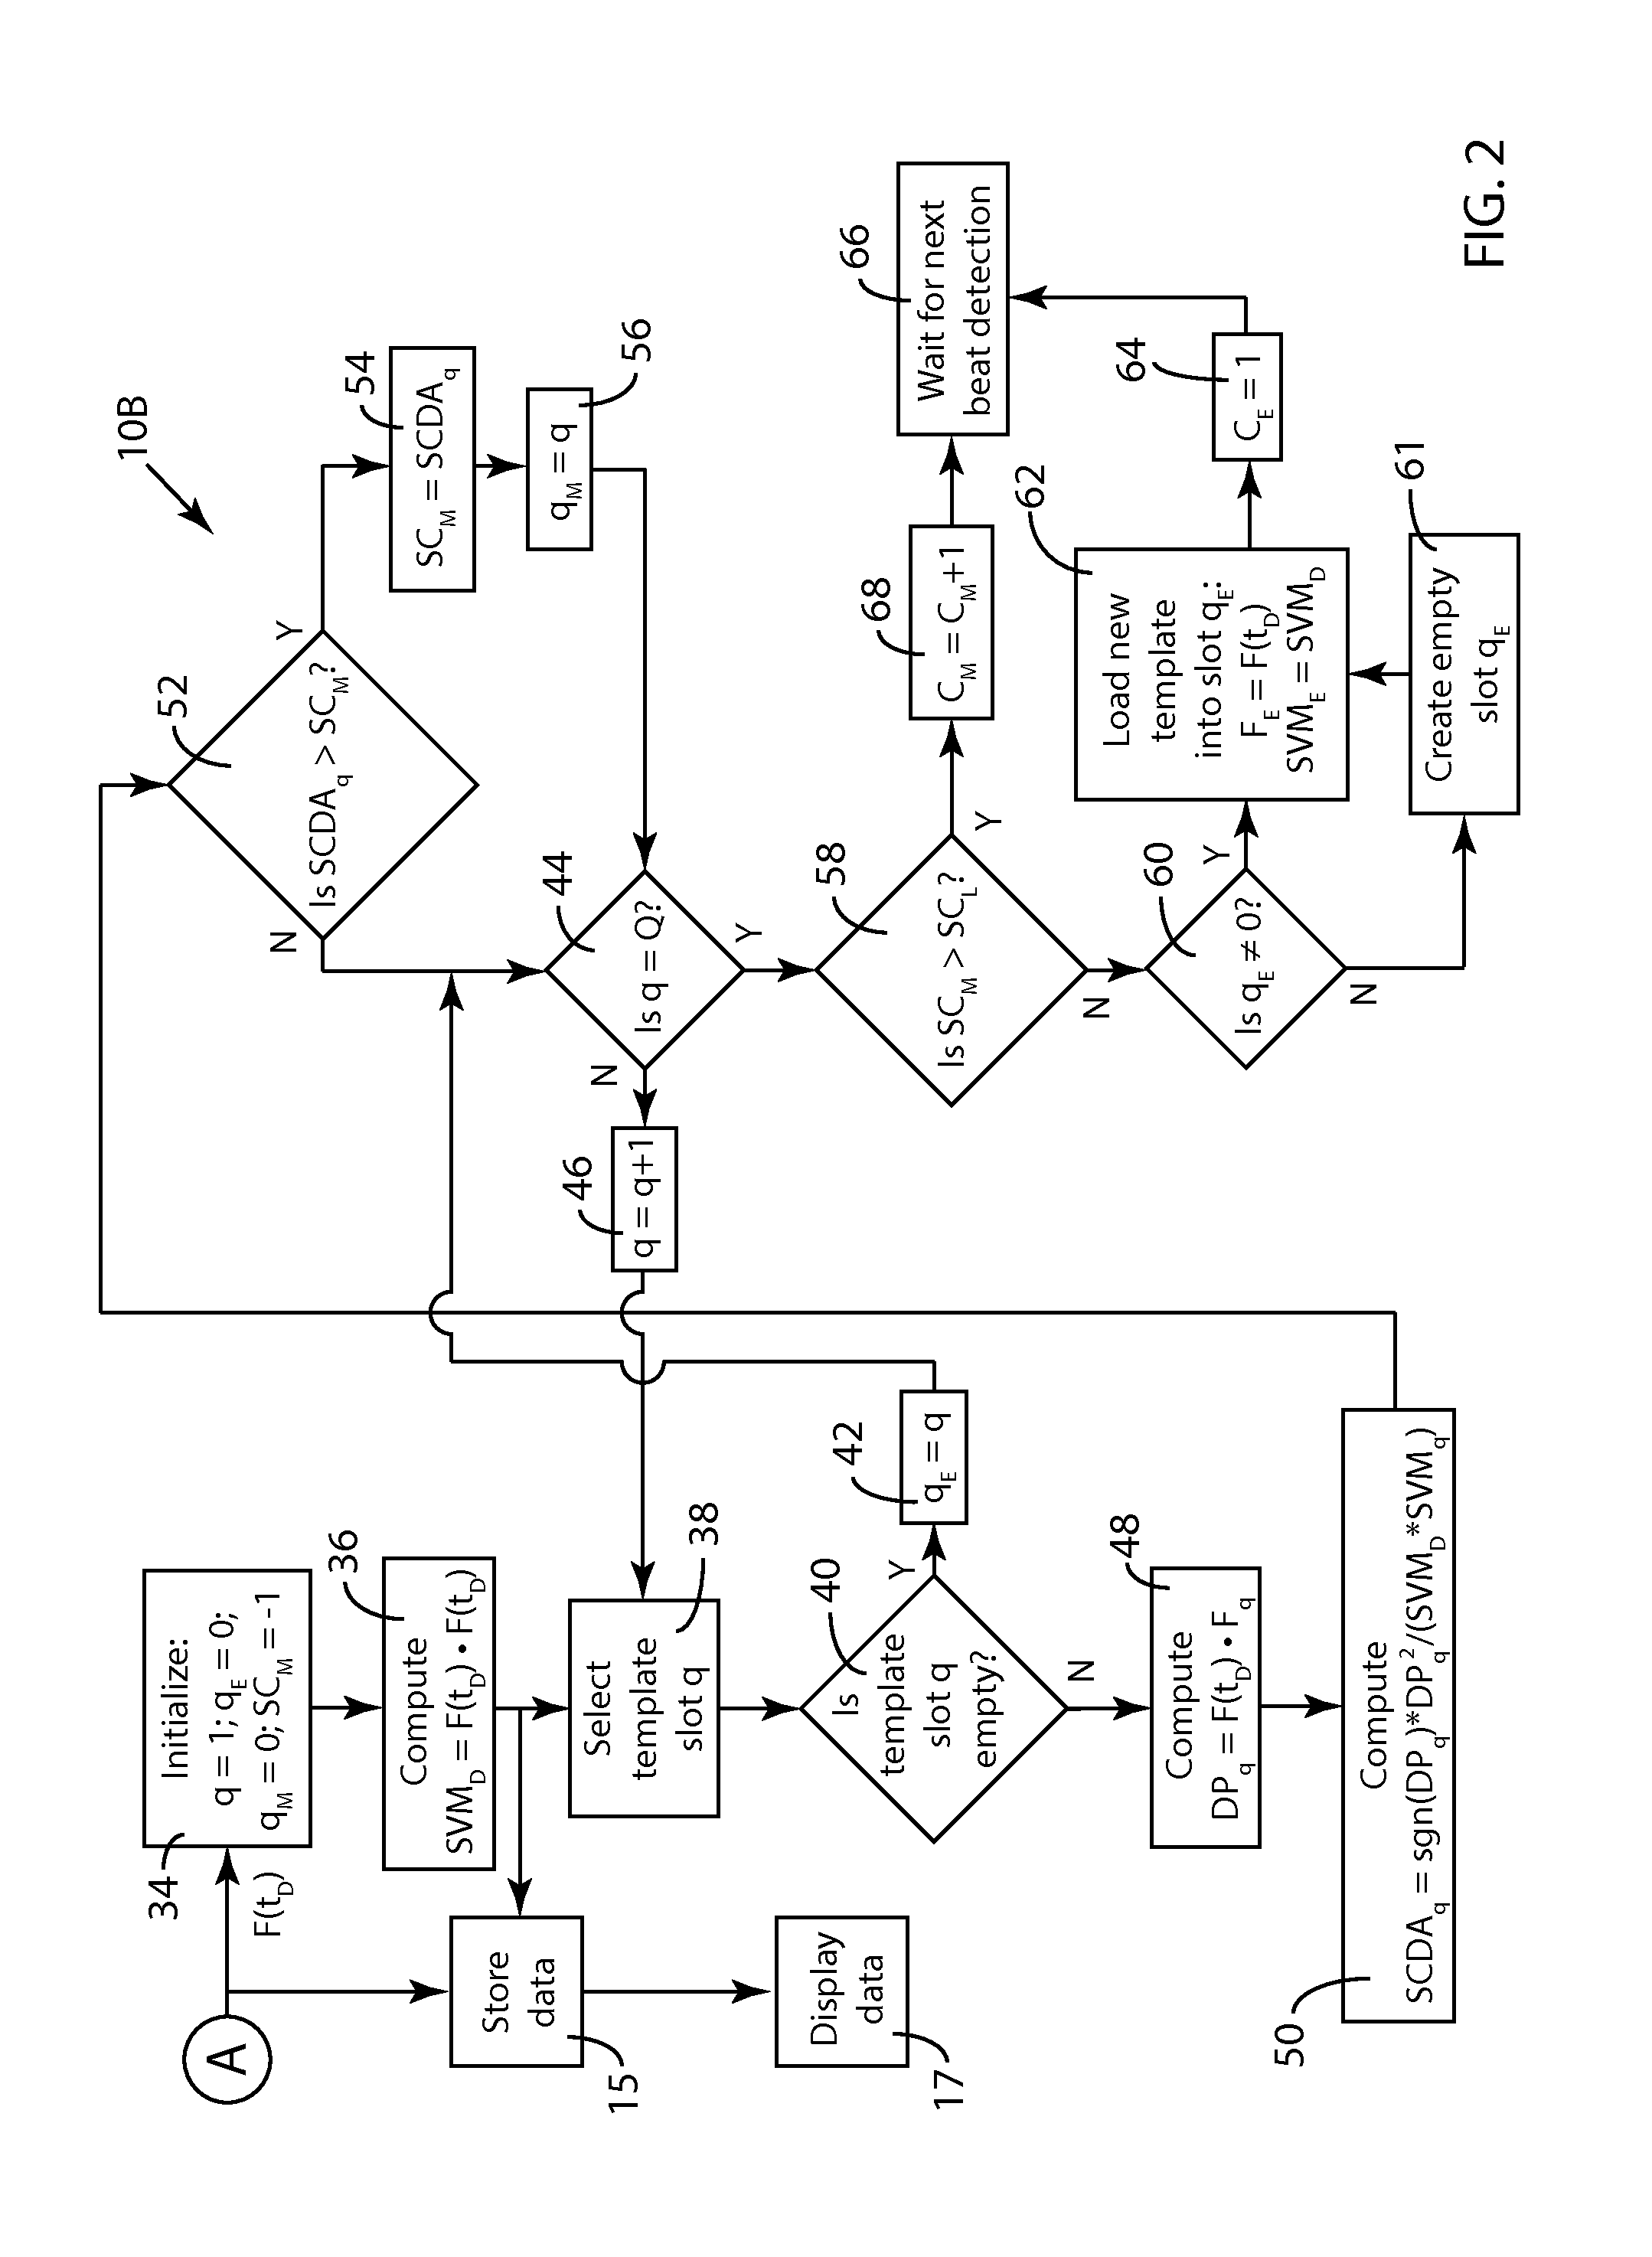
where δ=a time period after heartbeat detection time tD. In other words, vector F(tD) is now a vector associated with the heartbeat detected at time t, which has 2N components, the second set of which are the N velocities of the selected ECG signals at time tD+δ. In embodiment 100, vector F(tD) contains the N velocity components at detection time tD and N velocity components of the same ECG signals but measured at time tD+δ.
[0141]Adapting embodiment 100 to the example of FIGS. 6A-9D in which N=3, vector F(tD) now becomes F(tD)={f1(tD), f(2(tD), f3(tD), f1(tD+k), f2(tD+k), fN(tD+k)} where k=20. Thus, the three additional velocity components of F(tD) are the velocities of the selected ECG signals measured one boxcar width k after detection time tD. FIGS. 16A-16C are modified versions of FIGS. 11A-11C, showing a portion of the ECG signals of FIGS. 6A-6C which include a single detected heartbeat. The modifications in FIGS. 16A-16C for the example of FIGS. 6A-11D indicate the time at whi...
embodiment 160
[0160]FIG. 24A is a block diagram schematic of an embodiment 160 in which categorization fiducial time tC is determined to be at a preset time tPS after the start time t0 of a detected heartbeat. In flow chart element 162, start time t0 is determined as the time at which velocity sum G(t) rises above a heartbeat-pending threshold Tp and remains above Tp until G(t) rises above a heartbeat-confirming threshold Tc. Flow chart element 164 simply illustrates this setting of time tC at preset time tPS after start time t0.
[0161]FIG. 24B is a plot of a representative time trace of G(t) illustrating the determination of categorization fiducial time tC as outlined in FIG. 24A. The cardiac cycle in FIG. 24B begins at time 1.765 seconds and ends at time 2.821 seconds. The determination of start time t0 in flow chart element 162 includes the computation of the median of sum G(t) across the cardiac cycle, and the median of G(t) in FIG. 24B is found to be 70. Heartbeat-pending threshold Tp is set...
embodiment 170
[0166]FIG. 25A is a block diagram schematic of an embodiment 170 in which the categorization fiducial time tC is determined as the time at which a cross-correlation XC(t) of sum G(t) and a shape function SXC becomes greater than a correlation threshold TXC. Flow chart element 174 provides shape function SXC to flow chart element 172 in which cross-correlation XC(t) is computed. In flow chart element 176, the time tX at which cross-correlation XC(t) becomes greater than correlation threshold TXC is determined. Threshold TXC in this example is shown as 0.3 (30% of the peak value of XC(t) since XC(t) has been normalized to have a maximum value of 1.) In flow chart element 176, categorization fiducial time tC is set to tX.
[0167]FIG. 25B illustrates two possible shape functions SXC to be used to cross-correlate with sum G(t) in the embodiment 170 of FIG. 25A. Shape function 174T is triangular in shape, and shape function 174P is parabolic in shape. Shape functions 174T and 174P are show...
PUM
 Abstract
Description
Claims
Application Information
 - R&D
- Intellectual Property
- Life Sciences
- Materials
- Tech Scout
- Unparalleled Data Quality
- Higher Quality Content
- 60% Fewer Hallucinations
Browse by: Latest US Patents, China's latest patents, Technical Efficacy Thesaurus, Application Domain, Technology Topic, Popular Technical Reports.
© 2025 PatSnap. All rights reserved.Legal|Privacy policy|Modern Slavery Act Transparency Statement|Sitemap|About US| Contact US: help@patsnap.com


