

Gene expression profile algorithm for calculating a recurrence score for a patient with kidney cancer
a gene expression profile and patient technology, applied in the field of molecular diagnostic assays, can solve the problems of inaccurate prognostic information, lack of concordance, and inability to perform surgery
- Summary
- Abstract
- Description
- Claims
- Application Information
AI Technical Summary
Benefits of technology
Problems solved by technology
Method used
Image

Examples
example 1
Selection of Genes for Algorithm Development
[0140]A gene identification study to identify genes associated with clinical recurrence is described in U.S. Provisional Application Nos. 61 / 294,038, filed Jan. 11, 2010, and 61 / 346,230, filed May 19, 2010, and in U.S. Application Publication No. 2011 / 0171633, filed Jan. 7, 2011, and published Jul. 14, 2011 (all of which are hereby incorporated by reference). Briefly, patients with stage I-III ccRCC who underwent nephrectomy at Cleveland Clinic between 1985 and 2003 with archived paraffin-embedded nephrectomy samples were identified. RNA was extracted from 6×10 μm dissected tumor sections and RNA expression quantified for 732 genes (including 5 reference genes) using RT-PCR. The primary endpoint was recurrence-free interval (RFI), defined as time from nephrectomy to first recurrence or death clue to RCC. 931 patients with complete clinical / pathology data and tissue blocks were evaluable. Patient characteristics were: 63% male, median age 6...
example 2
Algorithm Development
[0143]The genes identified in the studies described in Example 1 were considered for inclusion in the Recurrence Score. A smaller set of 72 genes was selected as follows:[0144]29 genes associated with RFI after covariate adjustment and FDR control at 10% using Storey's procedure (Storey J D (2002) A direct approach to false discovery rates. Journal of the Royal Statistical Society: Series B 64:479-498; Storey J D, Taylor J E, Siegmund D O (2004) Strong control, conservative point estimation and simultaneous conservative consistency of false discovery rates: a unified approach. Journal of the Royal Statistical Society, Series B 66:187-205).[0145]14 genes most significant before covariate adjustment[0146]12 genes members of VEGF / mTOR pathways[0147]17 genes were selected by principal component analysis to identify genes from additional pathways
[0148]To determine the association between each of the 72 genes and RFI, univariate and multivariable analyses were used. T...
example 3
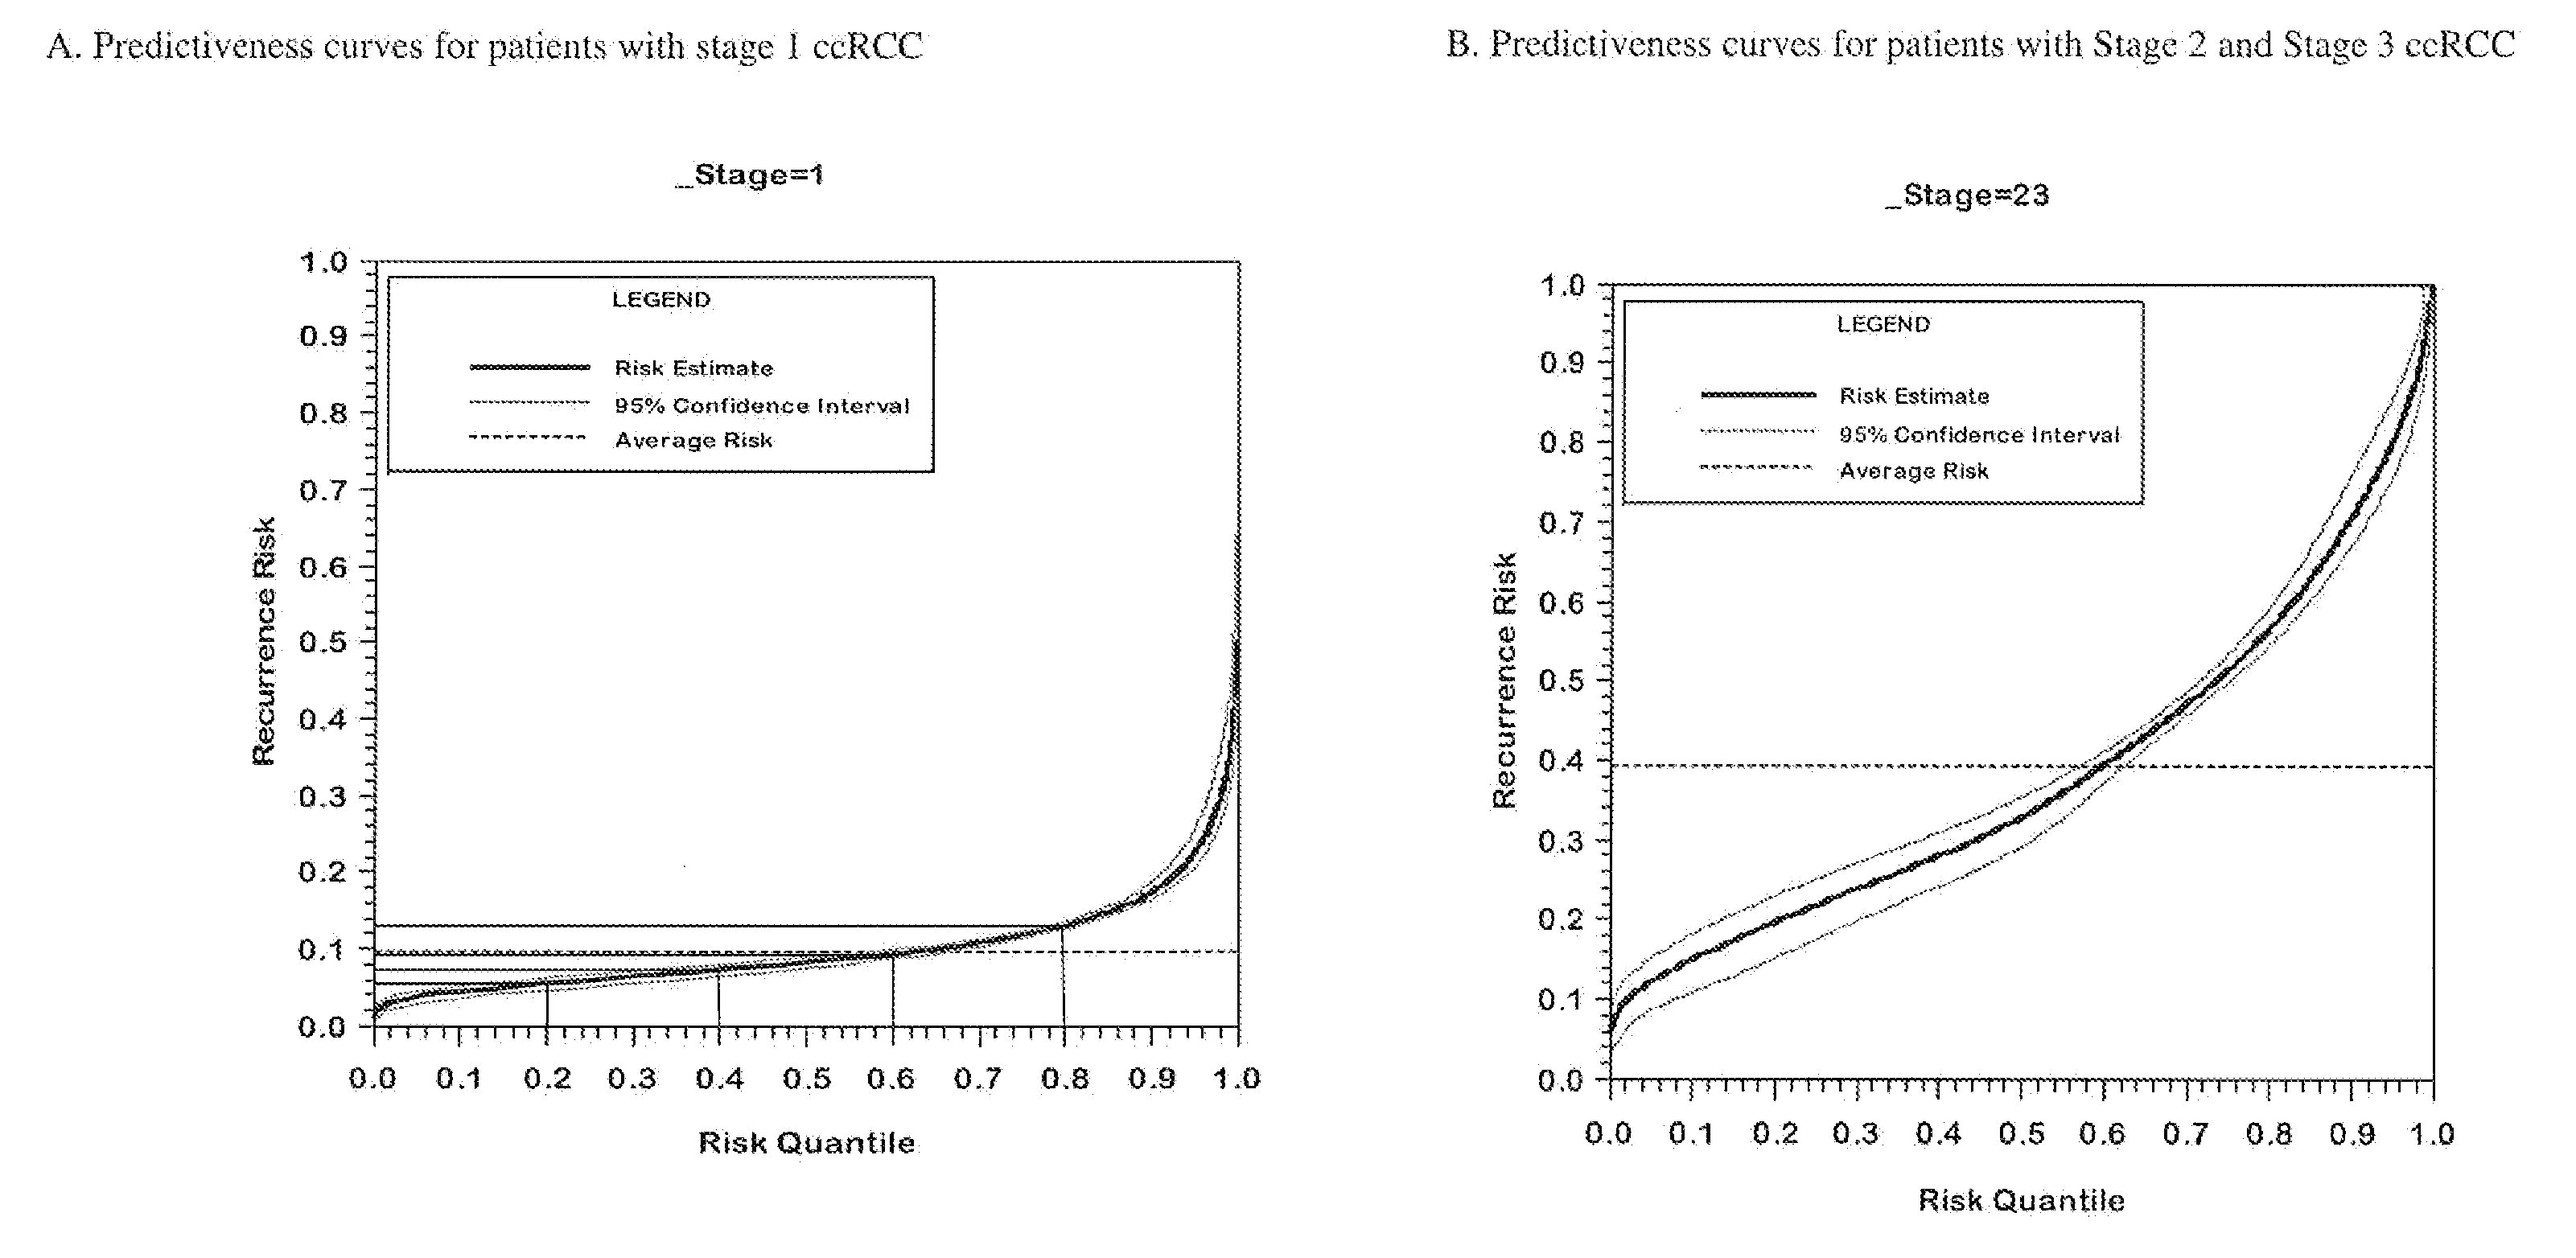
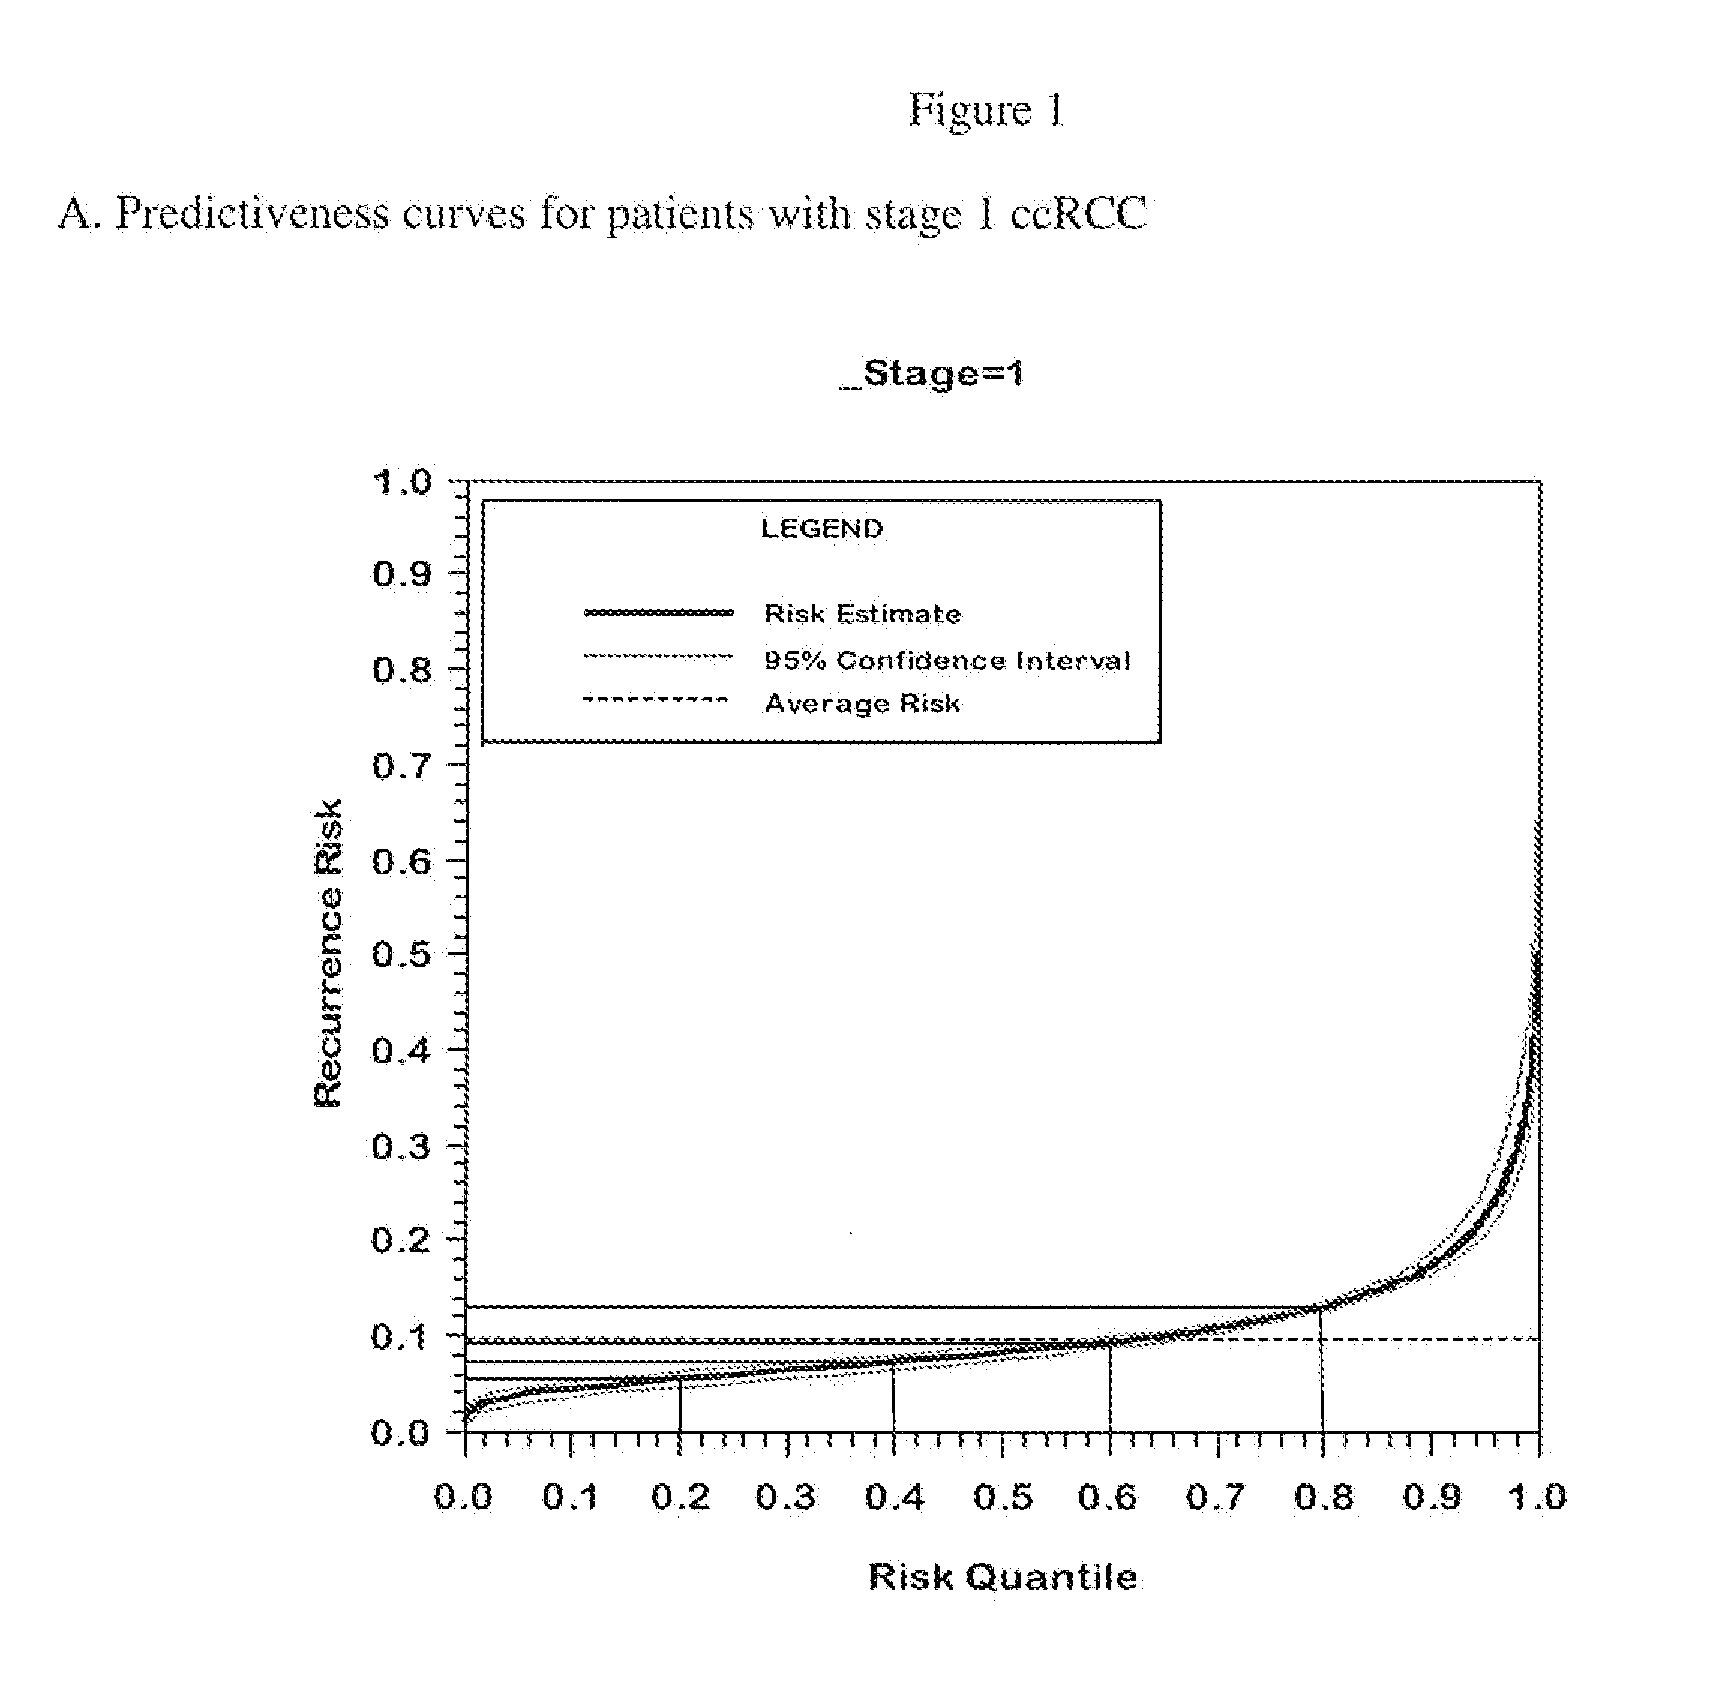
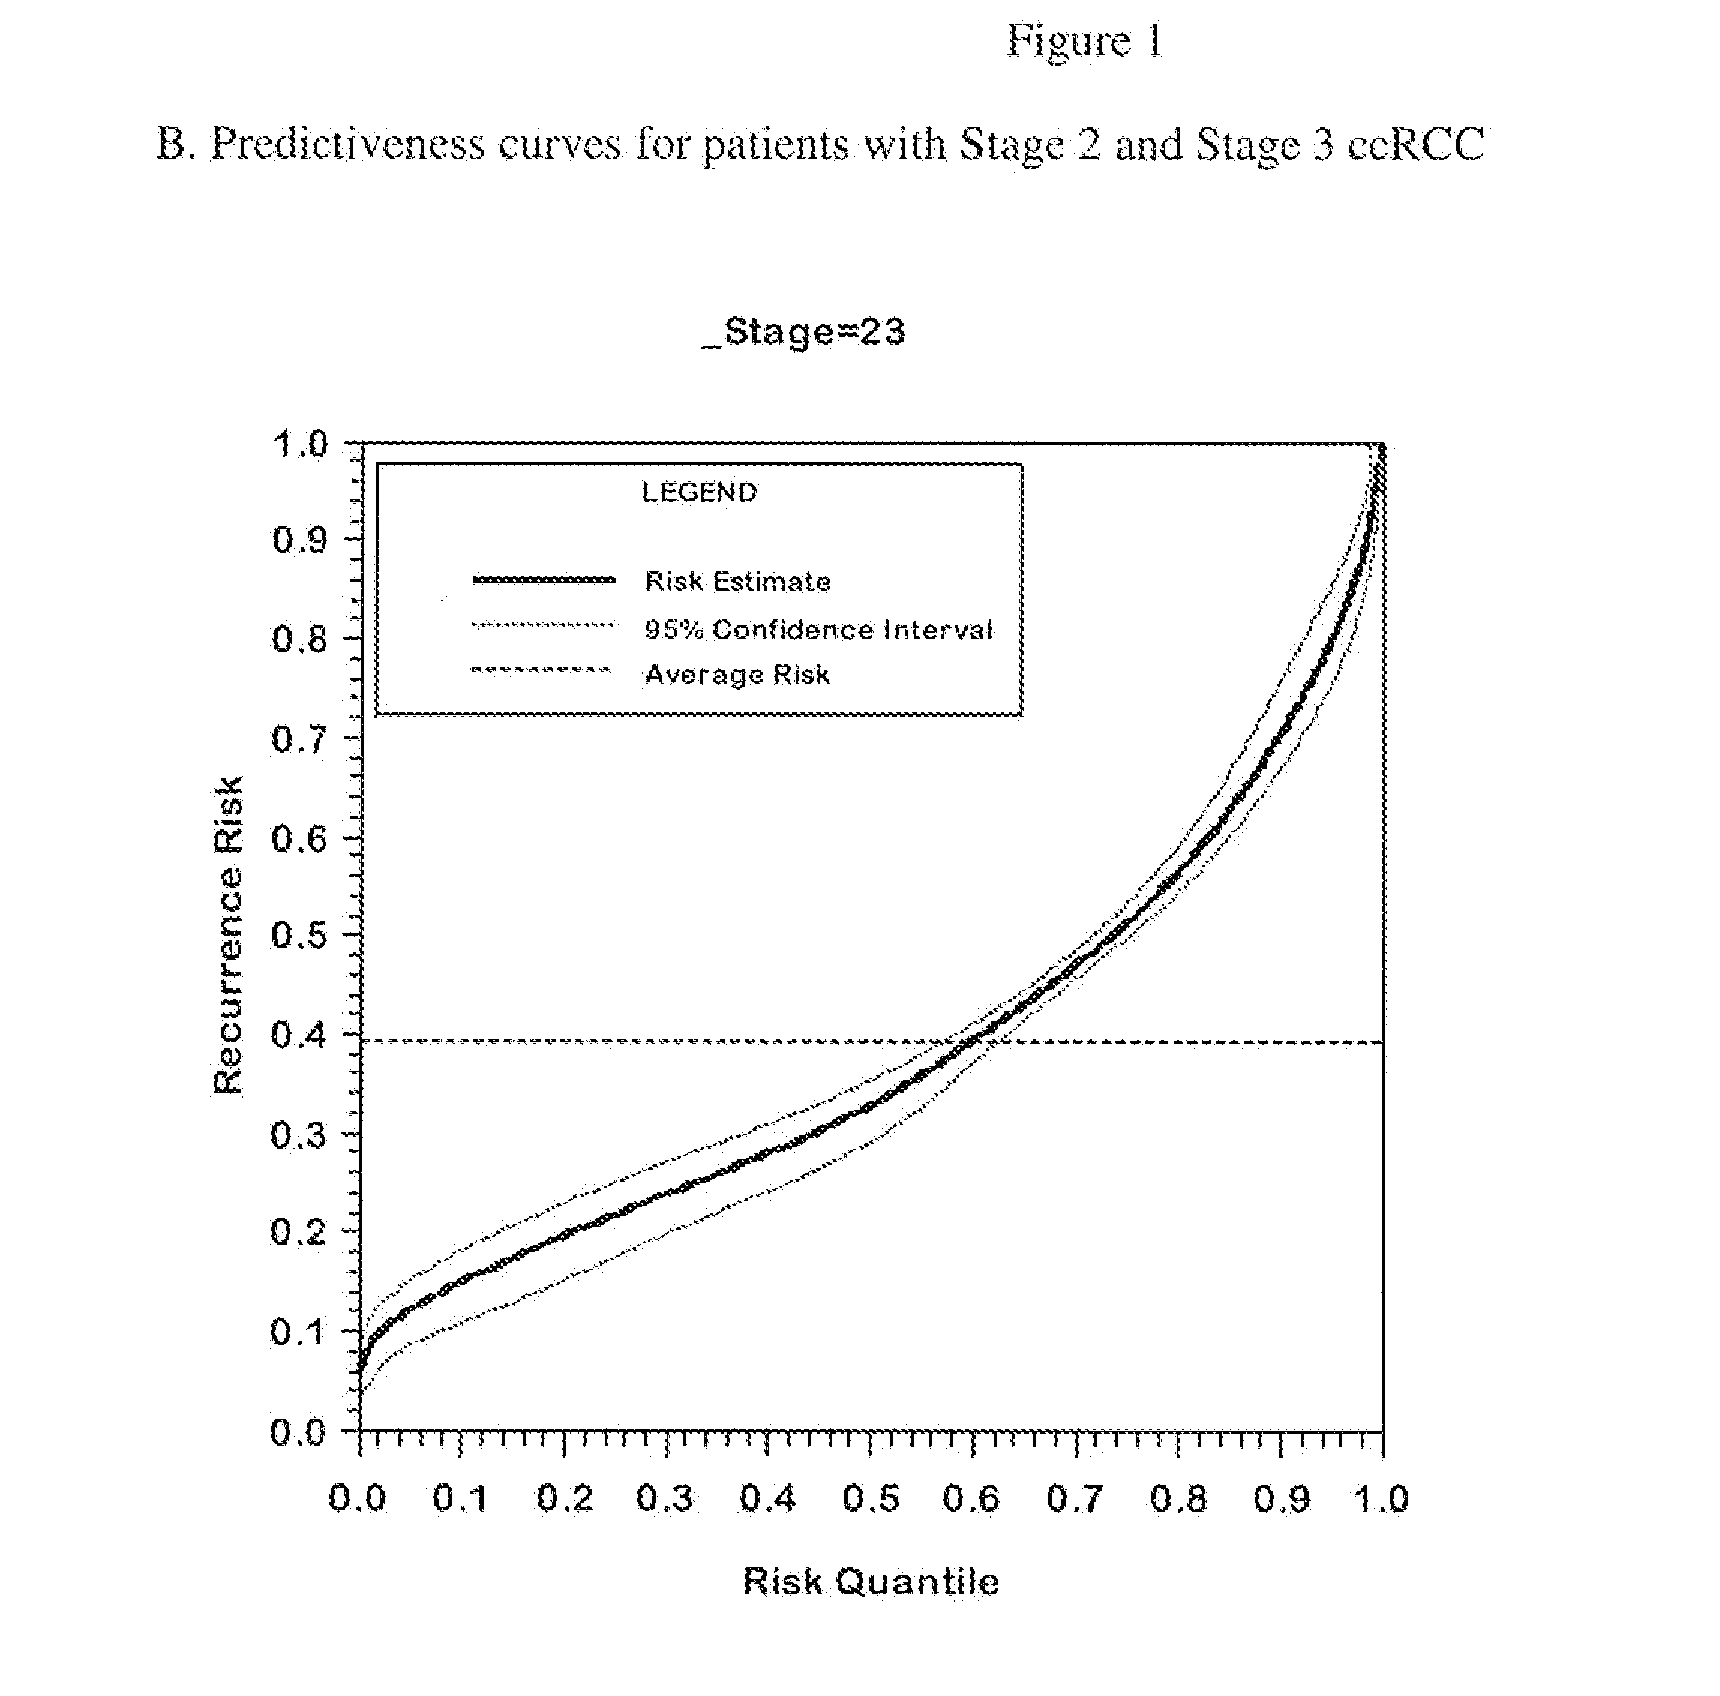
Performance of the Algorithm
[0164]The performance of the final genes included in the algorithm with and without adjustment for correction for regression to the mean with respect to the endpoint of recurrence is summarized in Table 3.
[0165]When using analyses that control the false discovery rate such as Storey's procedure, increasing the proportion of genes with little or no association decreases the identification power even for genes strongly associated with outcome. Therefore, analyzing all of the genes together as one very large set can be expected to produce an analysis with lower power to identify truly associated genes. To mitigate this issue, a “separate class” analysis (Efron B. Simultaneous inference: When should hypothesis testing problems be combined. Ann. Appl. Statist. 2008; 2:197-223.) was done. In the separate class analysis, false discovery rates are calculated within each gene class, using information from all the genes to improve the accuracy of the calculation. T...
PUM
| Property | Measurement | Unit |
|---|---|---|
| Level | aaaaa | aaaaa |
Abstract
Description
Claims
Application Information