Data visualization method for graphically representing data from four or more variables in a two-dimensional (2D) heatmap
- Summary
- Abstract
- Description
- Claims
- Application Information
AI Technical Summary
Benefits of technology
Problems solved by technology
Method used
Image

Examples
Embodiment Construction
[0037]The following description of the embodiments is merely exemplary in nature and is in no way intended to limit the invention. The description of illustrative embodiments is intended to be read in connection with the accompanying drawings, which are to be considered part of the entire written description. The discussion herein describes and illustrates some possible non-limiting combinations of features that may exist alone or in other combinations of features.
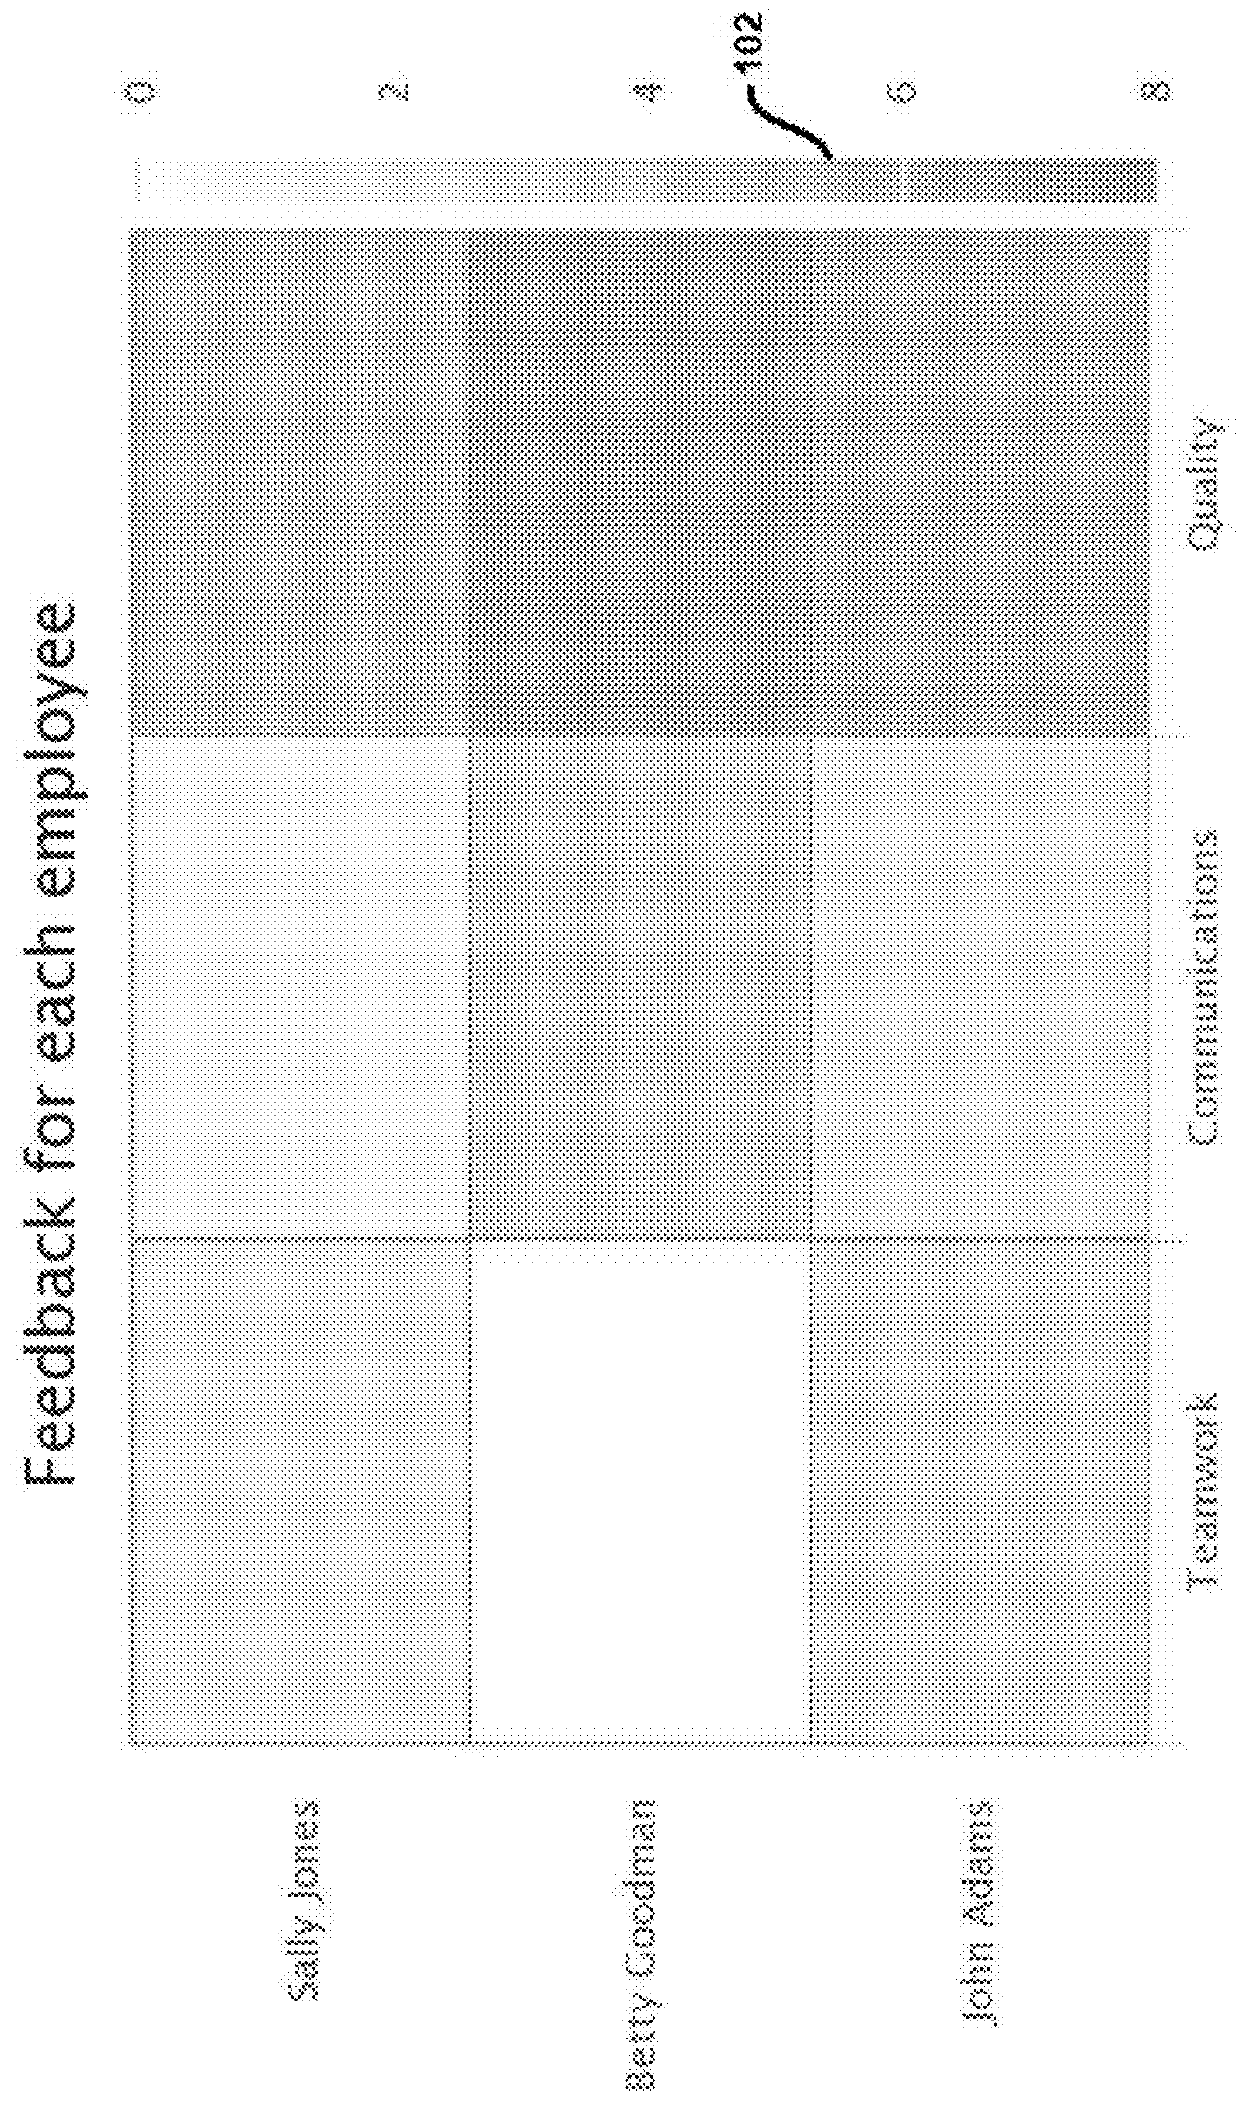
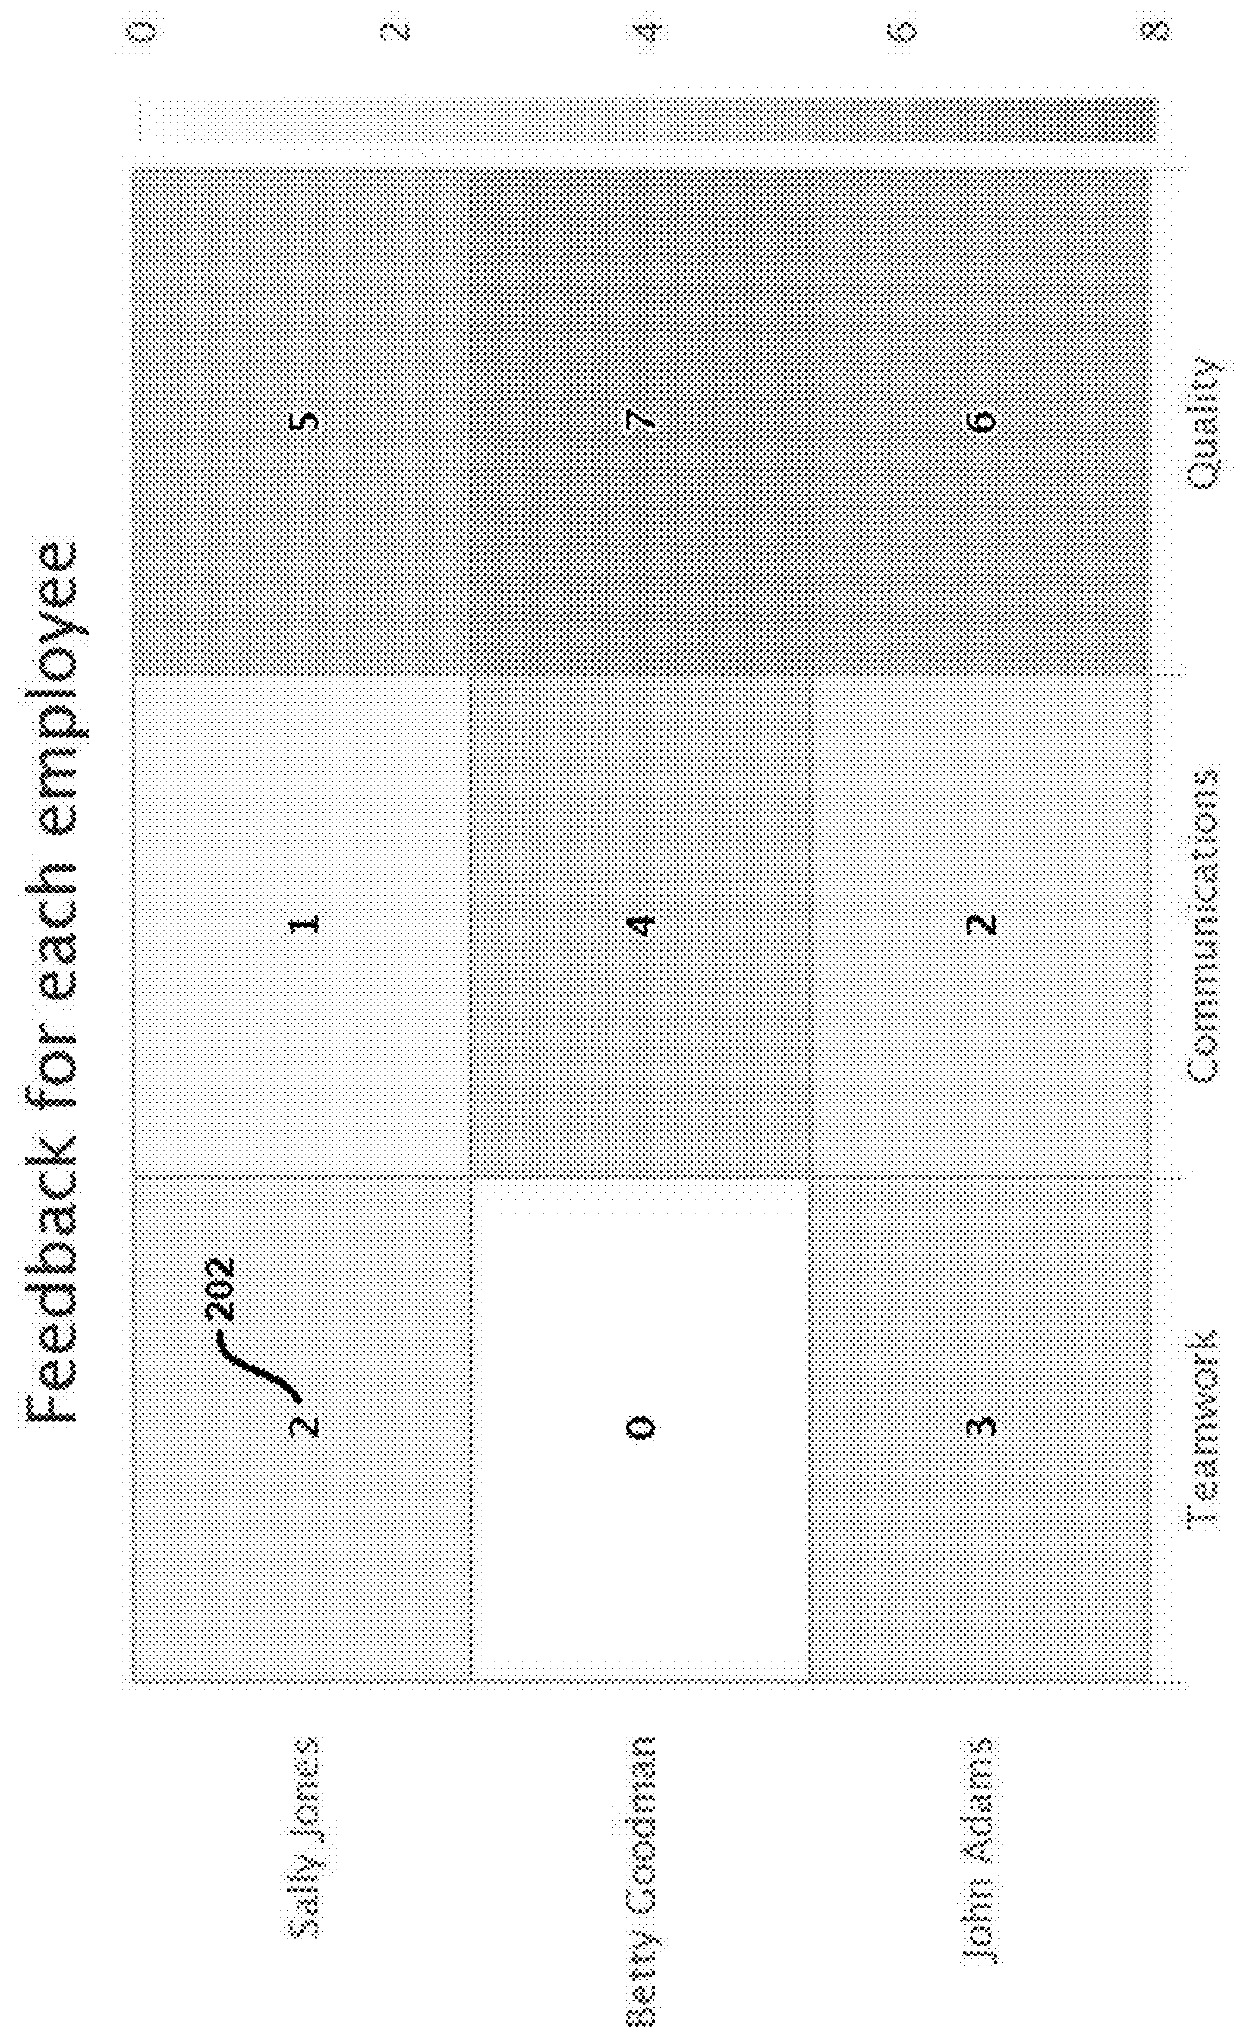
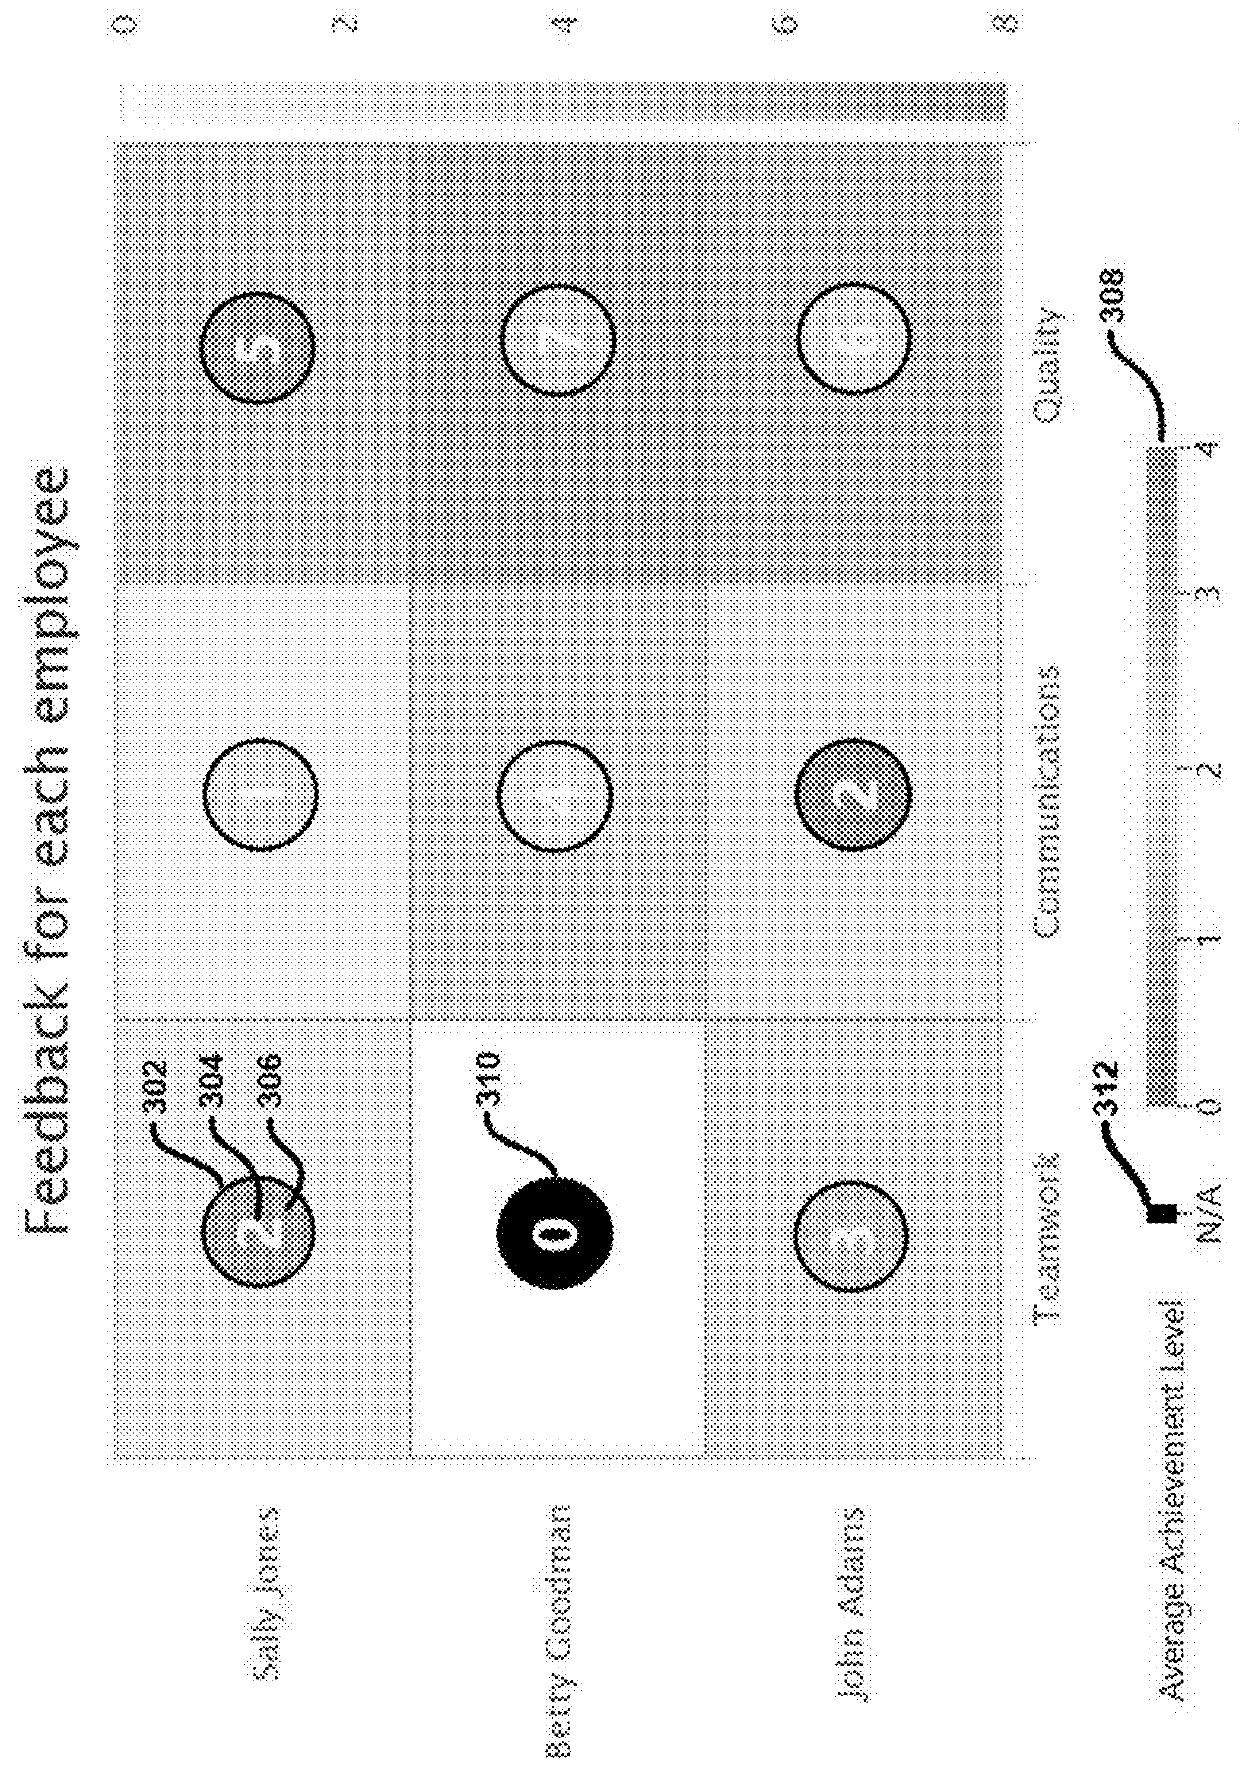
[0038]Two-dimensional (2D) heatmaps represent a matrix of three variables [X, Y, Z] as a spectrum of colored or shaded squares or rectangles (cells) displayed in a row and column format. Values X and Y determine the respective locations on the x-axis and y-axis where the value Z is represented by the shading or color of the cell at that location according to a scale. Optionally, the numerical value for value Z can also be displayed in each shaded or colored cell.
[0039]For illustration, the matrix of three variable data cou...
PUM
 Abstract
Description
Claims
Application Information
 - R&D Engineer
- R&D Manager
- IP Professional
- Industry Leading Data Capabilities
- Powerful AI technology
- Patent DNA Extraction
Browse by: Latest US Patents, China's latest patents, Technical Efficacy Thesaurus, Application Domain, Technology Topic.
© 2024 PatSnap. All rights reserved.Legal|Privacy policy|Modern Slavery Act Transparency Statement|Sitemap