System and method for data visualization using a synchronous display of sequential time data and on-map planning

a data visualization and synchronous display technology, applied in data processing applications, 2d-image generation, instruments, etc., can solve the problem that the computer screen is too small for an overview of large projects

Inactive Publication Date: 2006-10-26
UNCHARTED SOFTWARE INC
View PDF13 Cites 99 Cited by
  • Summary
  • Abstract
  • Description
  • Claims
  • Application Information

AI Technical Summary

Benefits of technology

[0011] One aspect is a system for coordinating display of synchronized spatial information and time-variant information on a visual interface as a visual representation of a multi-dimensional planned process, the system comprising: a data store configured for storing the time-variant information, the data store further configured for storing the spatial information as a plurality of data elements for representing visual elements for display in the visual representation with respect to a reference surface, each of the visual elements operatively coupled to at least one sequenced element of a plurality of sequenced elements; and a synchronization module coupled to the data store and configured for synchronizing a displayed state on the visual interface of the spatial information with a displayed state on the visual interface of the time-variant information, the time-variant information including timeline data including at least two of the plurality of sequenced elements having overlapping time spans with respect to a common temporal reference frame and including a marker for facilitating navigation of the plurality of sequenced elements with respect to the common temporal reference frame; wherein changes in the displayed state of the time-variant information are reflected in changes to the displa

Problems solved by technology

One disadvantage with the use of time sequential charts, such as the Gantt chart, is that the charts can become visually cumbersome when number of tasks becomes large and therefore the charts are best suited for planning basic tasks in a schedule in the early stages of a proje

Method used


Image

  • System and method for data visualization using a synchronous display of sequential time data and on-map planning
  • System and method for data visualization using a synchronous display of sequential time data and on-map planning
  • System and method for data visualization using a synchronous display of sequential time data and on-map planning

Examples


example sequenced

Elements 17

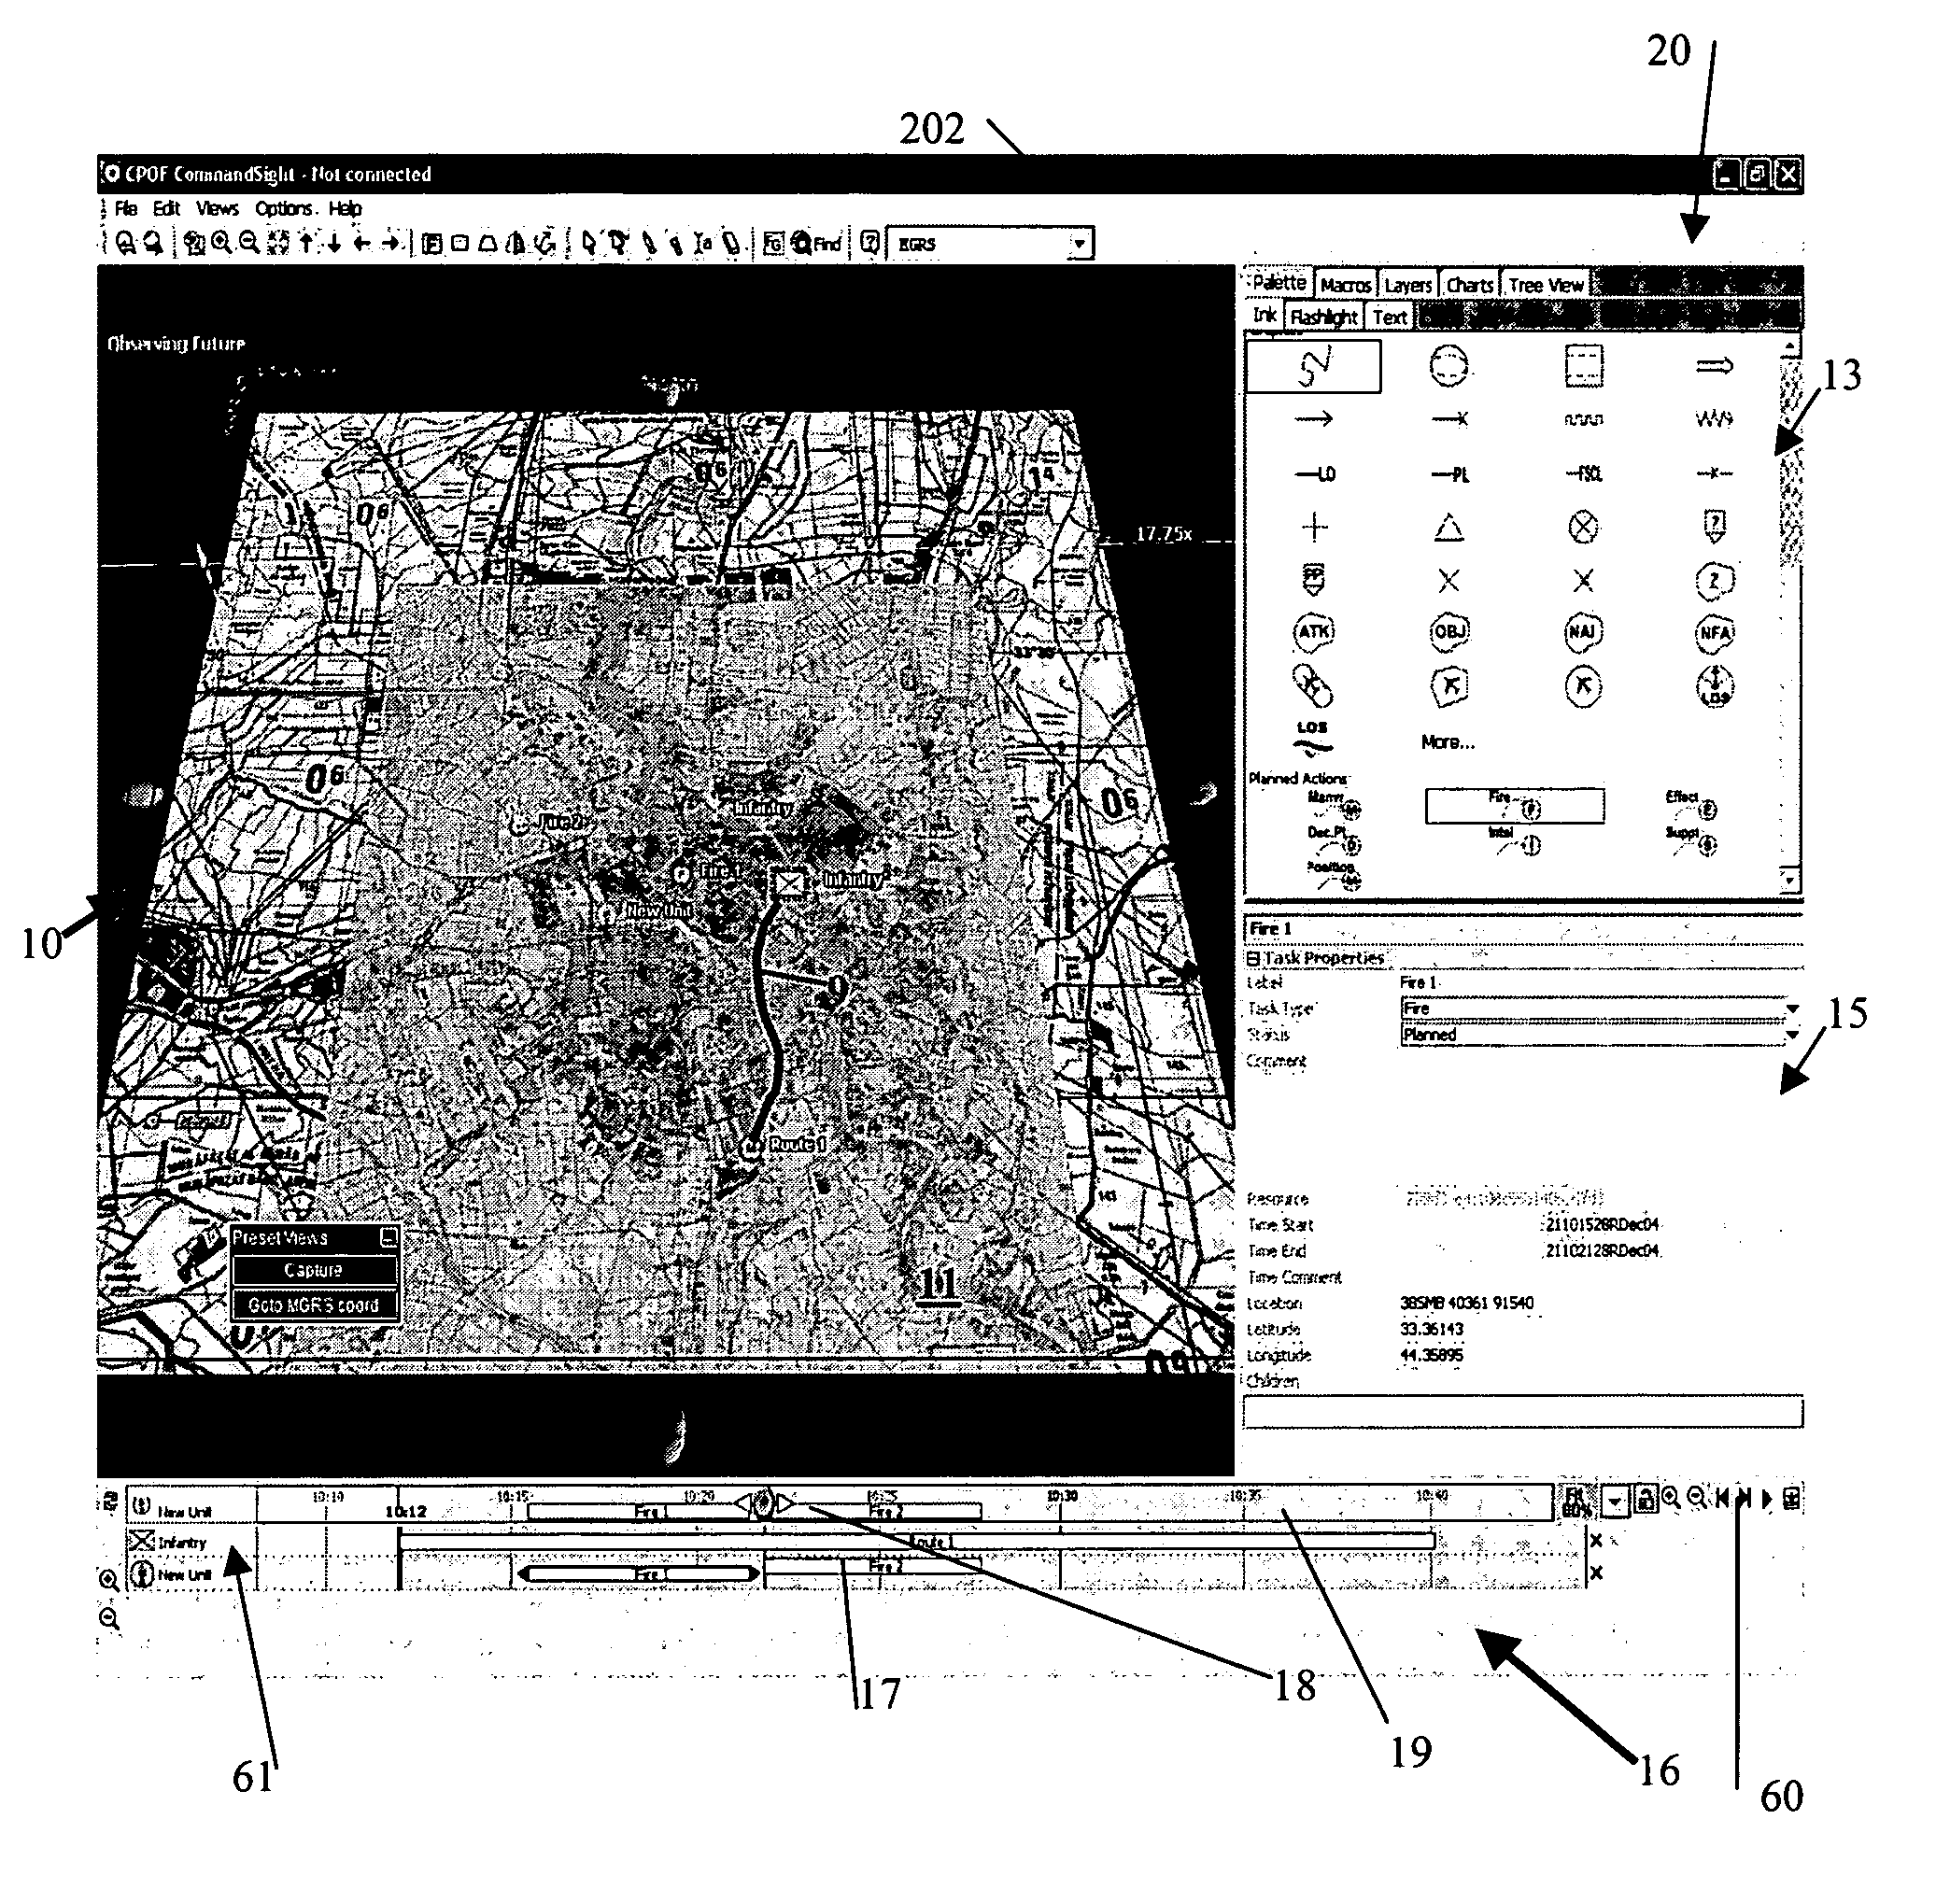
[0063] Each type of sequenced element 17 (e.g. task) can represent a different action that occurs on the battlefield terrain 11, and as such, each is visualized in the visualization representation 10 in a different manner. Referring to FIGS. 3 and 9, for example, maneuver tasks can cause the battlefield unit icon 61 to travel along a path 62, whereas fire tasks display an artillery arc 64 from the battlefield unit icon 61 to a target 66 on the terrain 11. Further, a battlefield unit may have multiple tasks associated with it. The battlefield unit can be associated with both a maneuver and fire action, resulting in the battlefield unit icon 61 moving along the path 62 while firing at the target 66. The artillery arc 64 would continually update throughout the animation to show the correct ballistics 68 information on the visualization representation 10, as well as in the data 16, 20 as desired. It is recognized that the maneuver and fire action could be represented as separ...

example operation

of the Tool 12

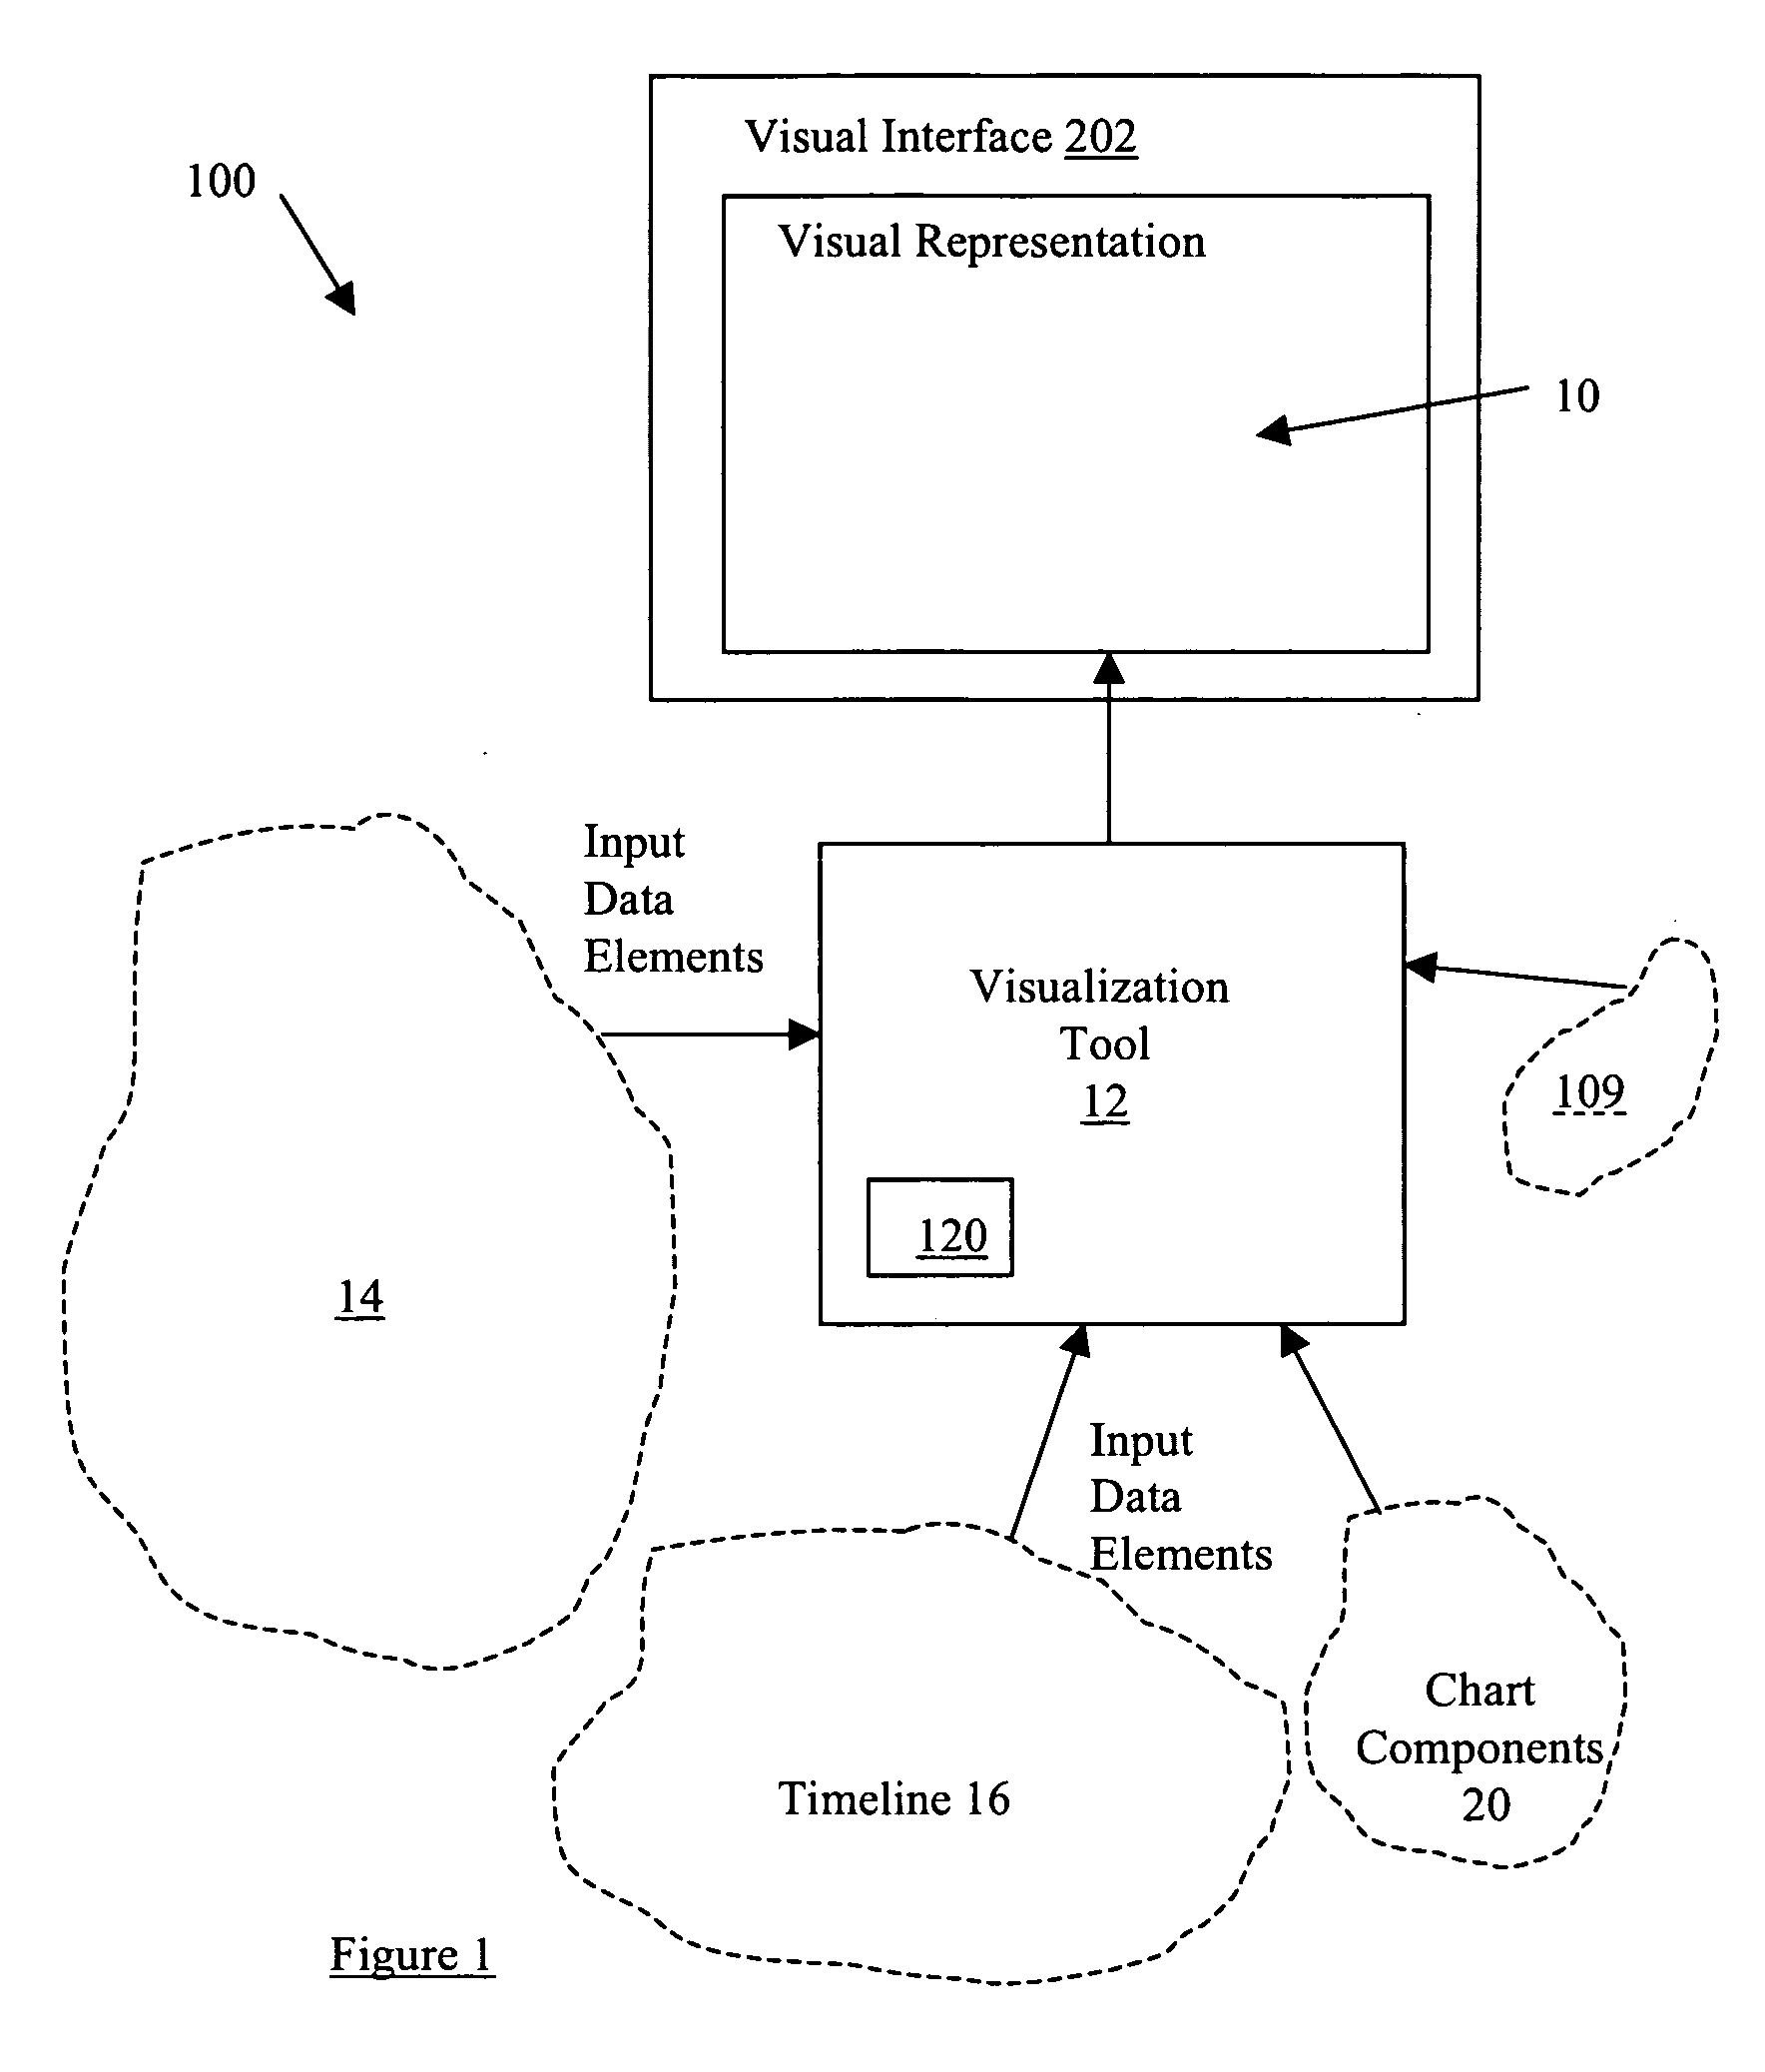
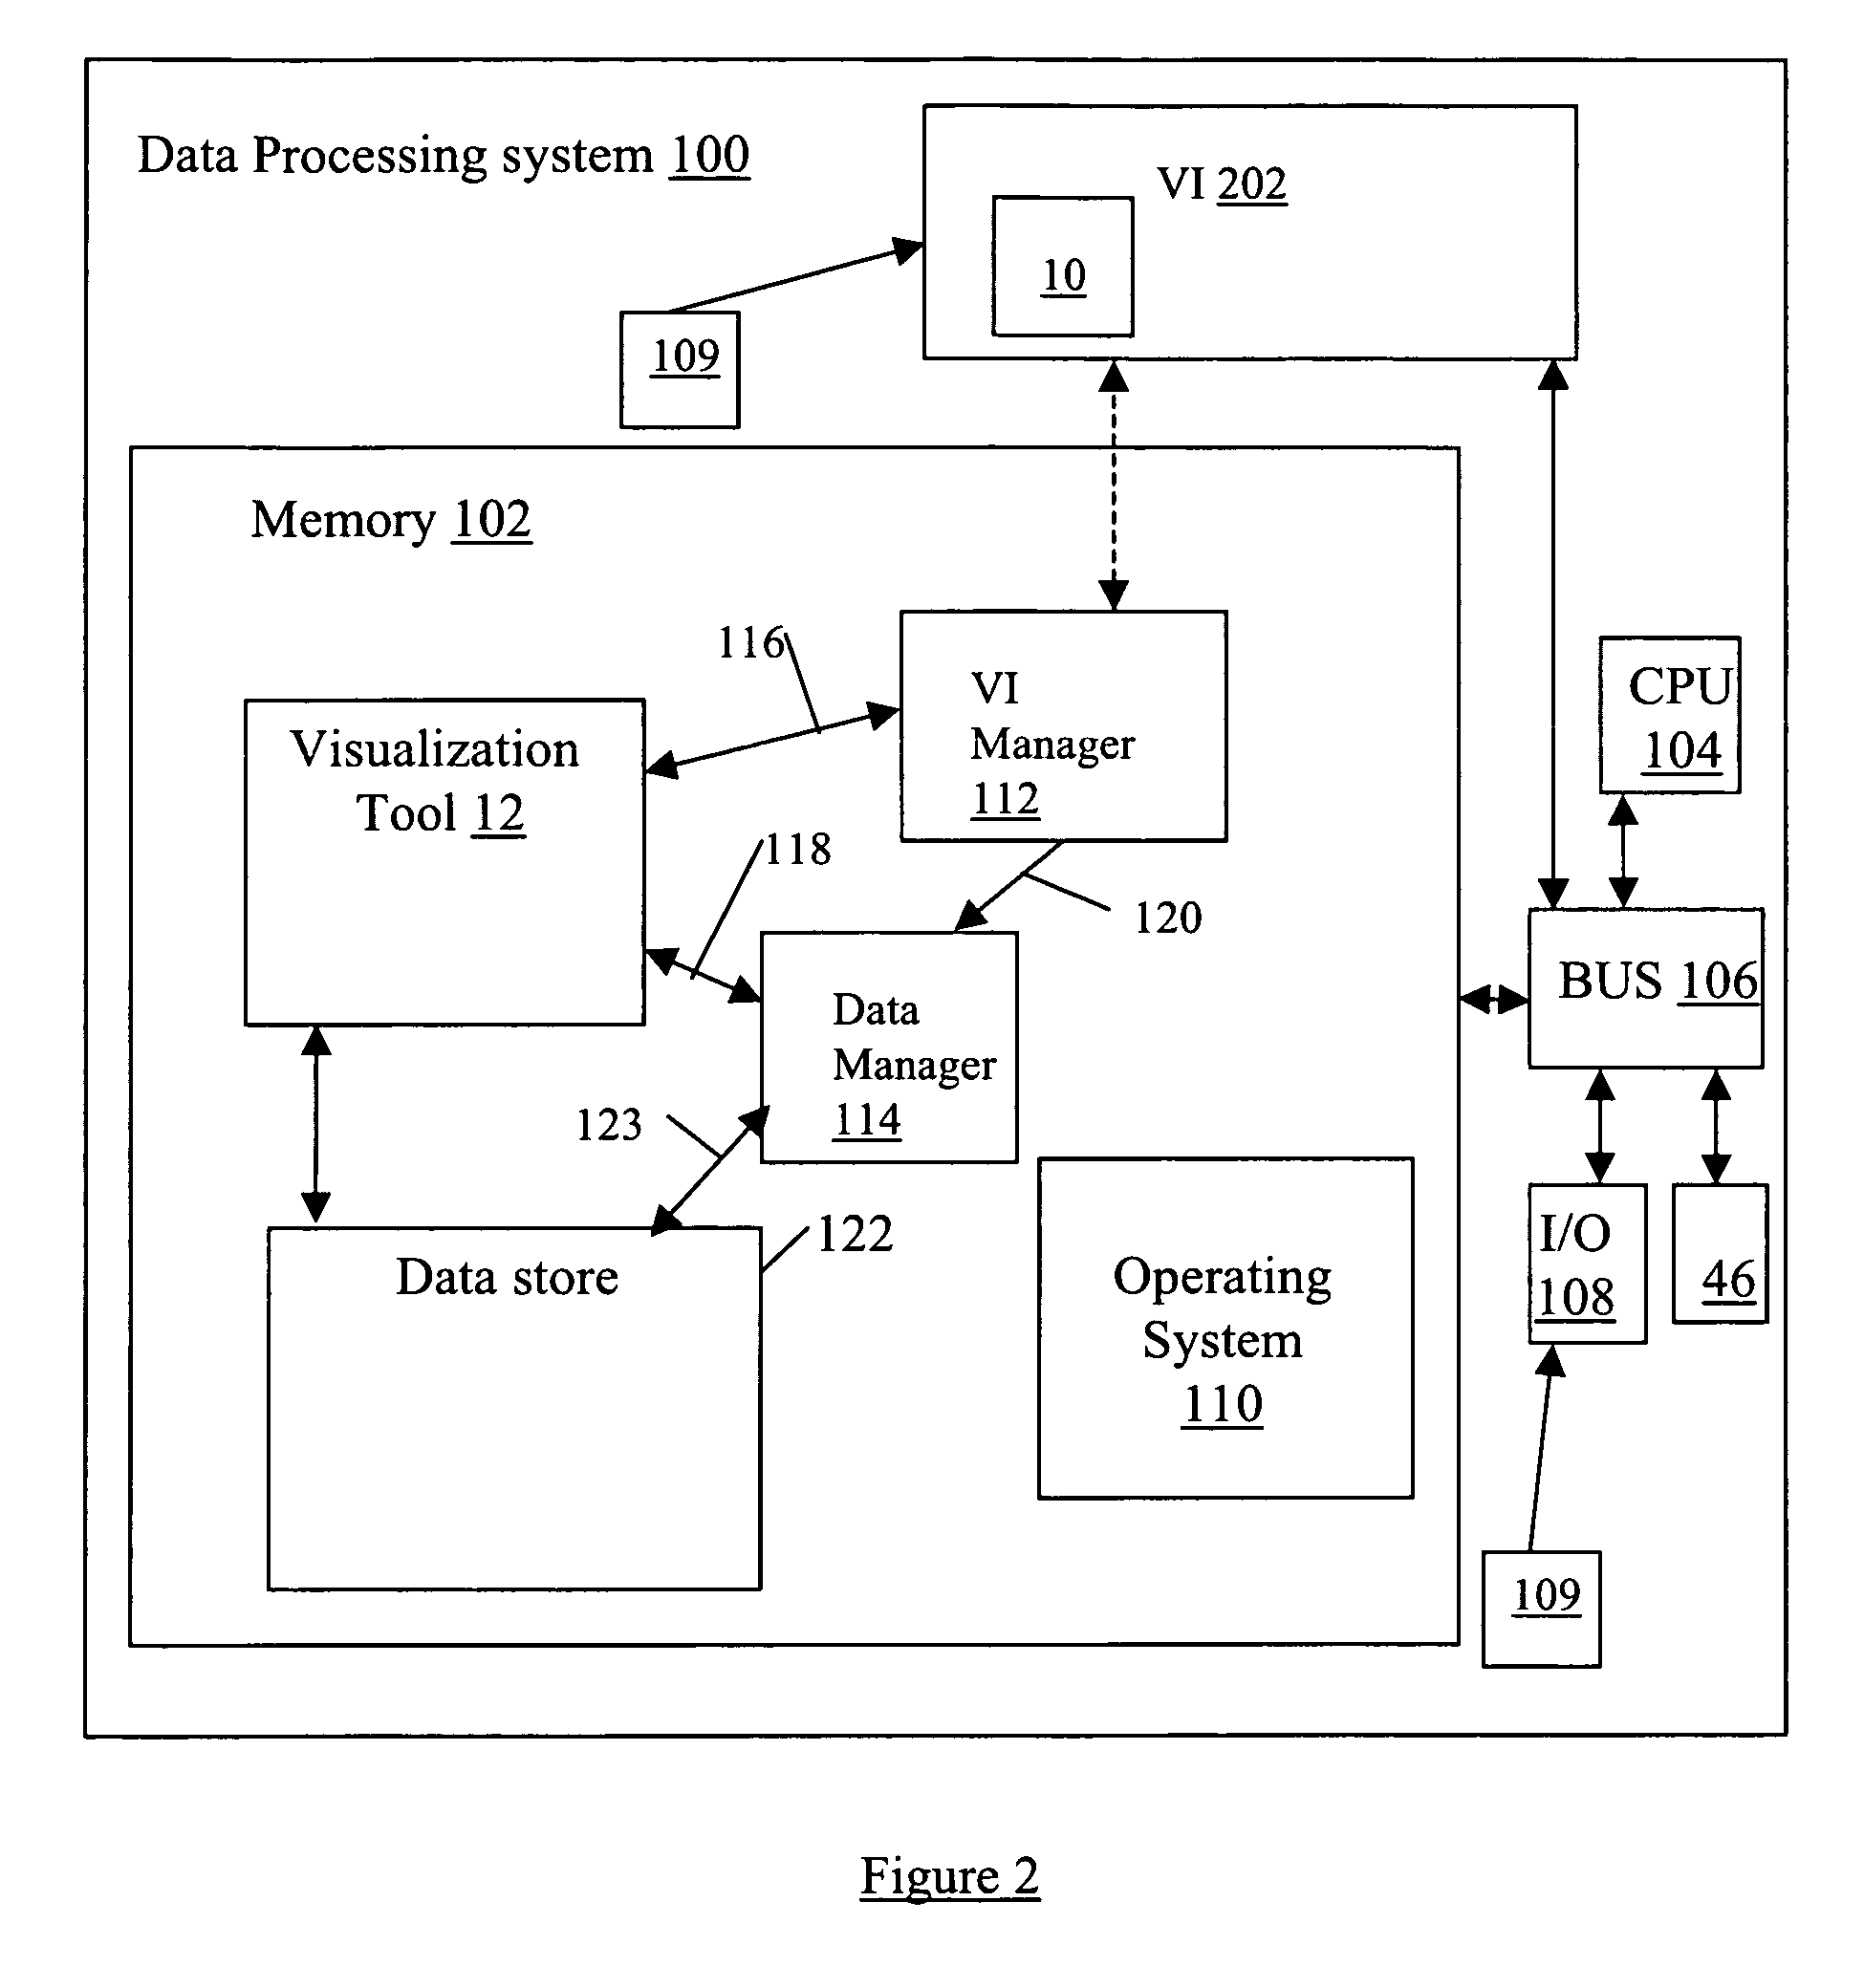
[0064] Referring to FIGS. 1, 2, and 10, an example operation 700 of the tool 12 is shown for coordinating display of synchronized spatial information and time-variant information on the visual interface 202 as the visual representation 10 of a multi-dimensional planned process. The method has the example steps of: step 702—access the time-variant information from the data store 122 including timeline data 16 including at least two sequenced elements 17 having overlapping time spans with respect to the common temporal reference frame 19; step 704—access the spatial information from the data store 122 including a plurality of data elements 14 for representing visual elements for display in the visual representation 10 with respect to a reference surface 11, such that each of the visual elements are operatively coupled to at least one sequenced element 17 of the sequenced elements; step 706—synchronize through navigation of the marker 18 the display parameters for a displ...


PUM


Abstract

A system and method is provided for coordinating display of synchronized spatial information and time-variant information on a visual interface as a visual representation of a multi-dimensional planned process. The system and method comprise a data store configured for storing the time-variant information, such that the data store is further configured for storing the spatial information as a plurality of data elements for representing visual elements for display in the visual representation with respect to a reference surface. Each of the visual elements is operatively coupled to at least one sequenced element of a plurality of sequenced elements. The system and method also include a synchronization module coupled to the data store and is configured for synchronizing a displayed state on the visual interface of the spatial information with a displayed state on the visual interface of the time-variant information. The time-variant information includes timeline data including at least two of the plurality of sequenced elements having overlapping time spans with respect to a common temporal reference frame, and includes a marker for facilitating navigation of the plurality of sequenced elements with respect to the common temporal reference frame. Changes in the displayed state of the time-variant information are reflected in changes to the displayed state of the spatial information.

Description

[0001] (The present application claims the benefit of U.S. Provisional Application No. 60 / 644,032 filed Jan. 18, 2005, herein incorporated by reference.)[0002] The present invention relates to the synchronized visualization of temporal and spatial data in the context of a managed process. BACKGROUND OF THE INVENTION [0003] Planning military maneuvers is a highly complex task, involving many variables across time, geography, personnel and equipment. These maneuvers are highly dependant on situational outcomes, and must be adaptable to account for unforeseen circumstances. Simply showing time sequences of events using existing charting techniques may not be appropriate for such a multi-dimensional planned process. It can be difficult for users of the chart to understand the context in which events occur, and base future actions upon these events. [0004] One existing technique is the use of a Gantt chart. A Gantt chart is a linear time series chart that aims to show the timing of tasks...

Claims


Application Information

Patent Timeline
IPC IPC(8): G06T11/20G06Q10/00
CPCG06Q10/06G06T11/206G06Q10/10
Inventor KAPLER, THOMASHALL, ERIC
Owner UNCHARTED SOFTWARE INC
Why Eureka
Try Eureka