Visualization method for the analysis of prestack and poststack seismic data

a visualization method and seismic data technology, applied in the field of seismic exploration, can solve problems such as inaccurate velocity models for that portion of data

Inactive Publication Date: 2006-01-24
FAIRFIELD INDUSTRIES INC
View PDF12 Cites 44 Cited by
  • Summary
  • Abstract
  • Description
  • Claims
  • Application Information

AI Technical Summary

Problems solved by technology

However, if the reflector portion within a data window curves up or down, this is an indication that the velocity model for that portion of the data is not accurate and that a new velocity model should be utilized for either the NMO connection or the migration velocity field.

Method used


Image

  • Visualization method for the analysis of prestack and poststack seismic data
  • Visualization method for the analysis of prestack and poststack seismic data
  • Visualization method for the analysis of prestack and poststack seismic data

Examples


Embodiment Construction

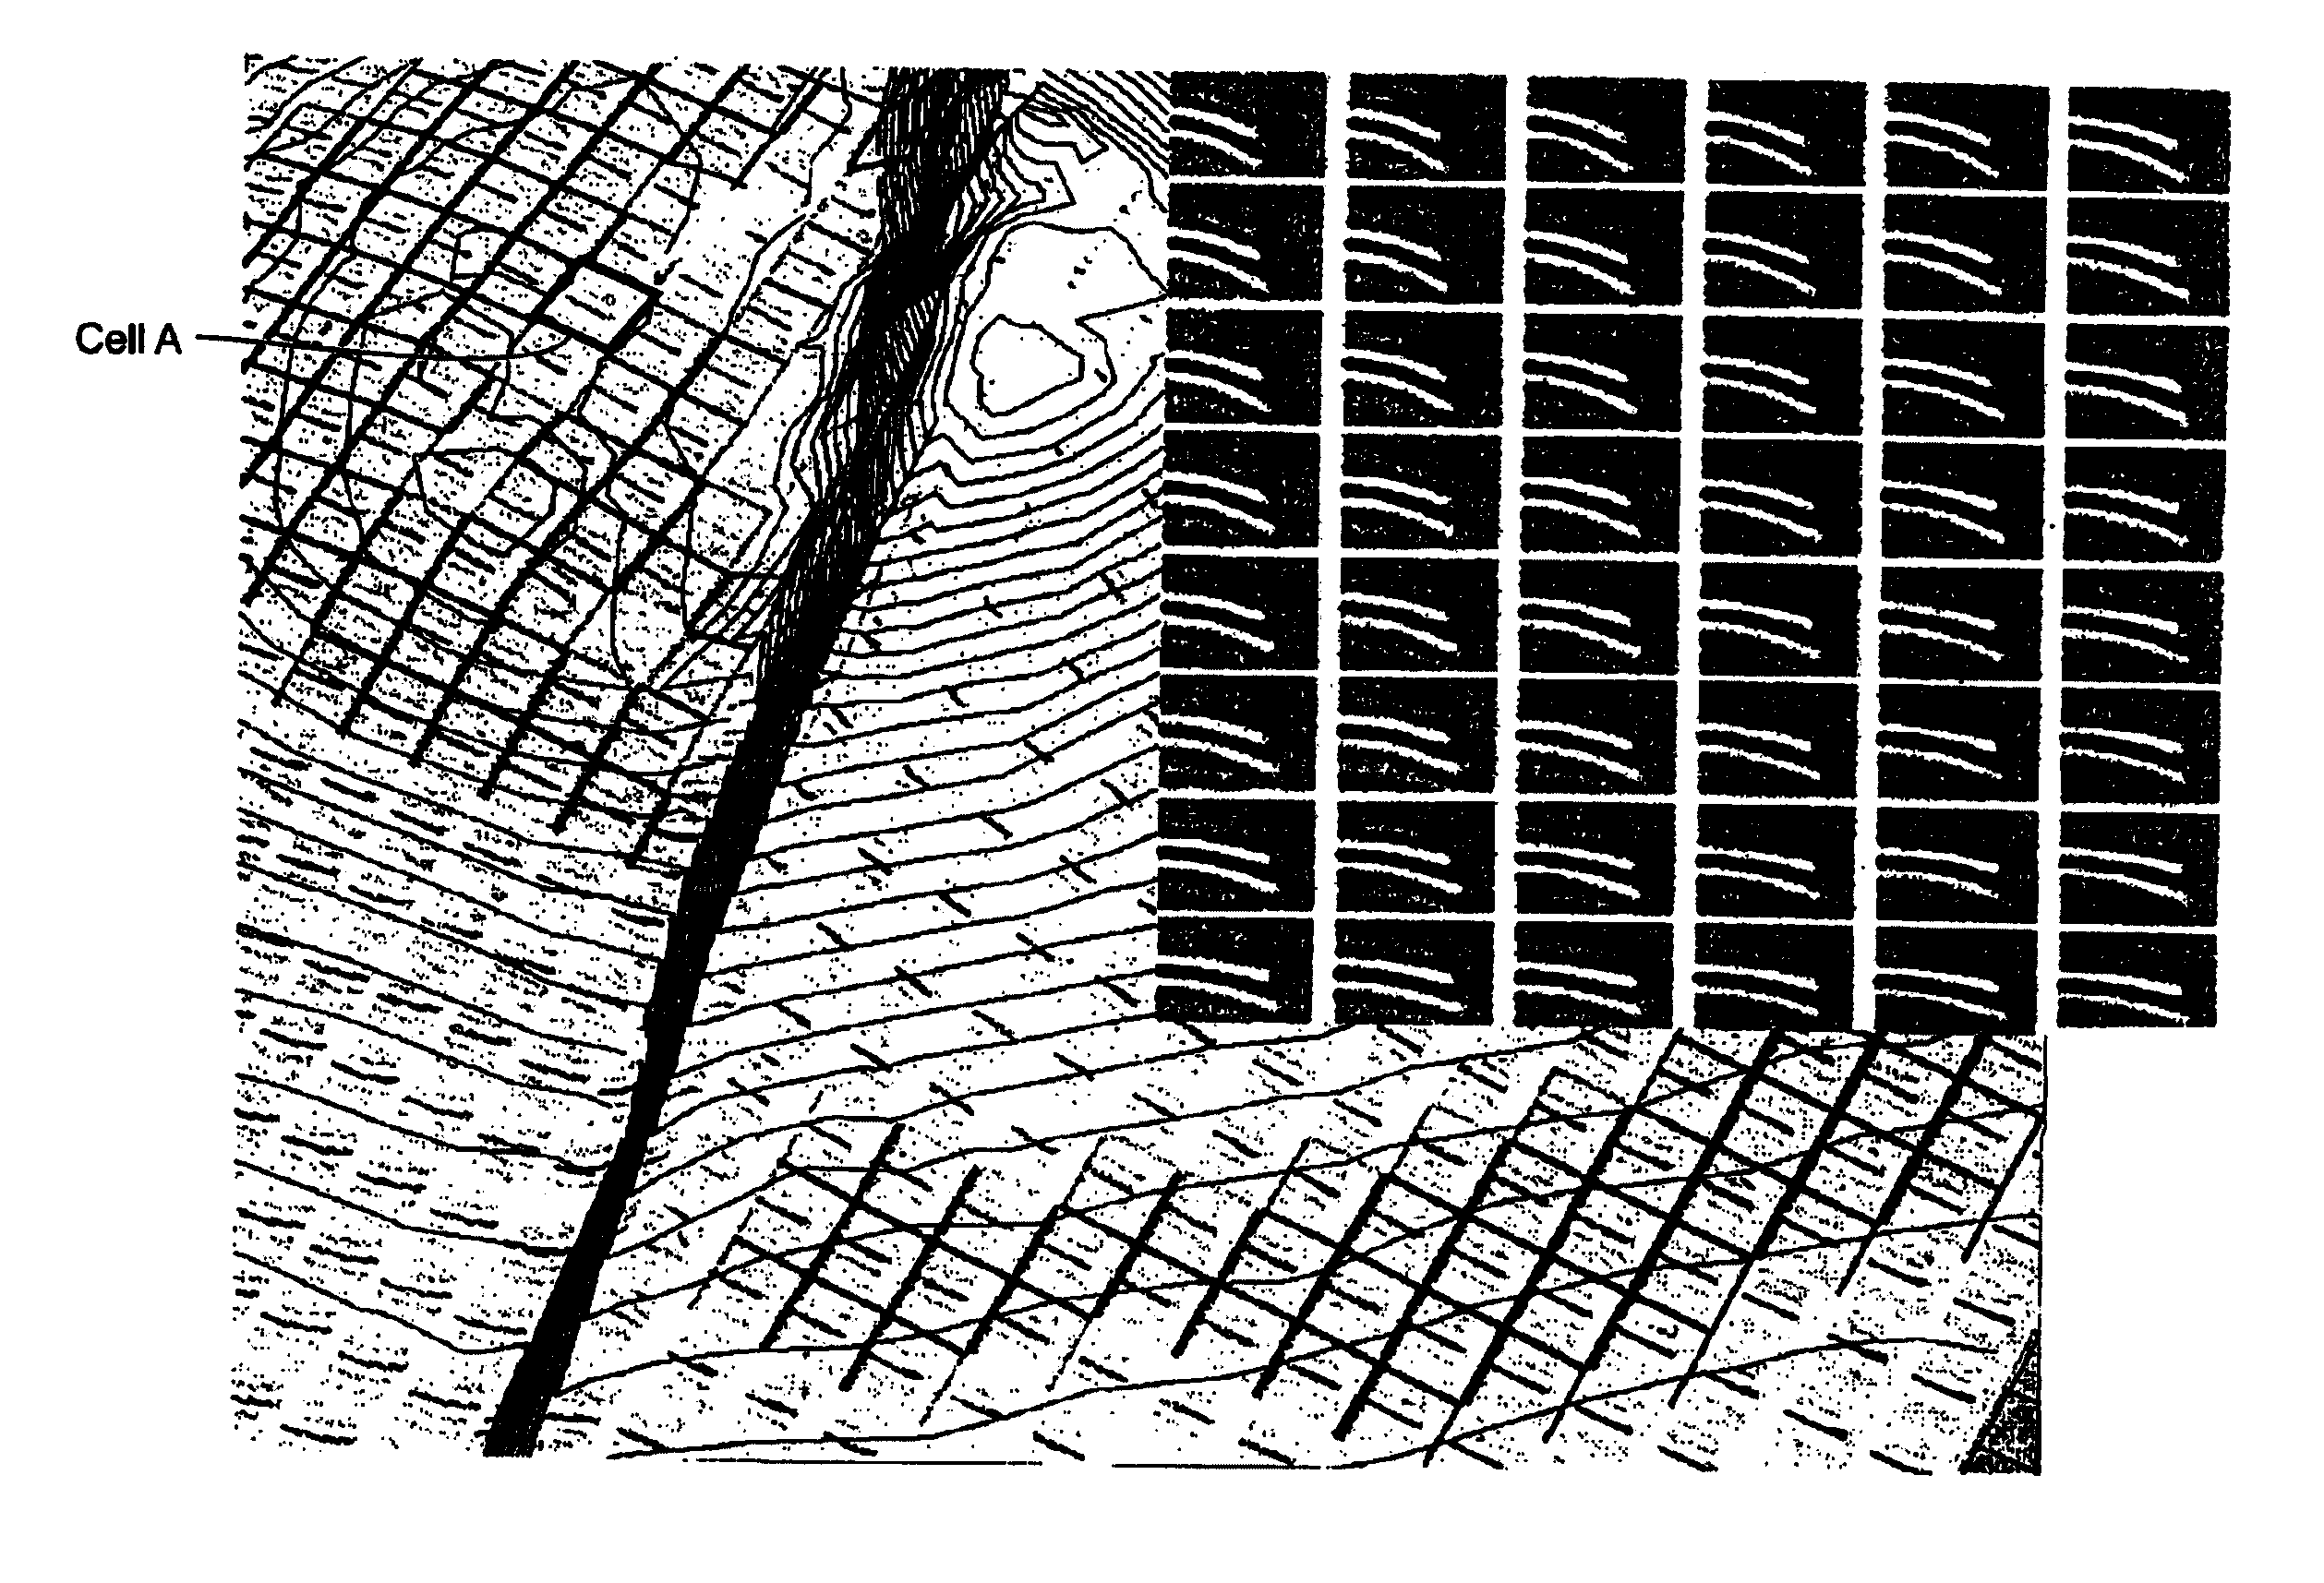
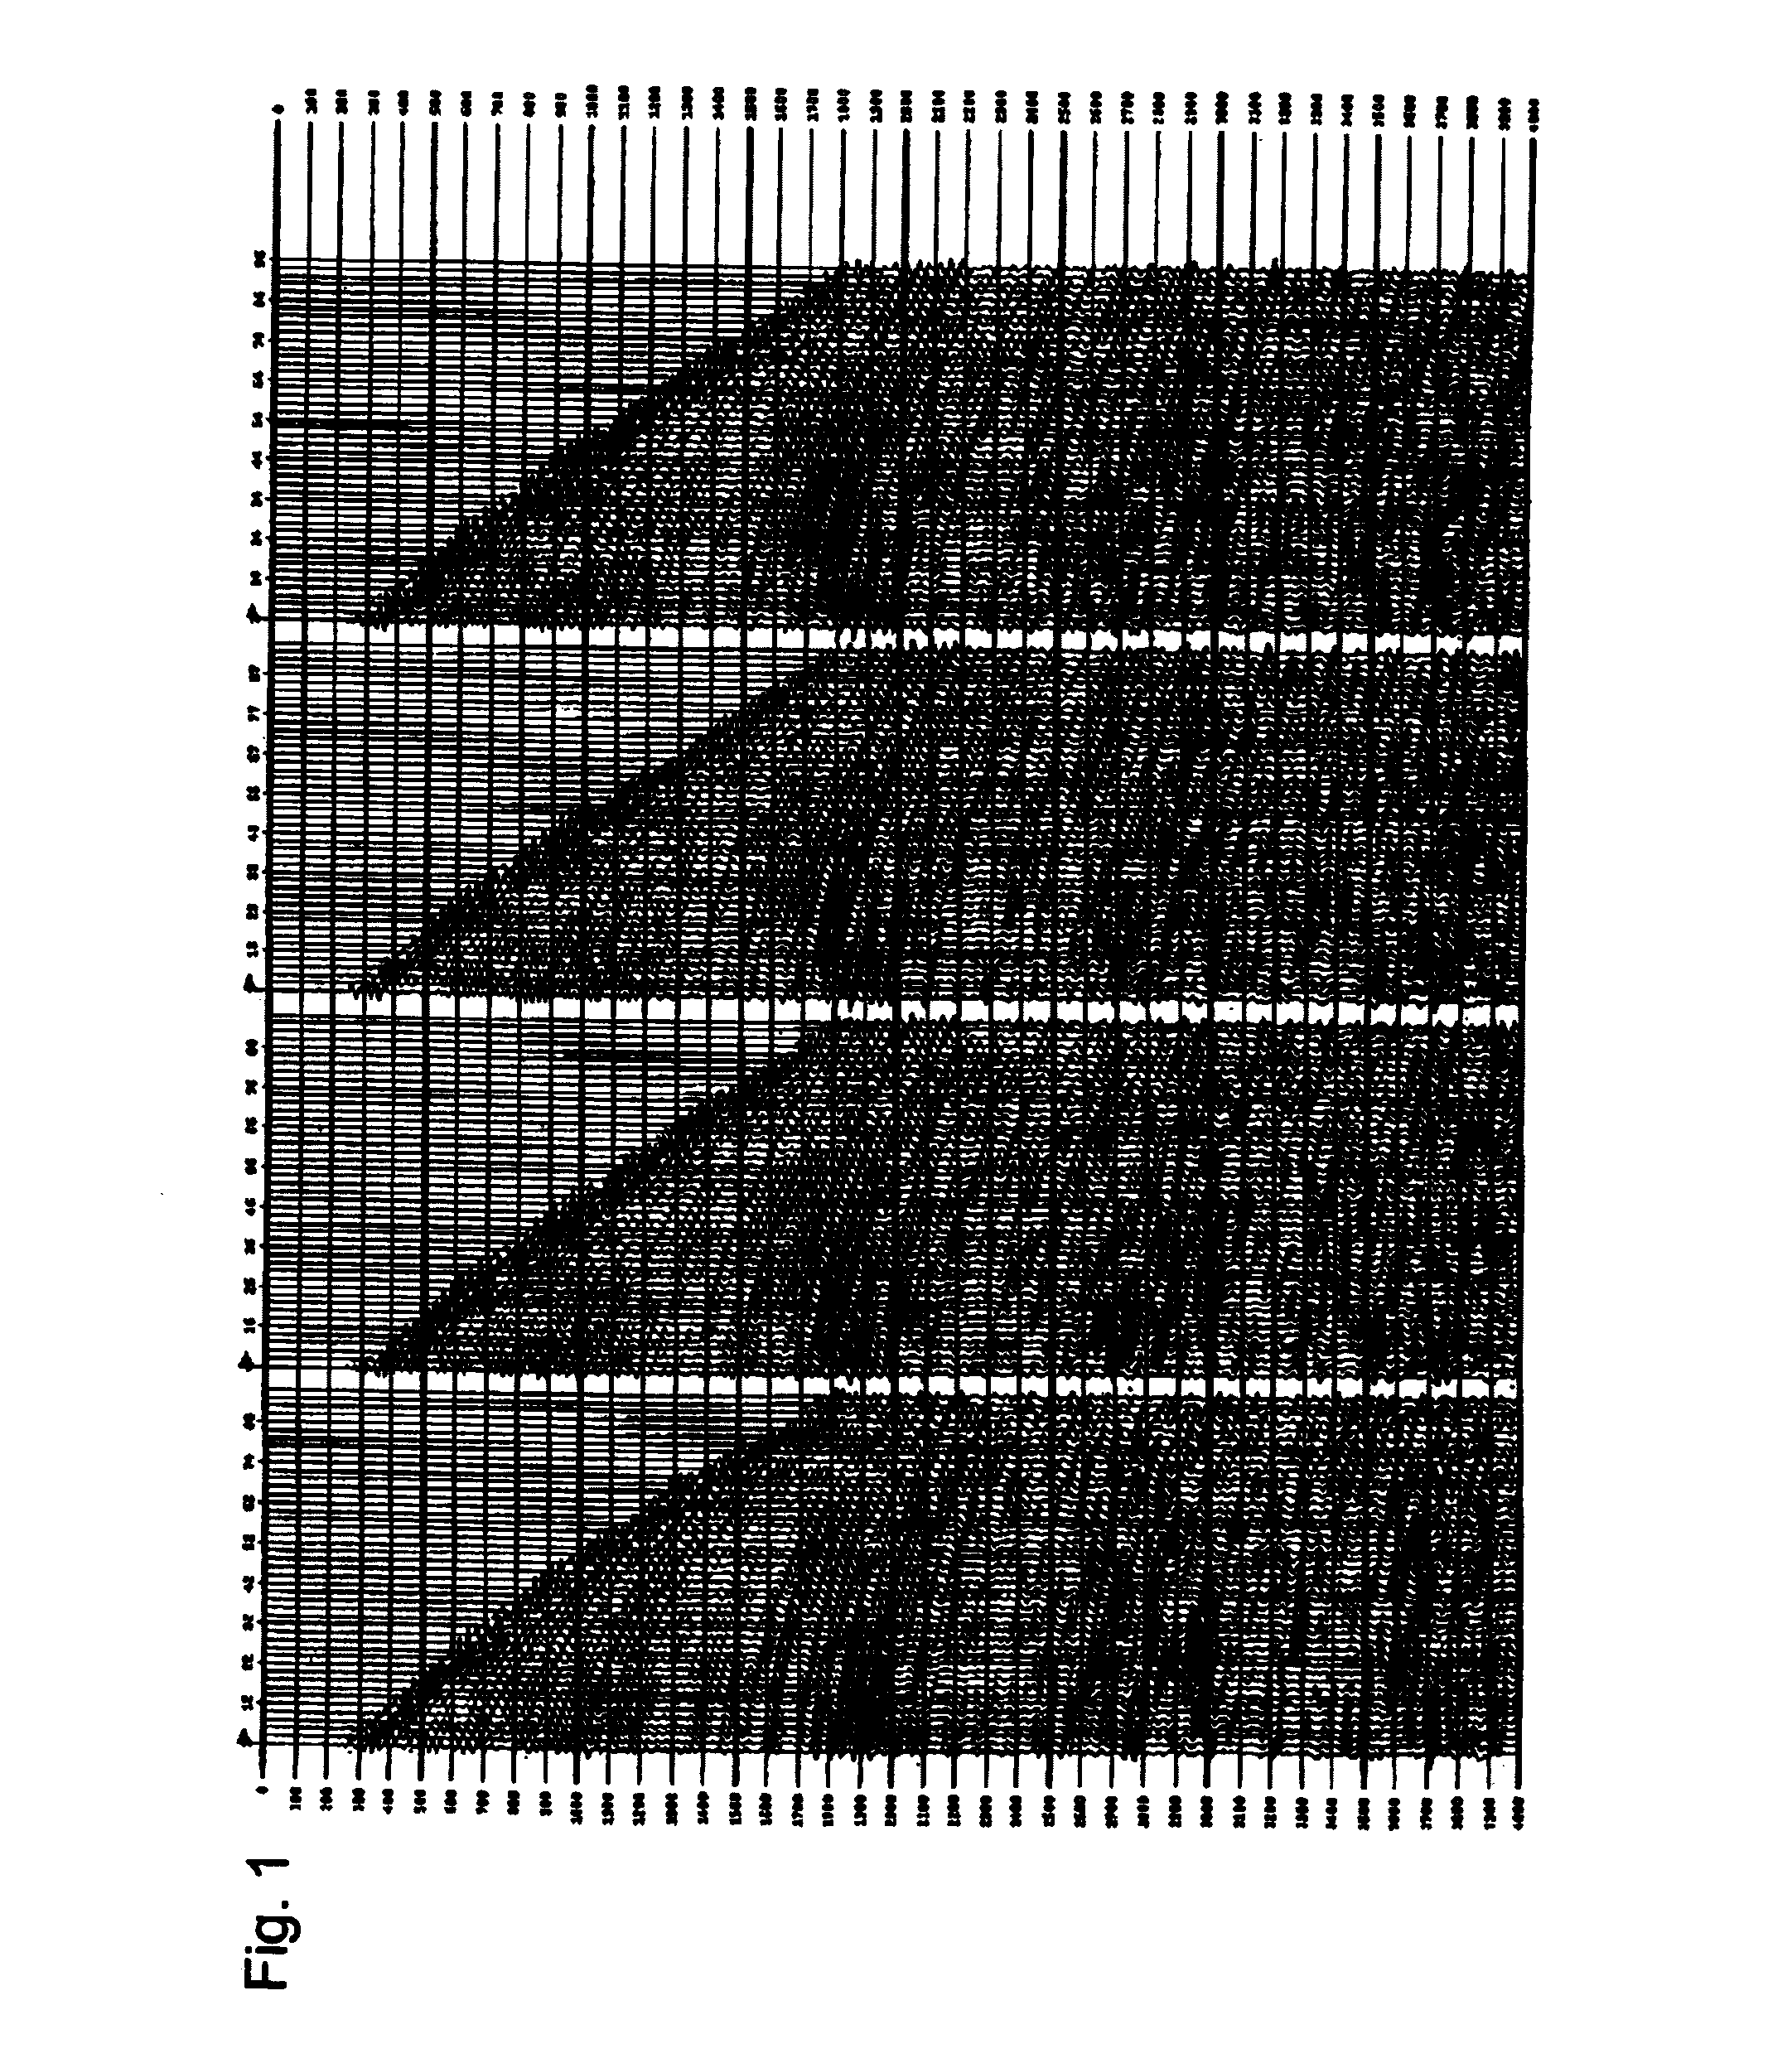
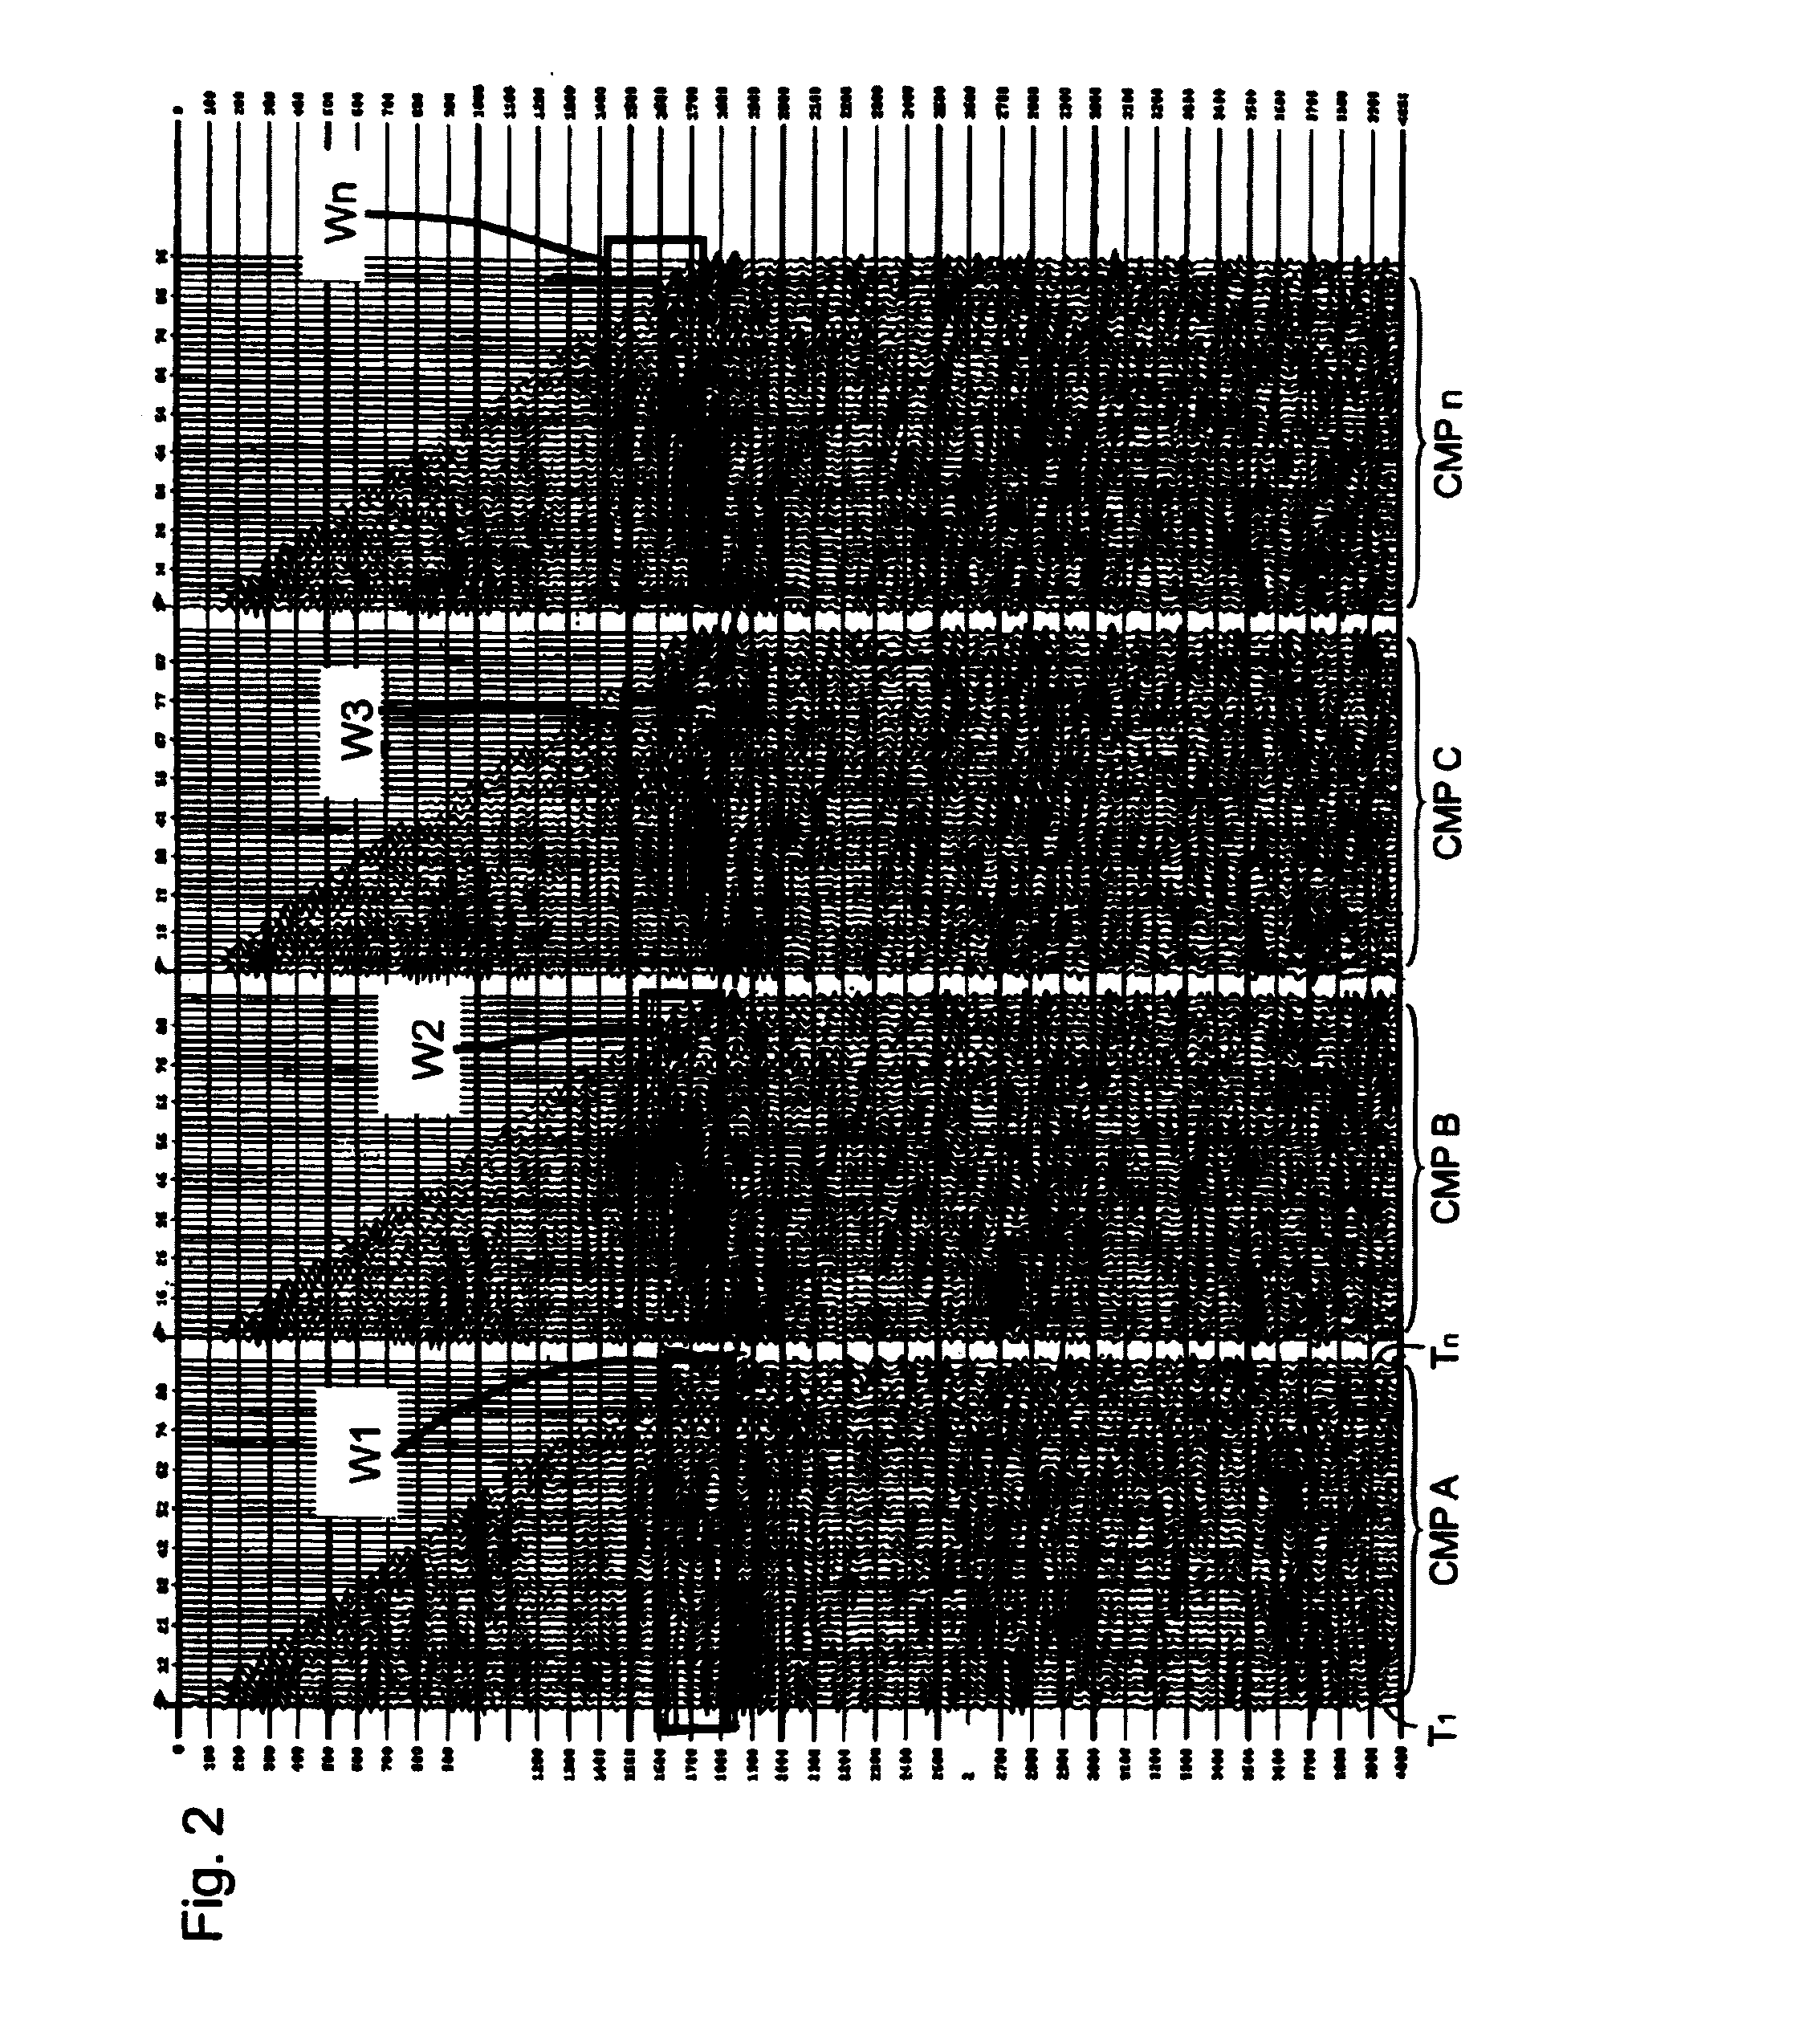
[0033]The method of the invention is best described with initial reference to FIGS. 1 and 2. In FIG. 2, NMO corrected, prestack data is illustrated in a typical seismic display. As discussed above, this data is presented in a seismic display wherein the seismic data is plotted as a function of time and offset, i.e., the vertical axis is time and the horizontal axis is offset. However, each of the four panels illustrated in FIG. 2 is associated with a particular point in space, such that the x-coordinate and the y-coordinate are held constant. Thus, while the data is presented in a two-dimensional display of time and offset, each panel has two implicit additional dimensions, namely the x and y coordinates, associated with it. The method of the invention is to create a plan view that presents the data in at least a four dimensional representation utilizing these additional coordinates associated with a time-offset or depth-offset data set.

[0034]Specifically, a plurality of time or dep...


PUM


Abstract

A method for presenting seismic data in a multidimensional visualization. Specifically, in the visualization technique of the current invention, seismic data is displayed in a multidimensional plan view utilizing at least four dimensions associated with the seismic data, such as for example, x, y, time / depth and offset. In the method of the invention, a plurality of time or depth windows are defined along a reflector or any other time or depth surface of interest on the prestack data as presented in standard CMP displays. In one embodiment of the invention, for each CMP gather, a window is defined around the data representing the reflector of interest. Passing through each window are individual seismic traces. The window, being defined on the seismic display, is associated with a finite time / depth segment and will contain several offsets. In addition, since each CMP gather has a constant x and y coordinate, the window is associated with specific spatial coordinates. These spatial coordinates are used to plot the window on an x-y plan view. Each window represents a segment of the seismic data associated with a reflector or other time / depth window. The data within each window can be analyzed to determine such things as, for example, the accuracy of the particular velocity model selected for data processing methods, such a migration. Furthermore, as multiple windows are plotted on the plan view, trends in the data become more prevalent to an observer. The resulting multidimensional plan view thereby permits presentation of the data utilizing at least four dimensions of the data. In another embodiment, additional information can be extracted from the multidimensional plan view by overlaying this plan view on additional representations of the data, such as for example, the underlying seismic structure. In addition, the visualization techniques could be used on poststack data to visualize several stacked traces around a point of interest.

Description

BACKGROUND OF INVENTION[0001]1. Field of the Invention[0002]The present invention relates to the field of seismic exploration and, more particularly, to a method for visualizing prestack seismic data in plan view (map view) to determine such things as, for example, velocity field accuracy. The invention also relates to the overlay of prestack seismic data in plan view on a contour map of other data such as, for example, a geologic structure map, to visualize the correlation between structural characteristics and various other seismic measurements such as, for example, accuracy of the velocity model or amplitude variation with offset response.[0003]2. Description of the Prior Art[0004]In the oil and gas industry, seismic prospecting techniques are commonly used to aid in the search for and evaluation of subterranean hydrocarbon deposits. Typically, the goal of seismic prospecting is to construct a two dimensional (2-D) or three dimensional (3-D) representation of a subsurface litholo...

Claims


Application Information

Patent Timeline
Patent Type & Authority Patents(United States)
IPC IPC(8): G09G5/00G01G1/00G06T11/00
CPCG06T11/206
Inventor DOCHERTY, PAUL
Owner FAIRFIELD INDUSTRIES INC
Why Eureka
Try Eureka