Method and apparatus for quantitatively determining severity of degradation in a signal

Active Publication Date: 2007-09-11
ORACLE INT CORP
View PDF1 Cites 10 Cited by
  • Summary
  • Abstract
  • Description
  • Claims
  • Application Information

AI Technical Summary

Benefits of technology

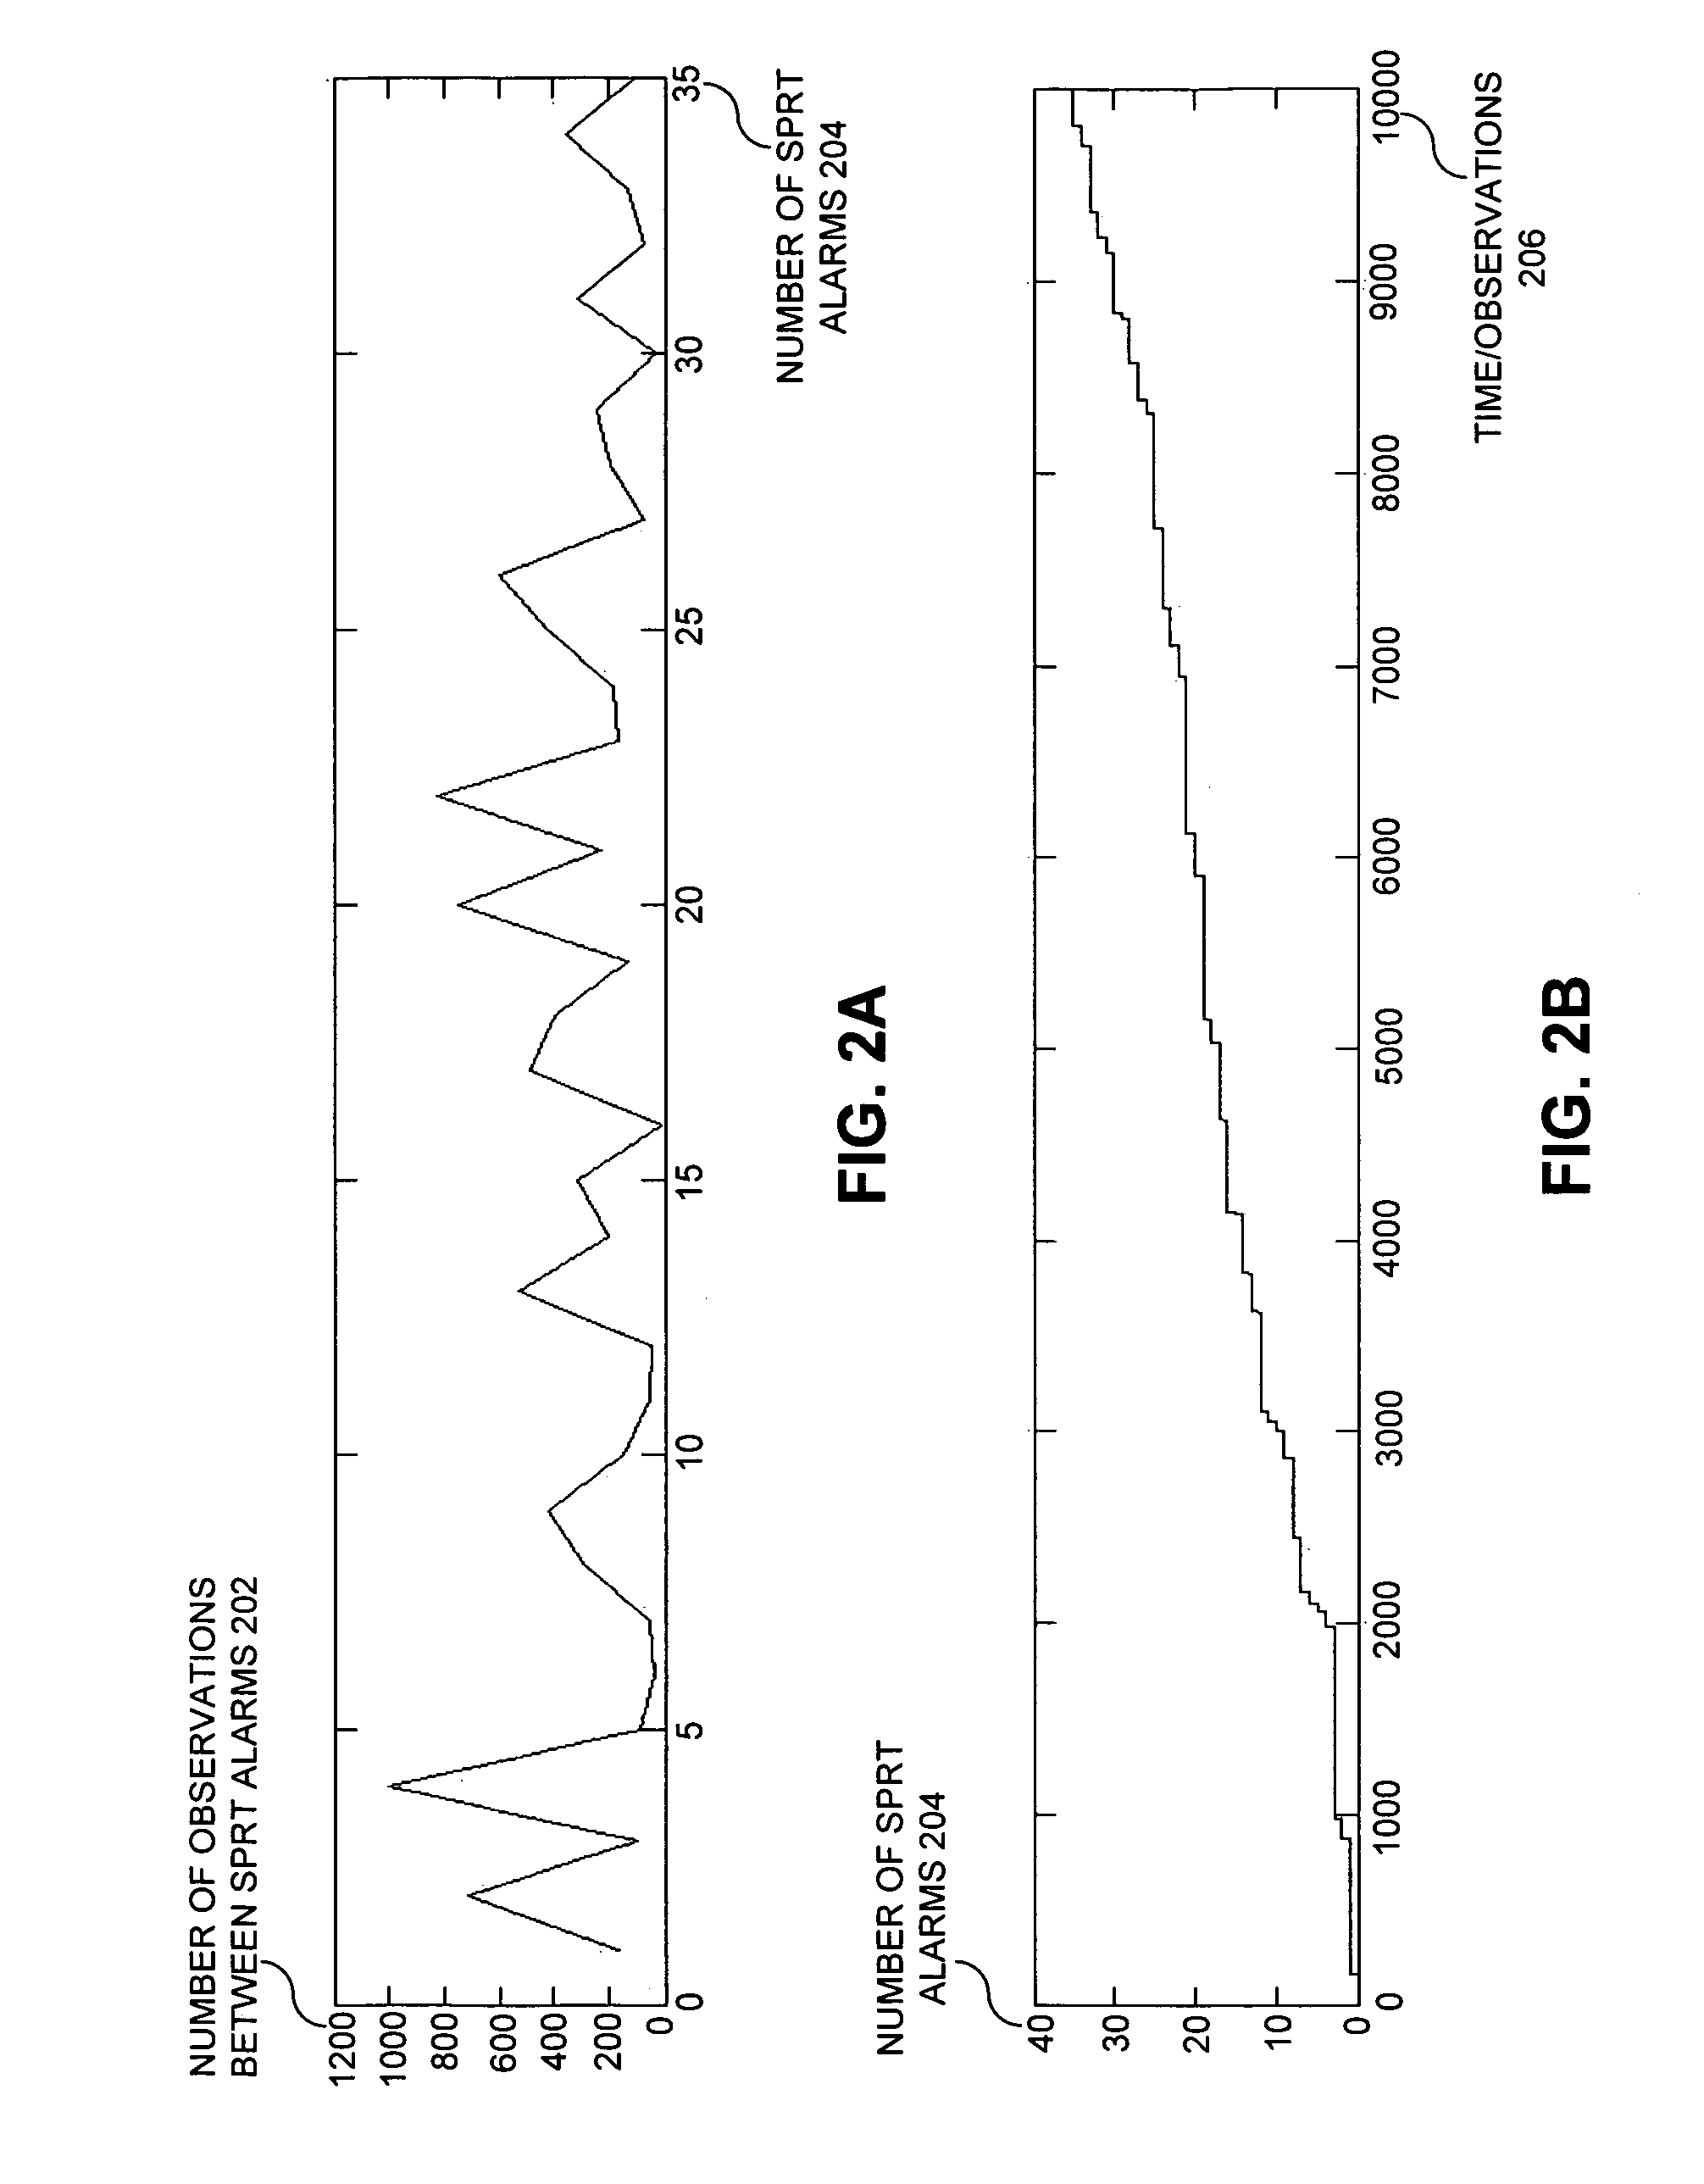
[0013]In a further variation on this embodiment, if the signal is degrading, the slope of the cumulative function: (1) increases continuously with time or observations; or (2) increases abruptly from a sm

Problems solved by technology

Unfortunately, all existing proactive fault-monitoring systems have a serious limitation: they can only indicate that there are anomalies in the monitored signals, but provide no information on the degree or the severity of the degradation.
For example, existing proactive fault-monitoring systems can either flag a component of a

Method used


Image

  • Method and apparatus for quantitatively determining severity of degradation in a signal
  • Method and apparatus for quantitatively determining severity of degradation in a signal
  • Method and apparatus for quantitatively determining severity of degradation in a signal

Examples


Example

[0024]The following description is presented to enable any person skilled in the art to make and use the invention, and is provided in the context of a particular application and its requirements. Various modifications to the disclosed embodiments will be readily apparent to those skilled in the art, and the general principles defined herein may be applied to other embodiments and applications without departing from the spirit and scope of the present invention. Thus, the present invention is not limited to the embodiments shown, but is to be accorded the widest scope consistent with the principles and features disclosed herein.

[0025]The data structures and code described in this detailed description are typically stored on a computer-readable storage medium, which may be any device or medium that can store code and / or data for use by a computer system. This includes, but is not limited to, magnetic and optical storage devices such as disk drives, magnetic tape, CDs (compact discs) ...


PUM


Abstract

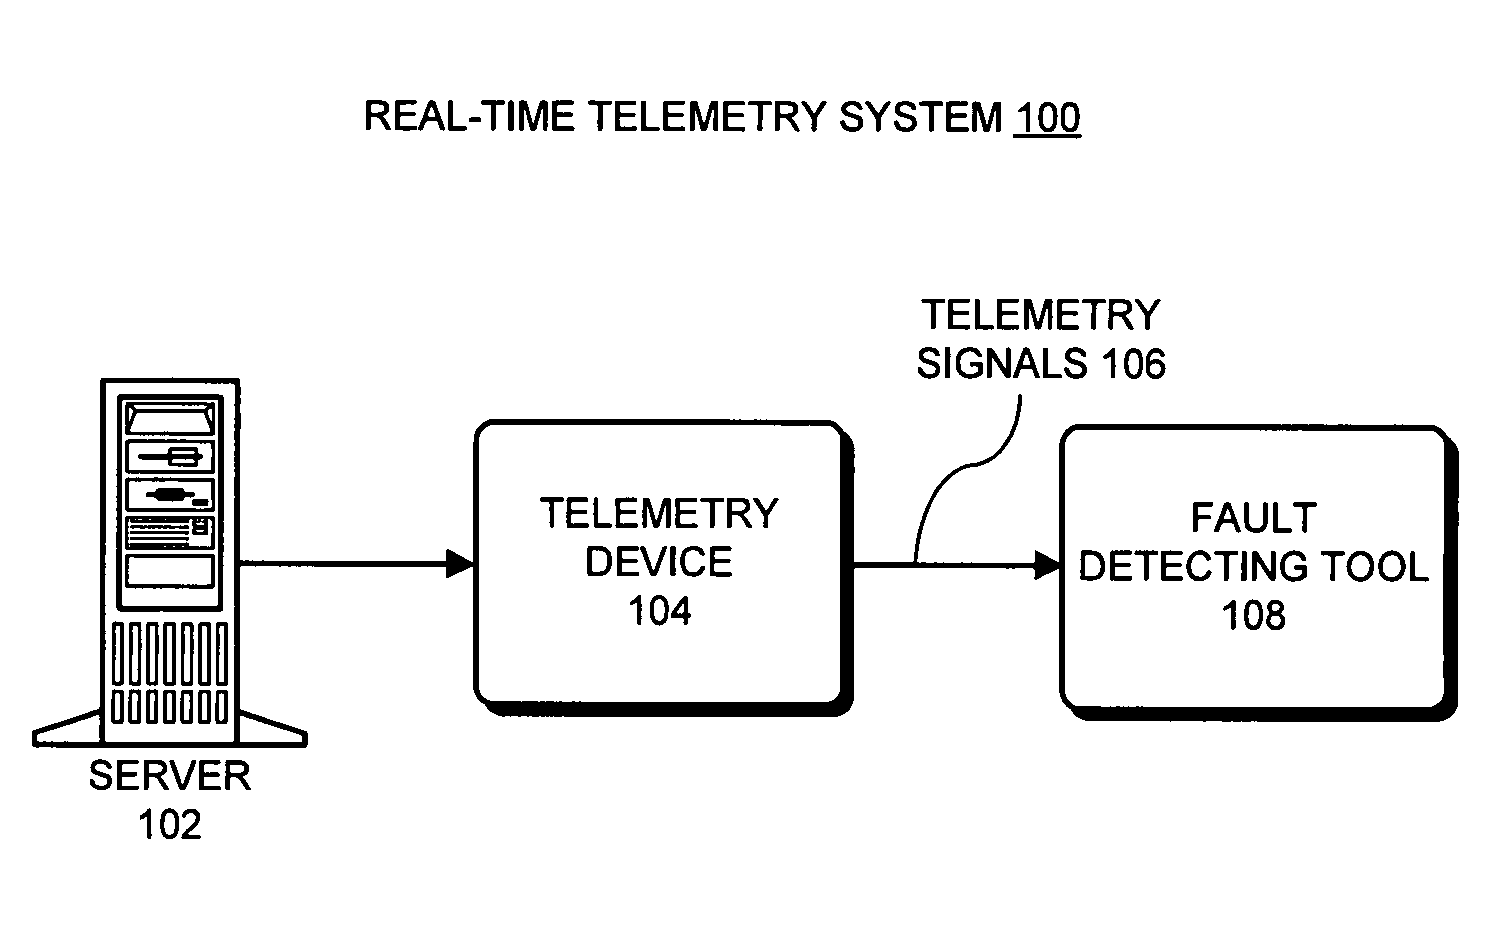
One embodiment of the present invention provides a system that determines a severity of degradation in a signal. During operation, the system receives signal values for the signal, wherein the signal values are received with a constant sampling interval. Next, for each received signal value, the system applies a Sequential Probability Ratio Test (SPRT) to the signal value. If the SPRT generates an alarm on the signal value, the system increments a cumulative counter which records a running total number of the SPRT alarms. Upon receiving each signal value, the system updates a cumulative function using a value in the cumulative counter. Next, the system determines the severity of degradation in the signal from the shape of the cumulative function.

Description

BACKGROUND[0001]1. Field of the Invention[0002]The present invention relates to techniques for proactively detecting impending problems in computer systems. More specifically, the present invention relates to a method and an apparatus for quantitatively determining the severity of degradation in a signal in a computer system.[0003]2. Related Art[0004]Modern computer server systems are typically equipped with a significant number of sensors which monitor signals during the operation of the computer systems. Results from this monitoring process can be used to generate time series data for these signals which can subsequently be analyzed to determine how well a computer system is operating. One particularly useful application of this analysis process is for “proactive fault-monitoring,” to identify leading indicators of component or system failures before the failures actually occur.[0005]Unfortunately, all existing proactive fault-monitoring systems have a serious limitation: they can...

Claims


Application Information

Patent Timeline
IPC IPC(8): G06F15/00
CPCG01R31/31708
Inventor GROSS, KENNY C.WHISNANT, KEITH A.CUMBERFORD, GREGORY A.
Owner ORACLE INT CORP
Why Eureka
Try Eureka