Method and system for displaying time-series data and correlated events derived from text mining

a time-series data and text mining technology, applied in visual data mining, instruments, static indicating devices, etc., can solve the problems of limited disclosure, stock price may be affected, limited disclosure,

Inactive Publication Date: 2009-08-04
REFINITIV US ORG LLC
View PDF7 Cites 61 Cited by
  • Summary
  • Abstract
  • Description
  • Claims
  • Application Information

AI Technical Summary

Problems solved by technology

Also, when a key executive resigns from a company, the company's stock price may be affected.
However, the disclosure is limited, among other things, by its failure to teach or suggest

Method used


Image

  • Method and system for displaying time-series data and correlated events derived from text mining
  • Method and system for displaying time-series data and correlated events derived from text mining
  • Method and system for displaying time-series data and correlated events derived from text mining

Examples


Embodiment Construction

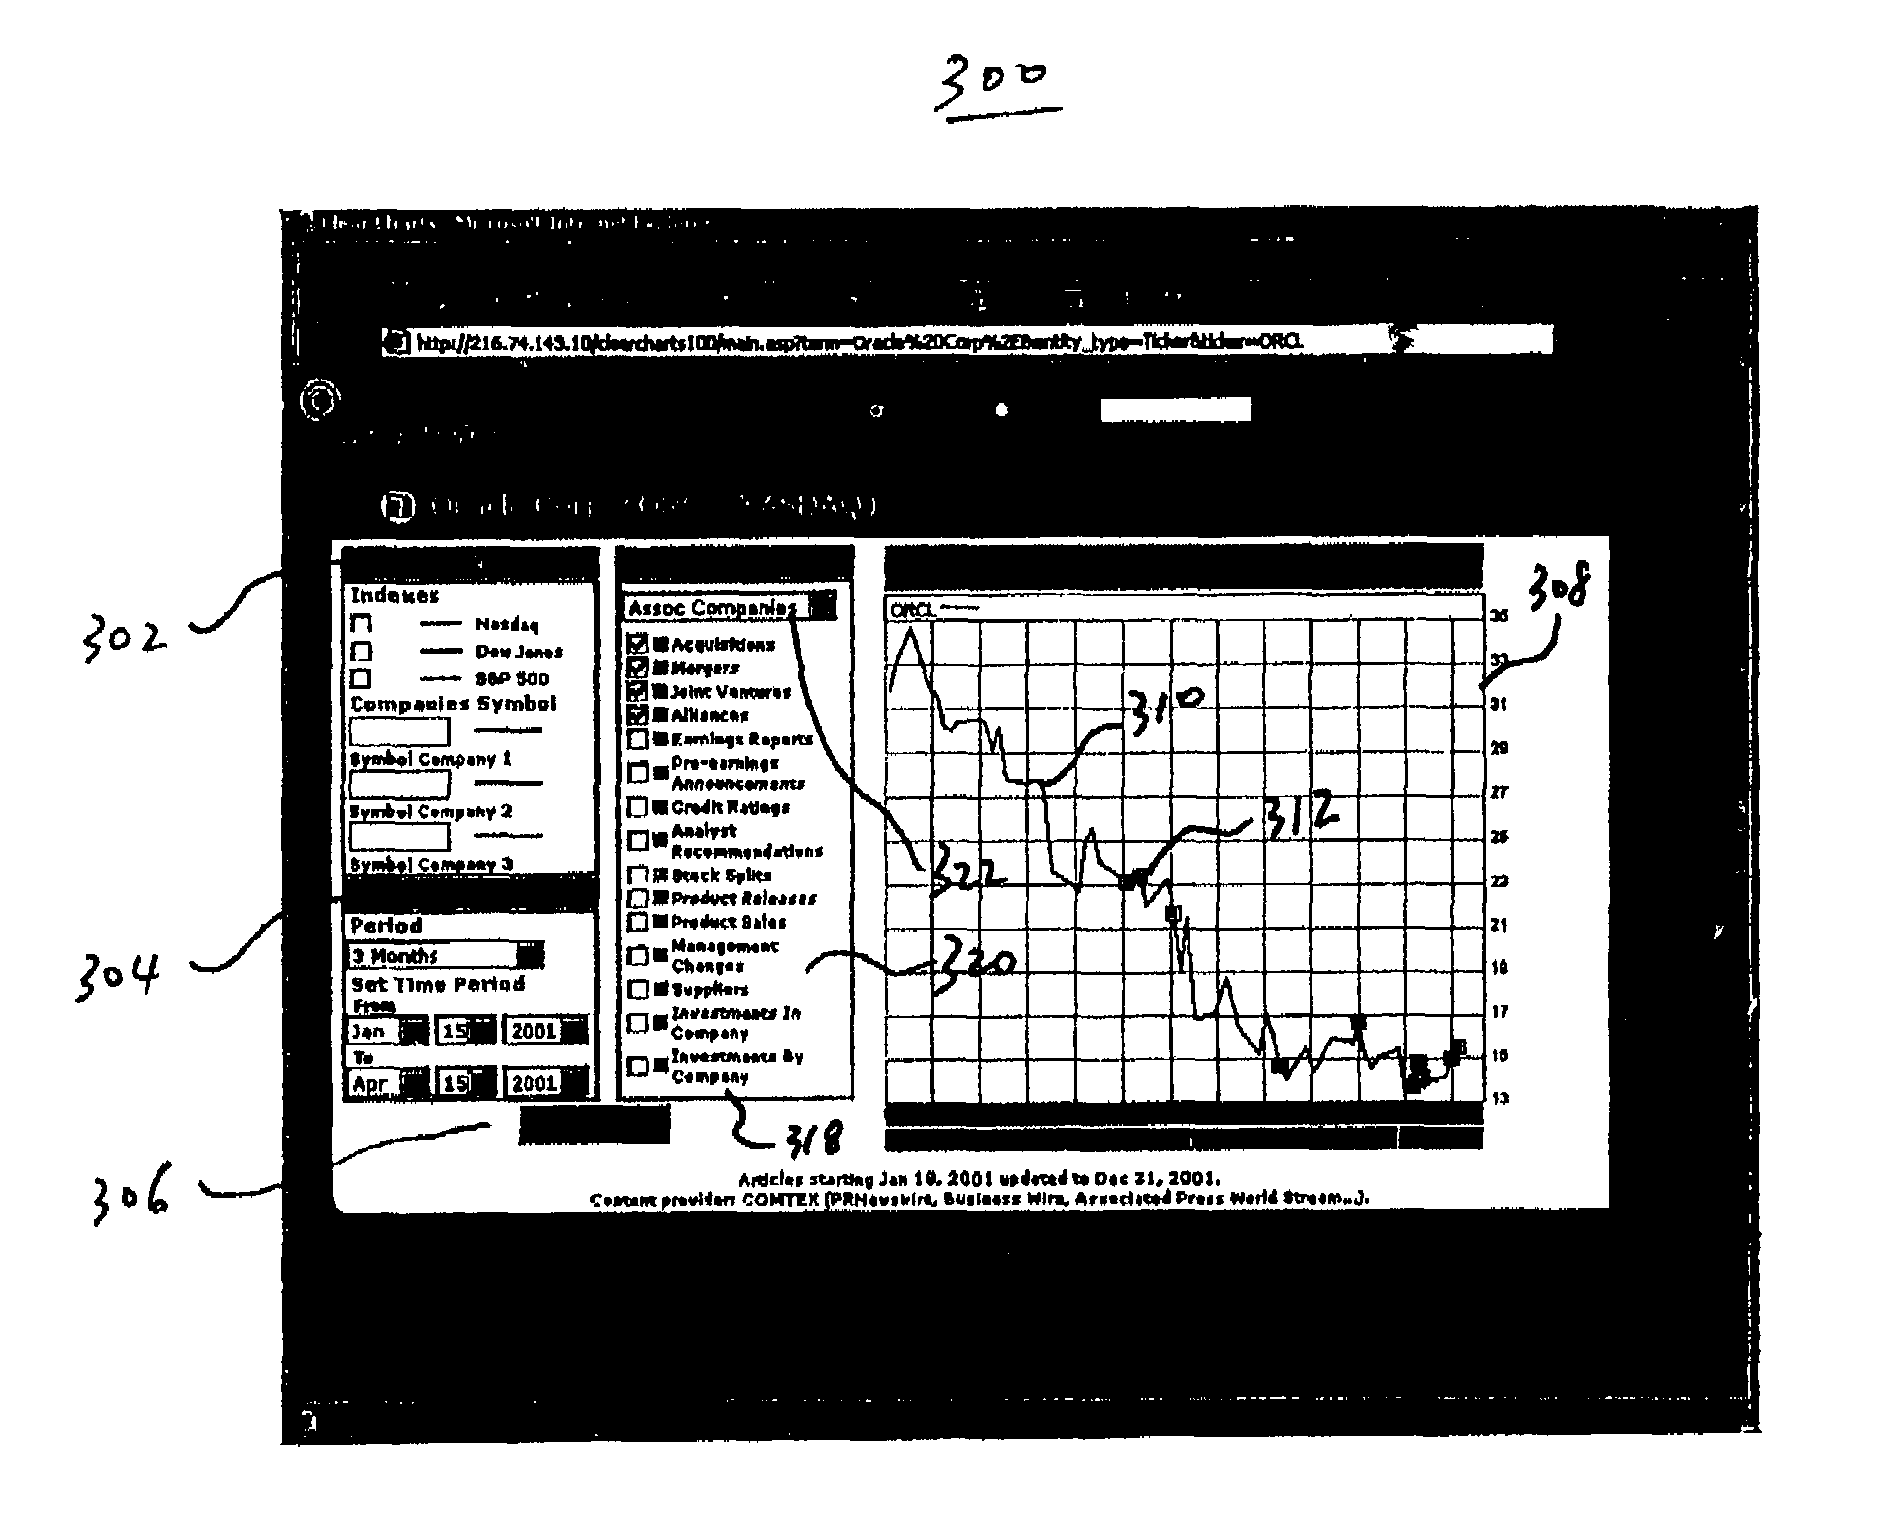
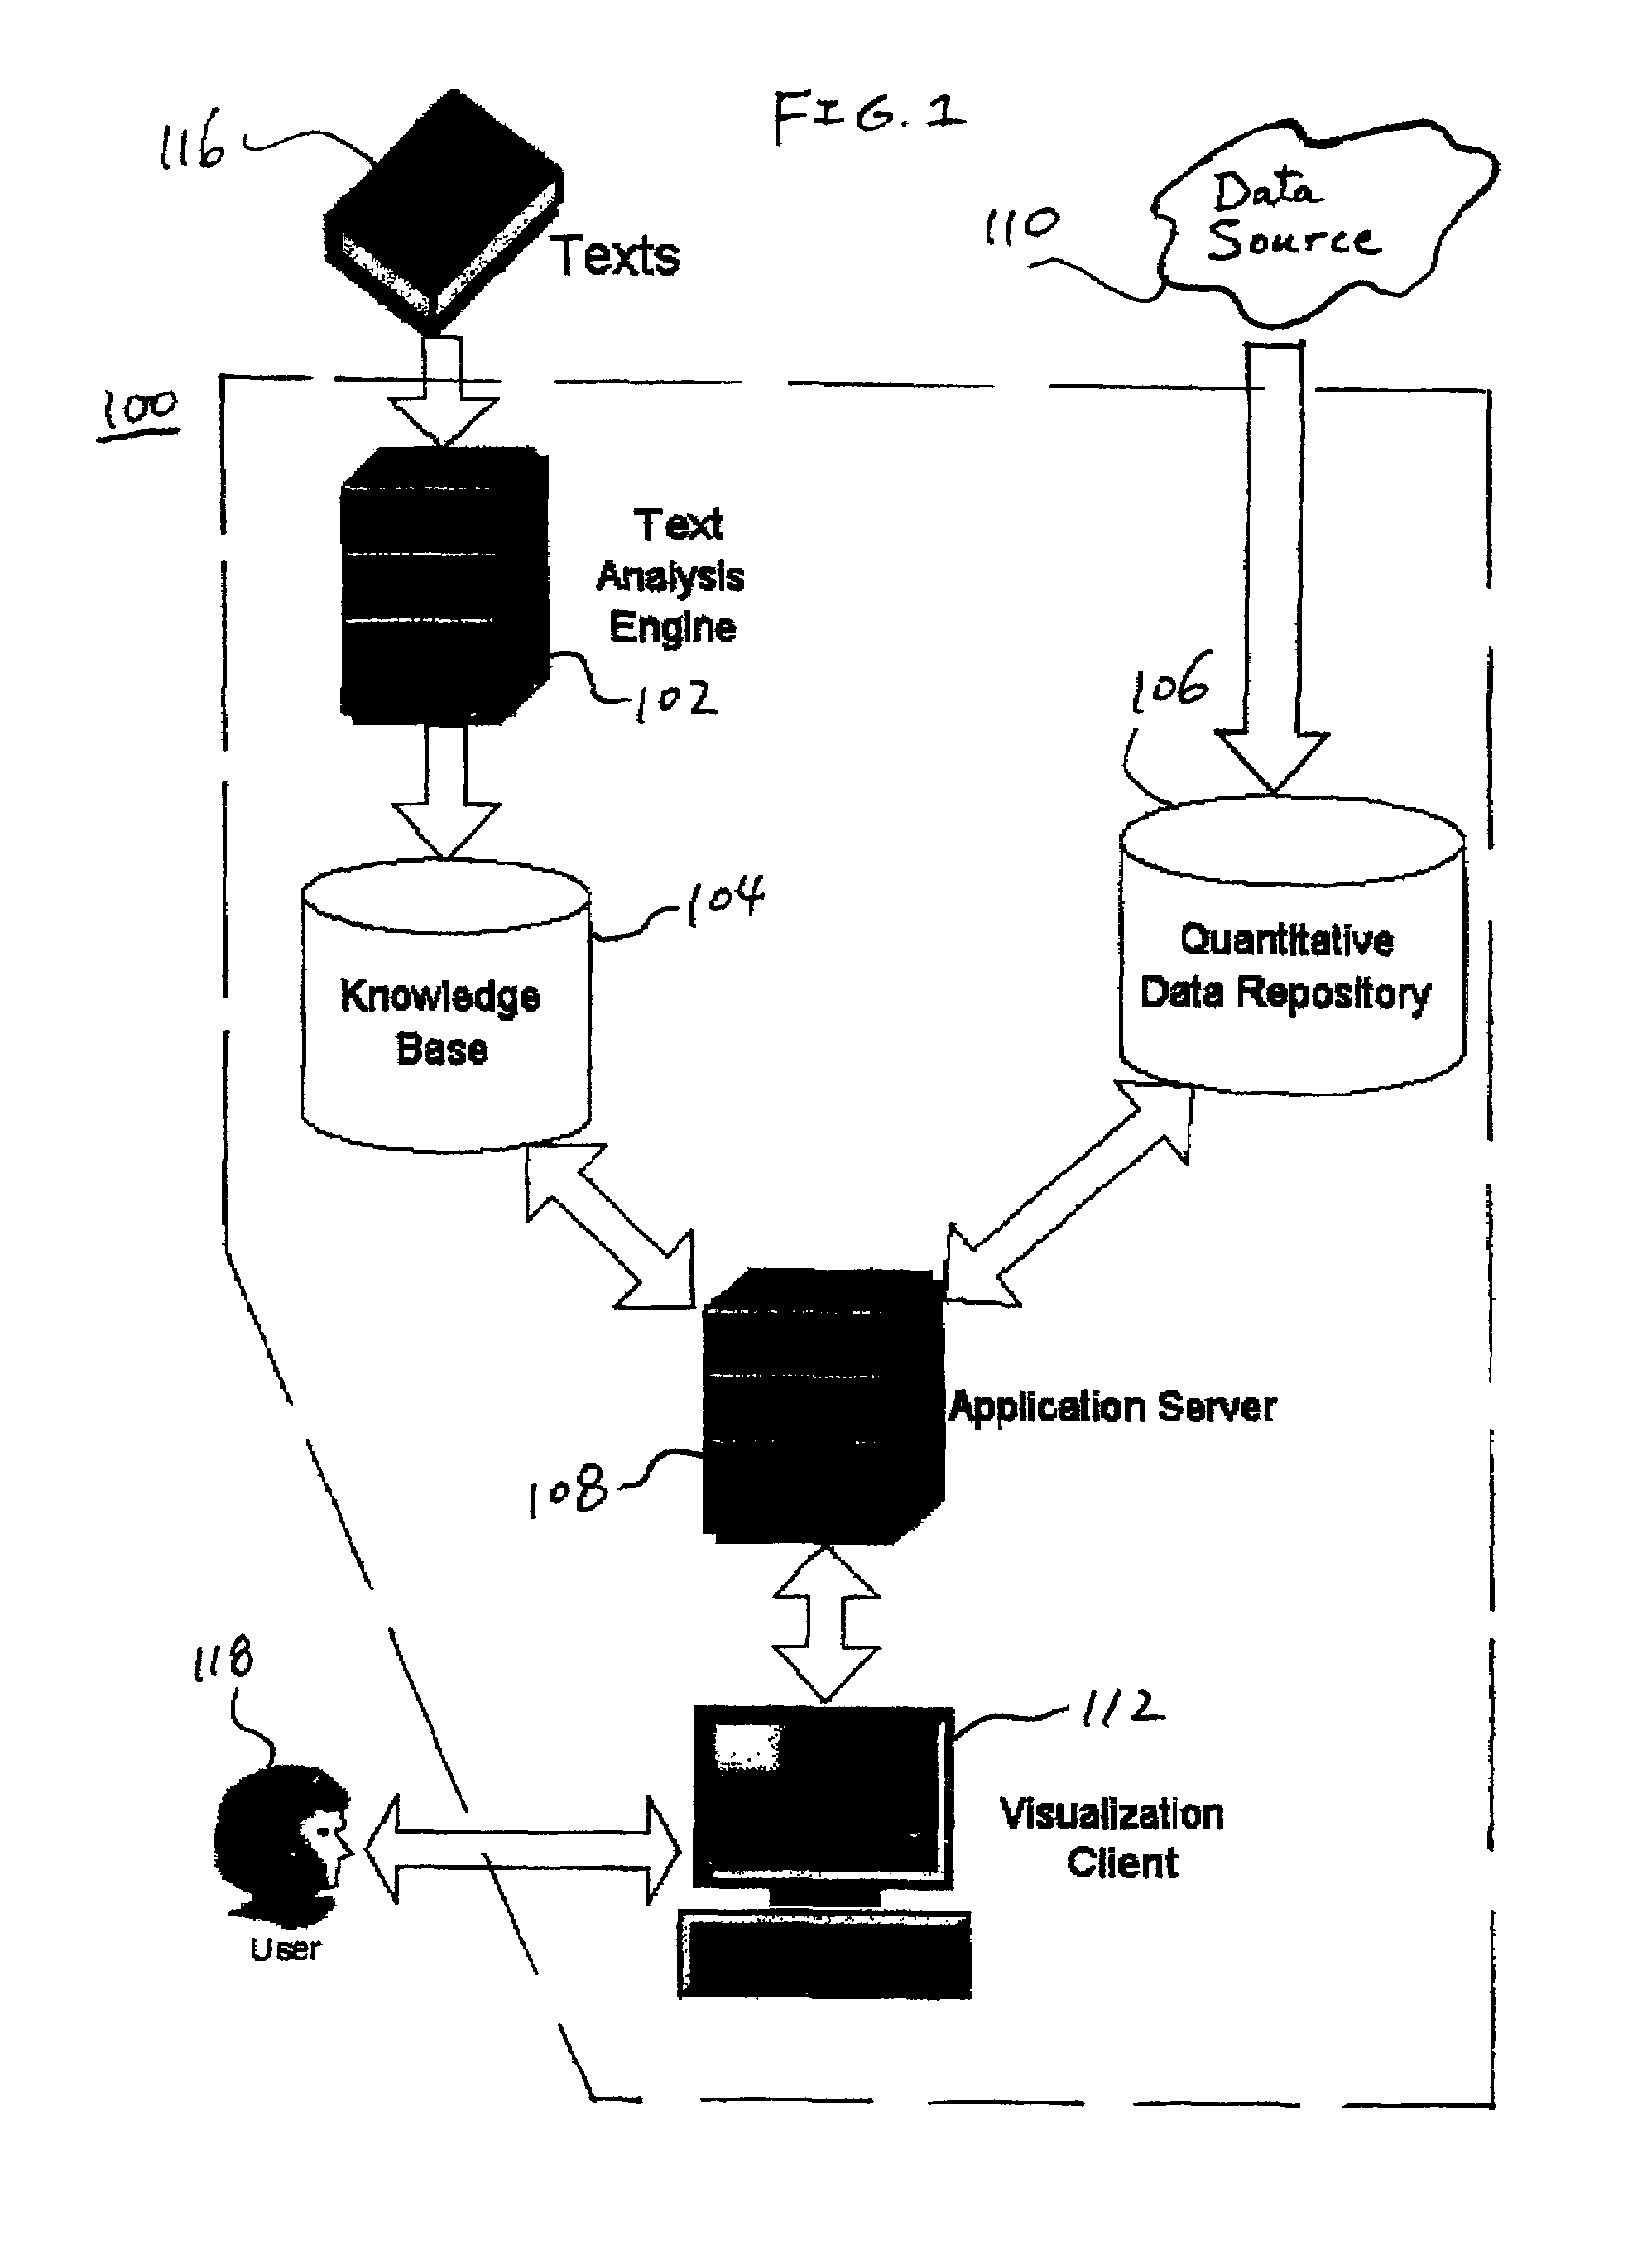
[0021]FIG. 1 is a block diagram of a correlating system according to one embodiment of the present invention. The correlating system is for displaying time-series data, preferably in the form of trend graphs, and correlated events derived from text mining. In addition to representing a numerical sequence as it corresponds to time, the correlating system also provides explanatory power by plotting on a graph icons representing key events associated with the numerical sequence and showing the correlation between the occurrence of such events and the numerical sequence as the numerical sequence evolves over time. As shown in FIG. 1, the correlating system 100 comprises a text analysis engine 102, a knowledge base 104, a quantitative data depository 106, an application server 108, and a visualization client 112. The correlating system 100 is configured to receive and process to texts 116 and may be used by a user 118.

[0022]Texts 116 are unstructured text documents, such as news articles...


PUM


Abstract

The present invention is directed to a method and system for correlating time-series data with events derived from text mining. The system is configured to receive a time period and a parameter concerning an entity, retrieve an event which is related to the entity and occurred within the time period from events which are previously extracted automatically from unstructured text, and display an indication of the event superimposed on a display representing the time series of the parameter for the time period.

Description

FIELD OF THE INVENTION[0001]The present invention generally relates to a method and system for displaying time-series data and correlated events. More specifically, the present invention relates to a method and system for displaying time-series data and correlated events derived from text mining.BACKGROUND OF THE INVENTION[0002]Numerical serial data, such as the prices of stocks on any given date, is commonly presented graphically on a chart. For example, financial serial data is commonly presented in the form of time-series data, where the X axis stands for time and the Y axis stands for the financial data, such as stock price, volume of transactions, degree of change, or other values pertaining to stocks. Looking at such a chart, one may see the changes in the stock price as they occur over time and observe trends and patterns. Plotting more than one such series of numerical data on the same graph, one may also compare one stock to another stock or an index representing an aggrega...

Claims


Application Information

Patent Timeline
IPC IPC(8): G06T11/20G06F17/30
CPCG06F17/30572G06F17/30548G06F16/2474G06F16/26
Inventor LANDAU, DAVIDFELDMAN, RONENLIPSHATZ, ORLYAUMANN, YONATANSHEMTOV, HADAR
Owner REFINITIV US ORG LLC
Why Eureka
Try Eureka