
Map display method used to enhance the display of a building by showing several levels of this building

Inactive Publication Date: 2014-03-25
WSOU INVESTMENTS LLC
View PDF4 Cites 12 Cited by
  • Summary
  • Abstract
  • Description
  • Claims
  • Application Information

AI Technical Summary

Benefits of technology

The patent text describes a map display method that enhances the display of a building on a map by showing all the levels of the building without hiding other parts of the map. The method ensures that important objects located at the periphery of the building are also visible. The ratios used for enlarging the building are lower than 100% to save surface area, but a minimum enlargement ratio is chosen to still allow users to read the important objects. The technical effect of this method is an improved display of a building on a map that shows all levels without hiding other parts of the map.

Problems solved by technology

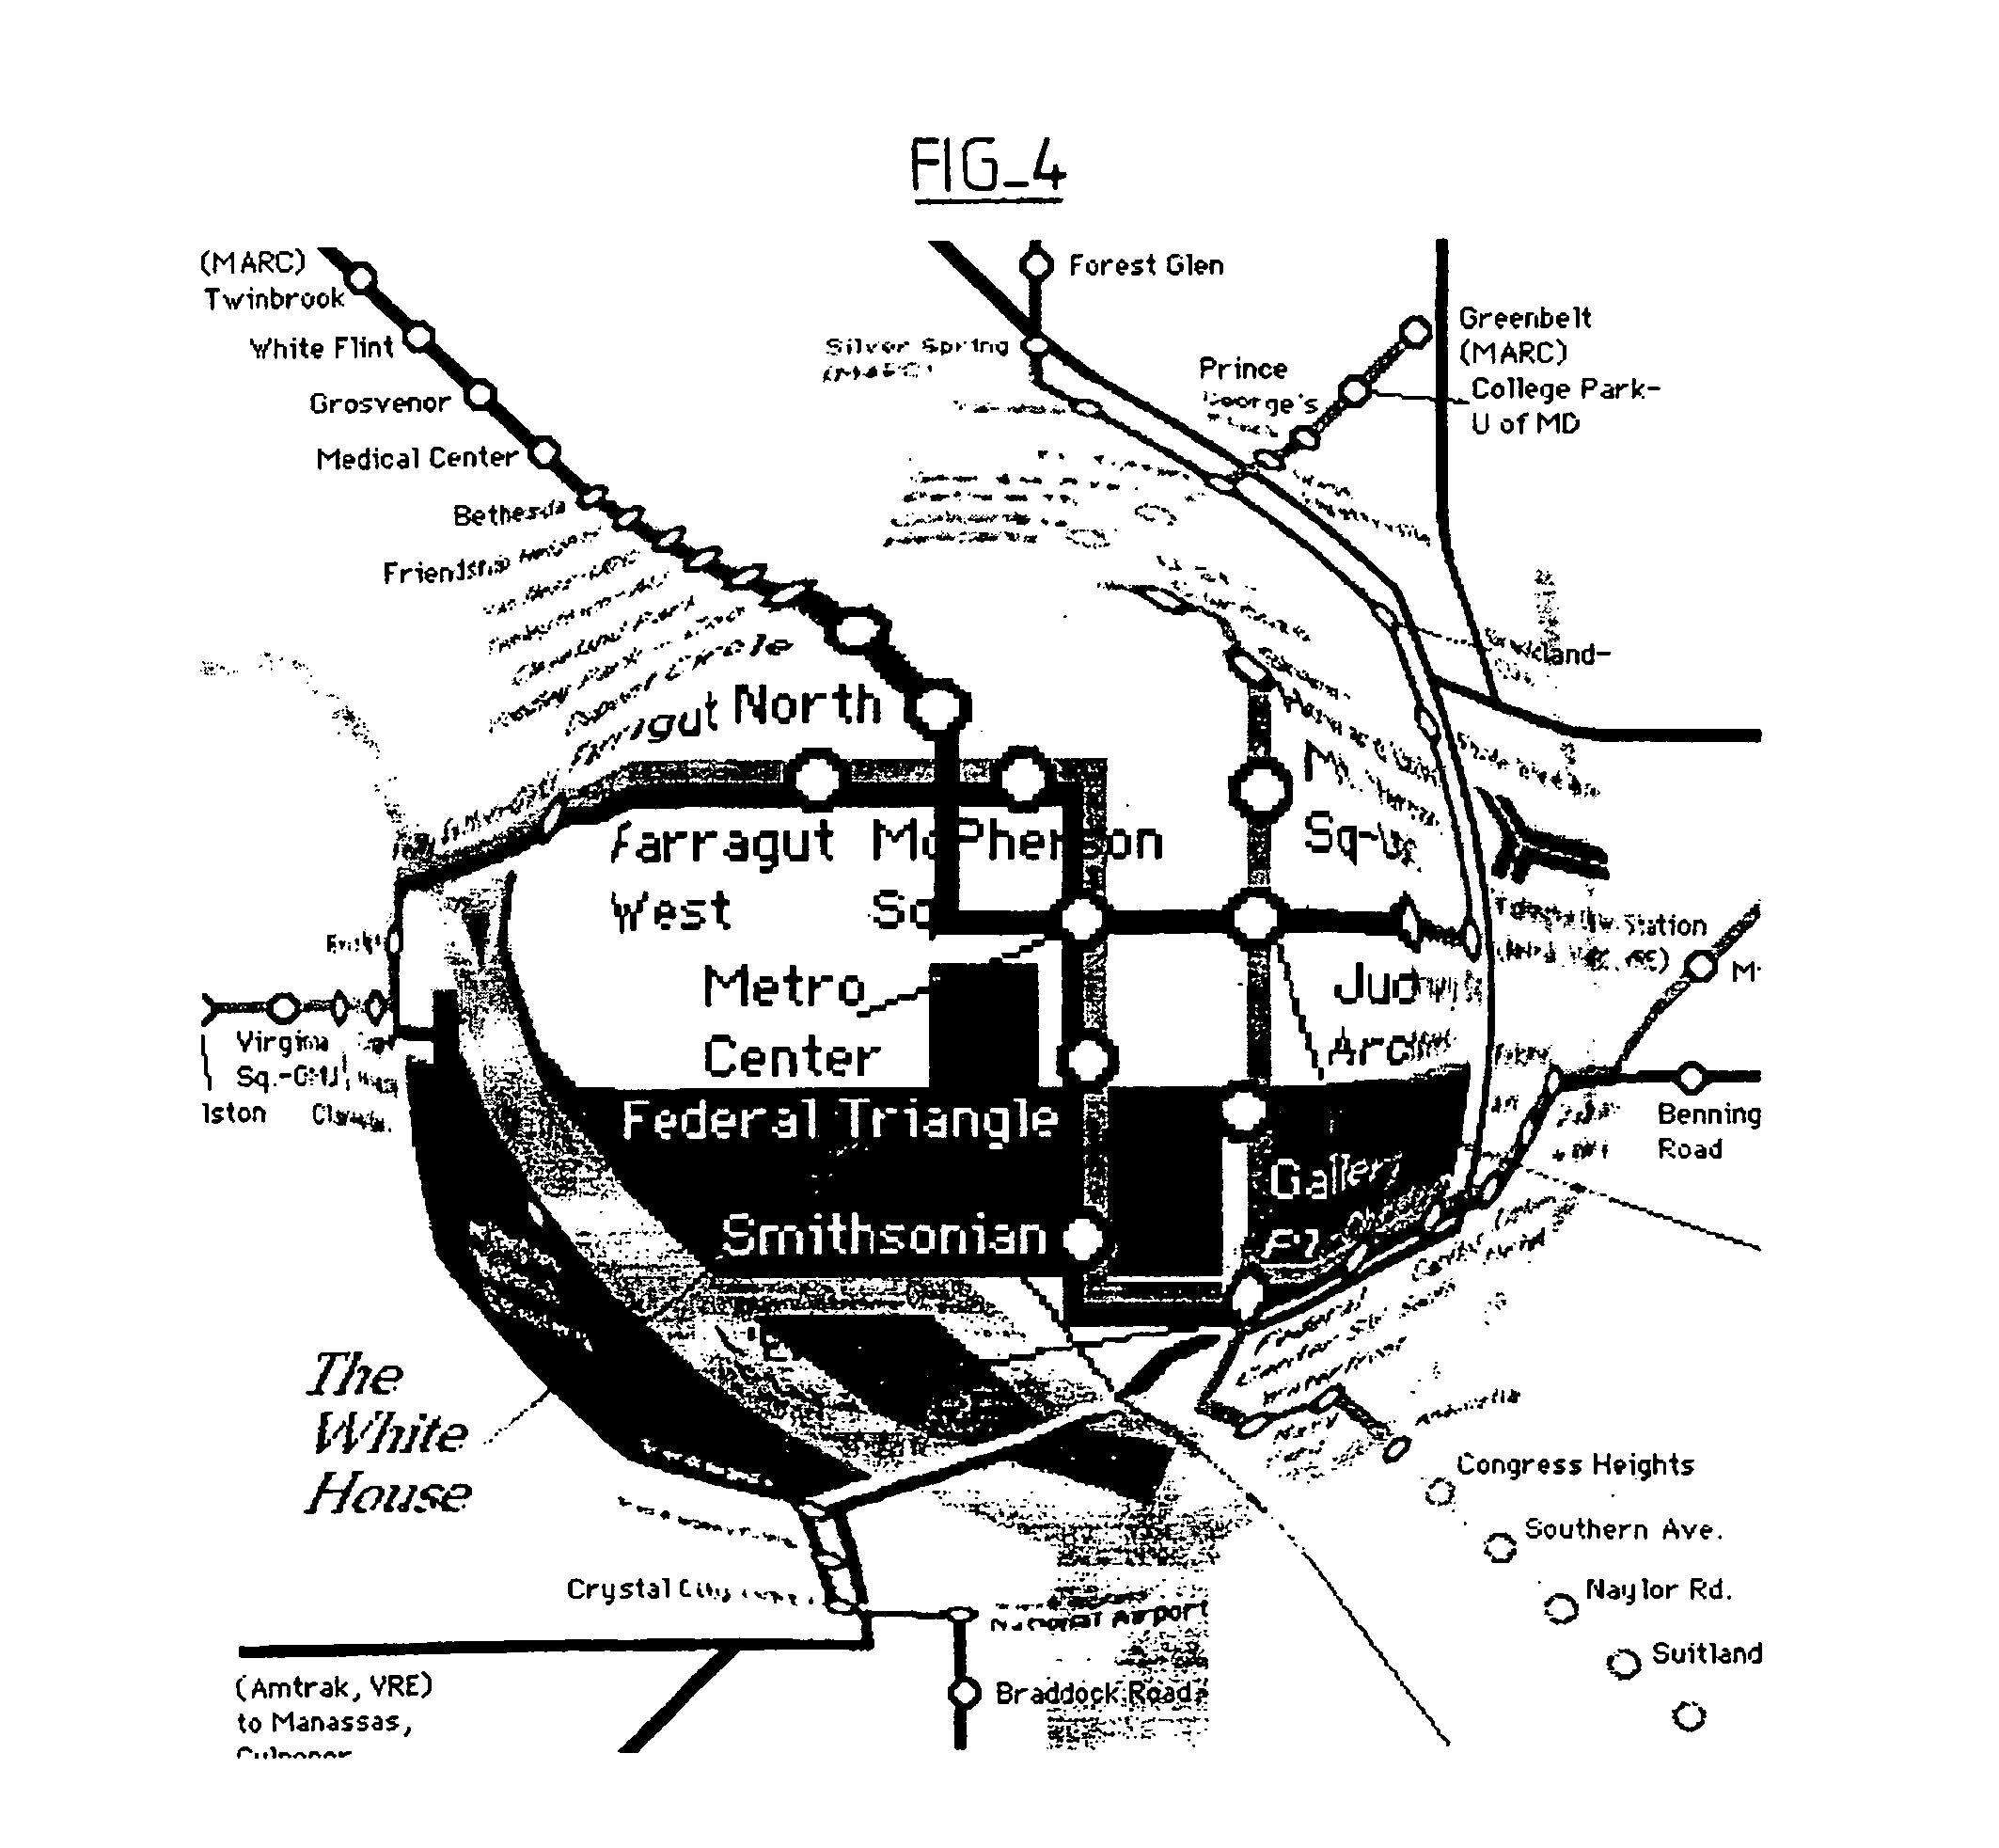
For example, if the map shows a telecommunication network with small symbols to indicate alarms, a priority stage in the creation of the new image involves choosing the minimum value of the enlargement ratio which will be applied in the peripheral zone of the building to be displayed, such that a user can still easily read the alarm symbols in the peripheral zone, since it would be very damaging for an alarm to pass unnoticed due to the reduction in enlargement size at the periphery of the building.

Method used


Image

  • Map display method used to enhance the display of a building by showing several levels of this building
  • Map display method used to enhance the display of a building by showing several levels of this building
  • Map display method used to enhance the display of a building by showing several levels of this building

Examples


Embodiment Construction

[0058]FIGS. 5 to 7 show how to enlarge a portion of a map without hiding a portion of this map: FIG. 6 shows in diagram form the original image C1 of a map, on a computer screen. A user wishes to locally enlarge this image, by enlarging a portion, said to be the portion to be enlarged, which occupies a surface SPA1 in the original image C1.

[0059]FIG. 5 shows the graph of the enlargement ratio T1 in different portions of the original image C1. The image elements concerned for this graph are located on a straight line XX passing through the center O of the surface SPA1 of the portion to be enlarged. In this example, the graph would be the same for any other straight line passing through the center O.

[0060]FIG. 7 shows in diagram form the image C1′ obtained by locally enlarging the image C1. The portion to be enlarged is enlarged by displaying it, in the new image C1′, over a surface SPA1′ larger than the surface SPA1. The elements of this portion to be enlarged are enlarged with respe...


PUM


Abstract

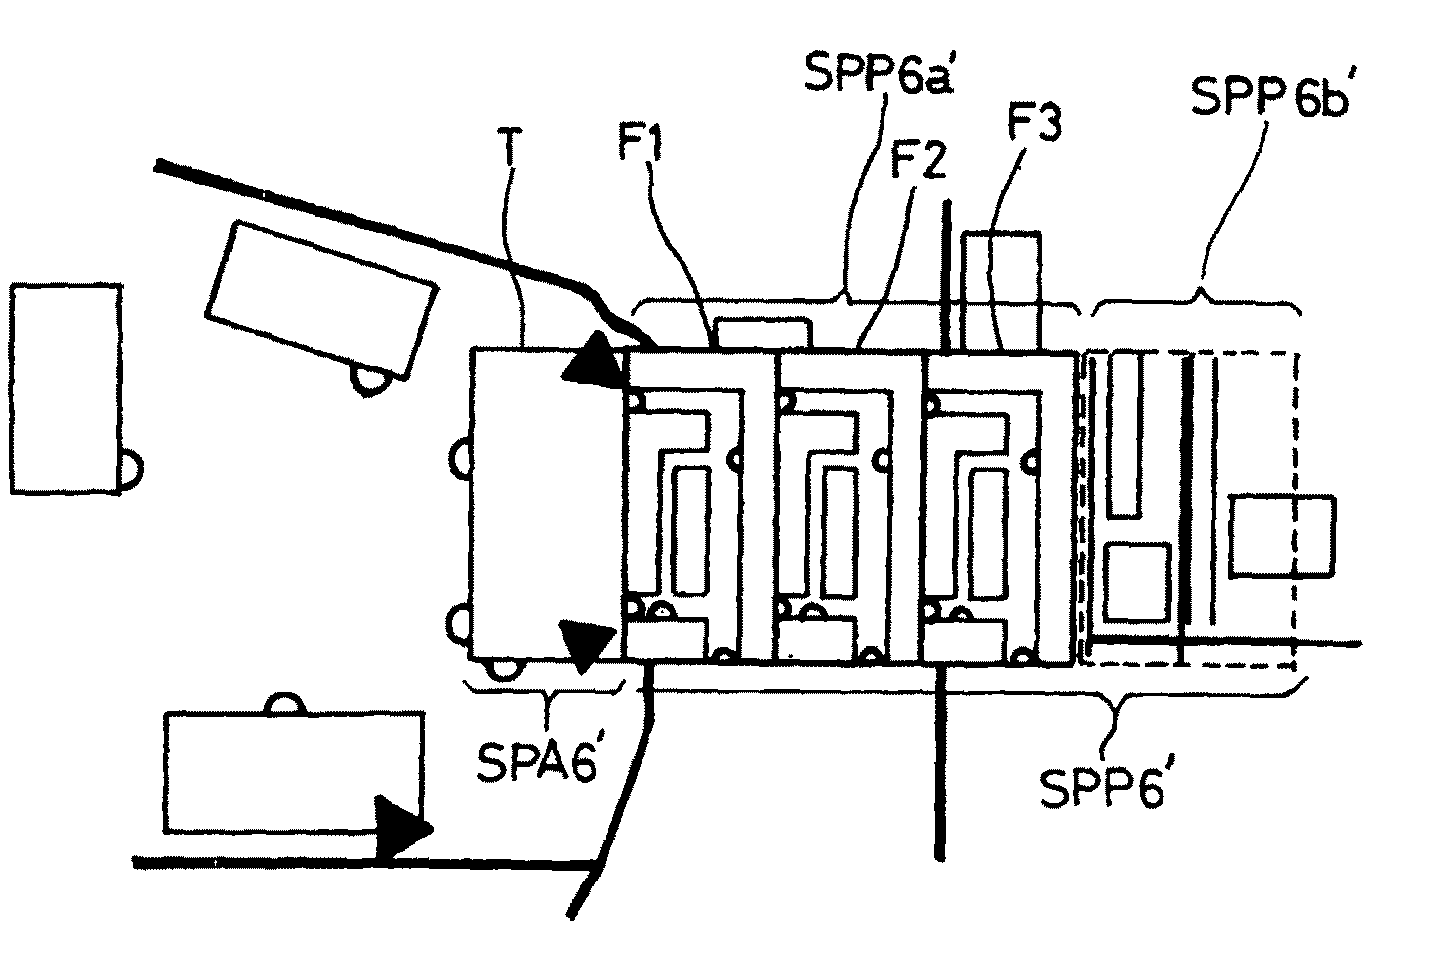
This method is used to enhance the display of a building (SC) showing several levels (T, F1, F2, F3) of this building, without hiding a portion of the map. It consists of:displaying (SPA6′) a first level (T) of this building in the position of this building in the original image, with an enlargement ratio of 100%,displaying (SPP6a′) the other levels (F1, F2, F3) of this building, juxtaposing them with the first level (T), with an enlargement ratio of 100%;and displaying (SPP6b′), in juxtaposition with the display (SPP6a′) of the different levels (F1, F2, F3) of this building, a surface (SPP6b′) representing a so-called peripheral portion (SPP6) located, in the original image, on the periphery of this building, this peripheral portion (SPP6) being displayed (SPP6′) applying:to all elements of this peripheral portion (SPP6), enlargement ratios greater than or equal to a pre-determined minimum value,and at least to some elements, respective enlargement ratios with values lower than 100%, chosen such that the combination of the display surface (SPP6b′) of the peripheral portion and the display surface (SPP6a′) of all the levels (T, F1, F2, F3) occupies, in the new image of the map, a surface (SPA6′+SPP6′) equal to that of the combination of the display surface (SPA6) of the building (SC) and the display surface (SPP6) of the peripheral portion in the original image of the map.

Description

BACKGROUND OF THE INVENTION[0001]1. Field of the Invention[0002]The invention concerns a map display method which can be used in a geographic information system (GIS), or similar system, for example a telecommunication network optimization graphical system. A GIS is a computer tool used to organize and present spatially referenced alphanumerical data, as well as to produce drawings and maps.[0003]2. Related Art[0004]The role of a geographic information system is to propose a more or less realistic representation based on graphic primitives such as points, vectors (arcs), polygons or grids (also known as rasters). Associated with these primitives are attribute information such as the nature of the primitive (road, railway, forest, etc.) or any other contextual information (number of inhabitants, type or surface area of a commune for example).[0005]A geographic information system is used to handle databases for flat or three-dimensional geographic data. A geographic table consists of ...

Claims


Application Information

Patent Timeline
IPC IPC(8): G06T17/00
CPCG06T3/0018G06T17/00G09B29/007G06T3/047
Inventor HOULLIER, JEAN-ROCHBRETHEREAU, ALAINDE MATHAN, BEATRIX
Owner WSOU INVESTMENTS LLC
Learn More