

Summarized network graph for semantic similarity graphs of large corpora
a network graph and semantic similarity technology, applied in the field of graph analysis, can solve the problems of many analysts failing to discover useful insights buried in graphs, difficult for humans to interpret graphs, and massively exceeding human cognition's capabilities
- Summary
- Abstract
- Description
- Claims
- Application Information
AI Technical Summary
Benefits of technology
Problems solved by technology
Method used
Image

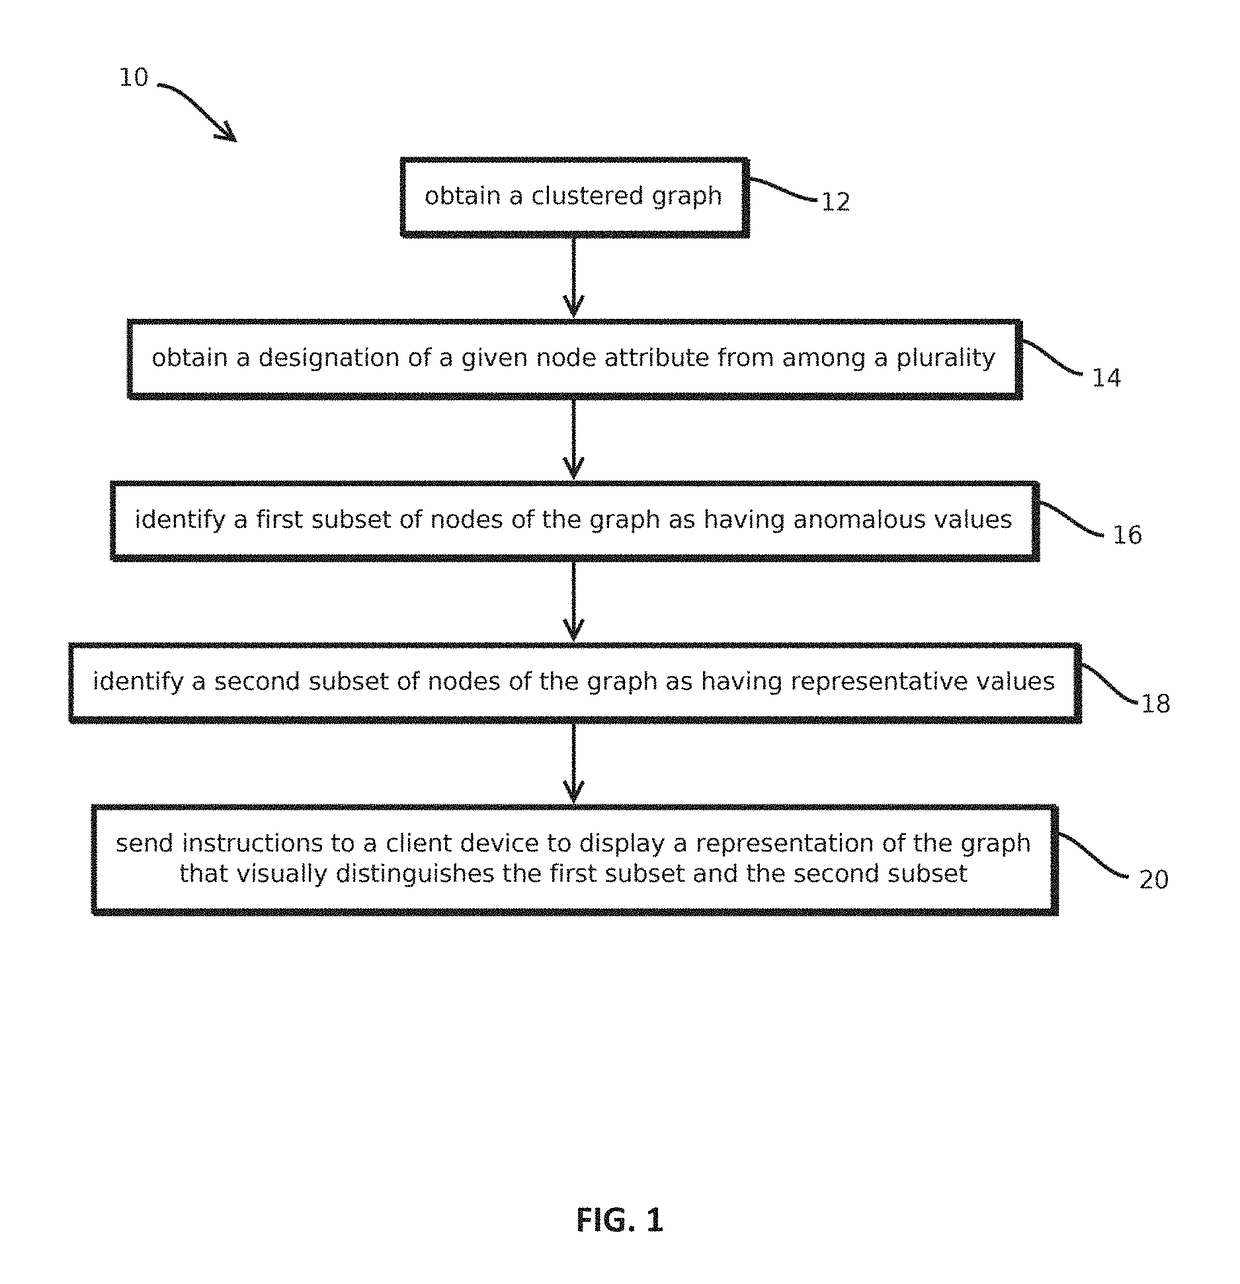
Examples
embodiment 1
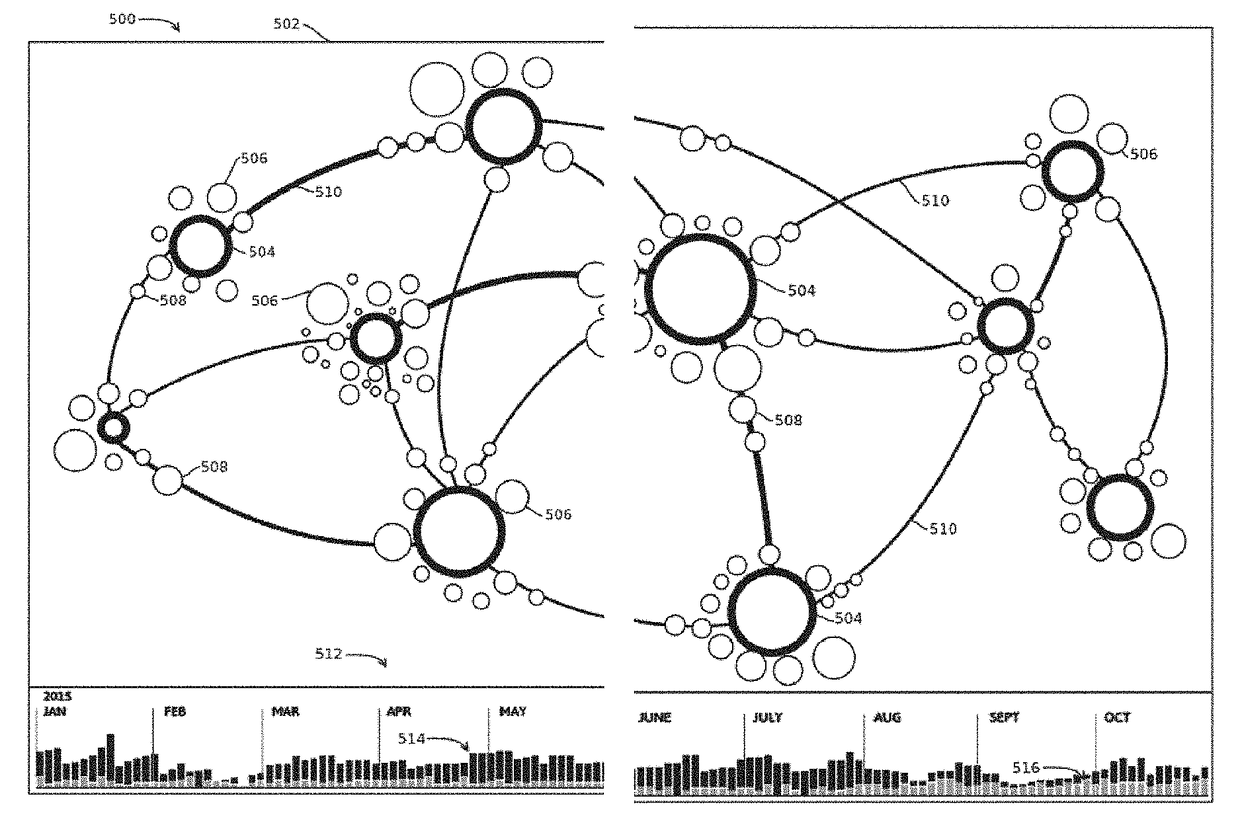
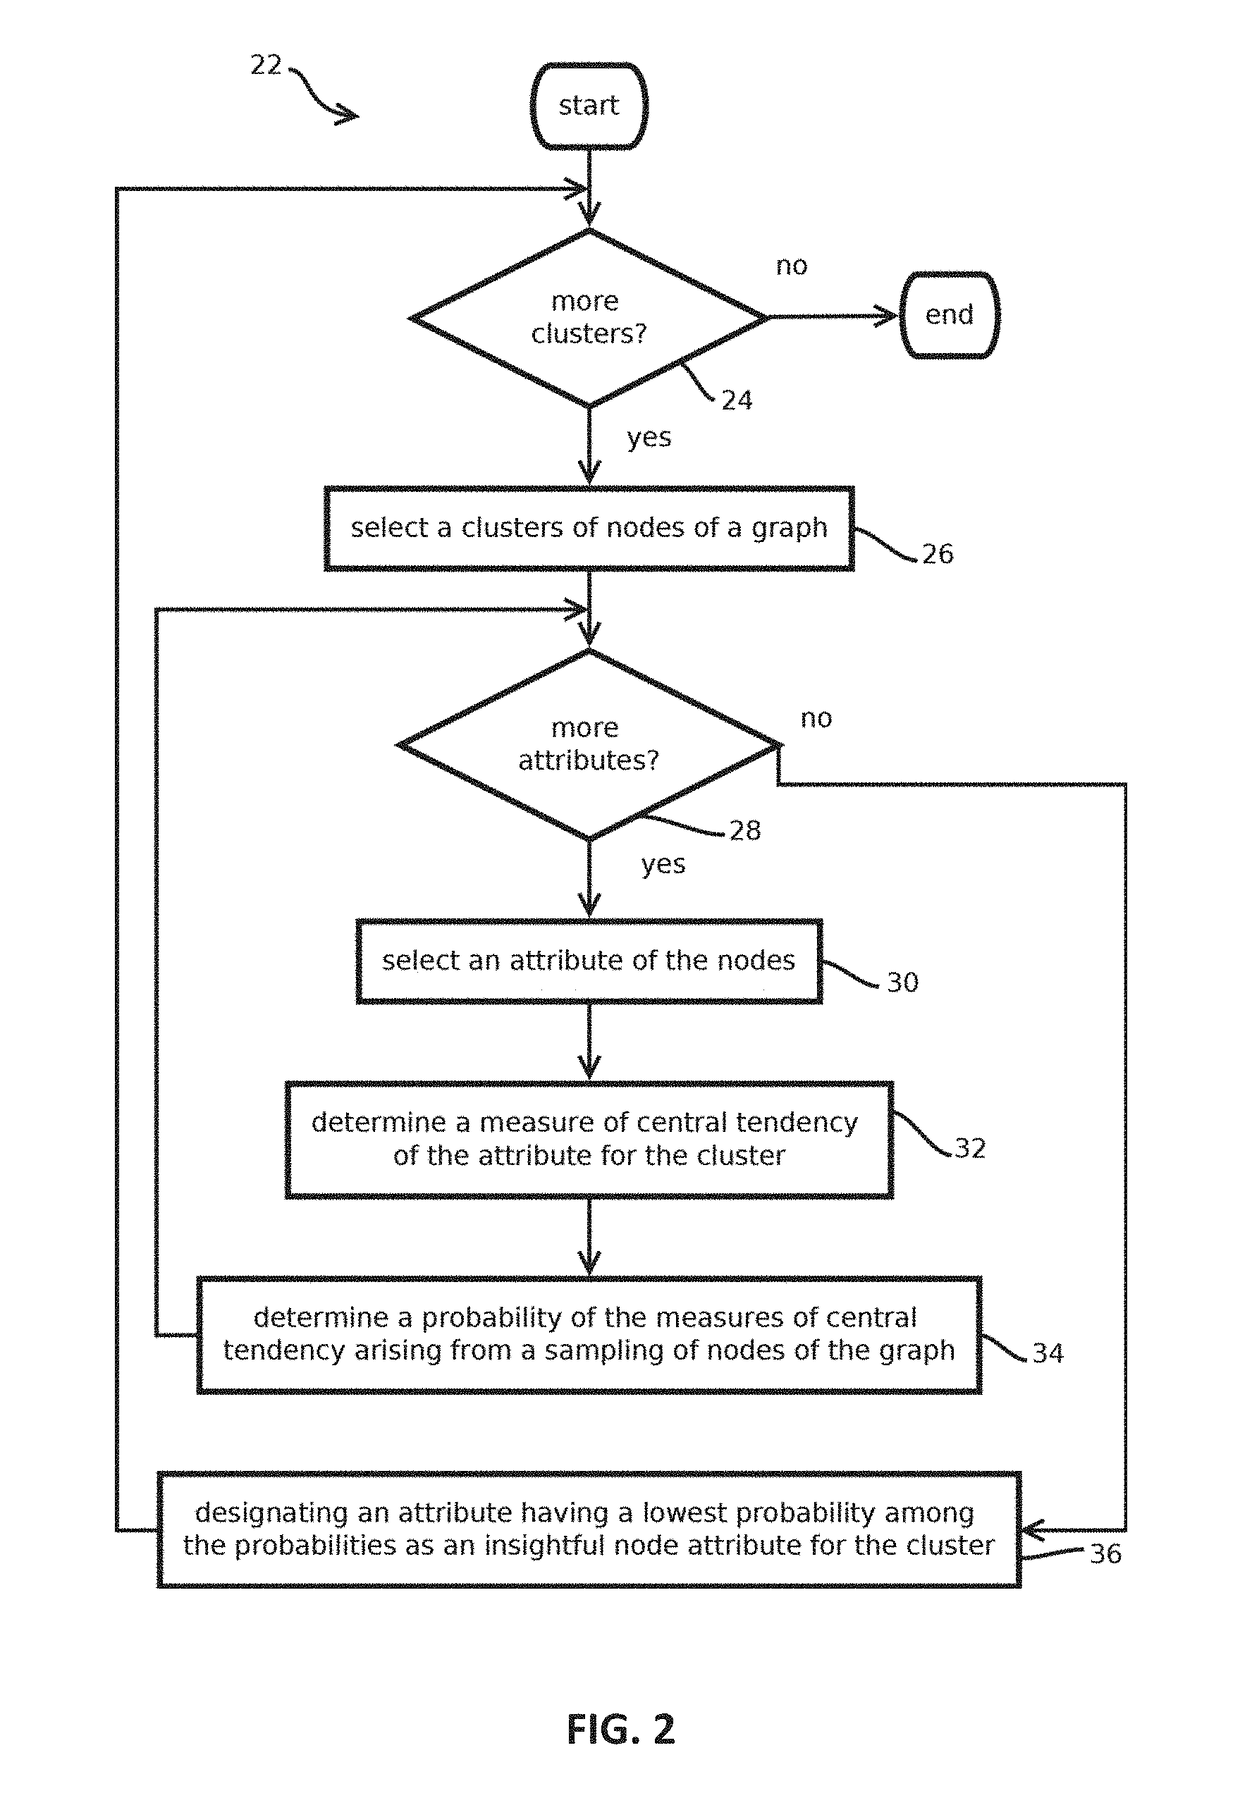
2. The media of embodiment 1, wherein: determining visual attributes of cluster icons comprises determining sizes of the cluster icons, the different cluster icons having different sizes corresponding to amounts of nodes in the corresponding clusters; determining positions of the cluster icons comprises executing a simulation of a physical system in which objects corresponding to the cluster icons apply forces to one another and the forces depend on the distance there between in the graphical visualization; obtaining, for each cluster, a respective subset of nodes comprises selecting nodes in response to determining the selected nodes have representative or anomalous attributes among the nodes in the respective cluster; determining visual attributes of the node icons comprises determining sizes of the node icons based on the attributes that caused the node icons to be selected; and determining positions of the node icons in the graphical visualization comprises executing a simulatio...
embodiment 11
12. The media of embodiment 11, wherein receiving a user selection comprises: receiving a drag-and-drop even with an event handler of the graphical visualization.
13. The media of any of embodiments 1-12, wherein: visual elements of the graphical visualization link a subset of pairwise combinations of the cluster icons; and for a given cluster icon, a given node icon associated with the given cluster icon is positioned within the graphical visualization based on a position of a visual element linking the given cluster icon to another cluster icon.
embodiment 13
14. The media of embodiment 13, wherein: the given node icon corresponds to a document including in natural language text a topic addressed in the cluster corresponding to the other cluster icon, the topic being determined with steps for determining topics of unstructured text; and the given node icon at least partially overlaps with the visual element.
15. The media of any of embodiments 1-14, wherein: the nodes are associated with respective dates; and the graphical visualization includes a histogram of a time-series of the node dates.
PUM
 Abstract
Description
Claims
Application Information