Amplitude spectrum array waterfall plot for shaft vibration analysis of starting-stopping process

A technology of waterfall diagram and amplitude, which is applied in the direction of measuring vibration, vibration measurement in solids, and testing of machine/structural components, etc. It can solve the problems of inconvenient relationship between waterfall diagram and machine state, failure to reflect, and display differences.

Inactive Publication Date: 2009-09-09
NANJING UNIV
View PDF0 Cites 9 Cited by
  • Summary
  • Abstract
  • Description
  • Claims
  • Application Information

AI Technical Summary

Problems solved by technology

The shortcoming of the making method of current start-stop process amplitude spectrum array waterfall diagram is: (1) a waterfall diagram is only made by the signal of one direction, and can only reflect the variation of the rotating shaft vibration on one direction with the rotating speed; (2) ) Correspondingly, any value on the waterfall diagram cannot reflect the true amplitude of the corresponding frequency component of the shaft vibration at the corresponding speed in the entire support section, that is, the radial amplitude; (3) The installation orientation of the two mutually perpendicular sensors on the section with changes (as indicated by the attached figure 2 become attached image 3 ), even if the state of the start-stop process is the same, the waterfall diagram will show differences, which is not convenient to establish the relationship between the waterfall diagram and the machine state

Method used


Image

  • Amplitude spectrum array waterfall plot for shaft vibration analysis of starting-stopping process
  • Amplitude spectrum array waterfall plot for shaft vibration analysis of starting-stopping process
  • Amplitude spectrum array waterfall plot for shaft vibration analysis of starting-stopping process

Examples


specific Embodiment approach

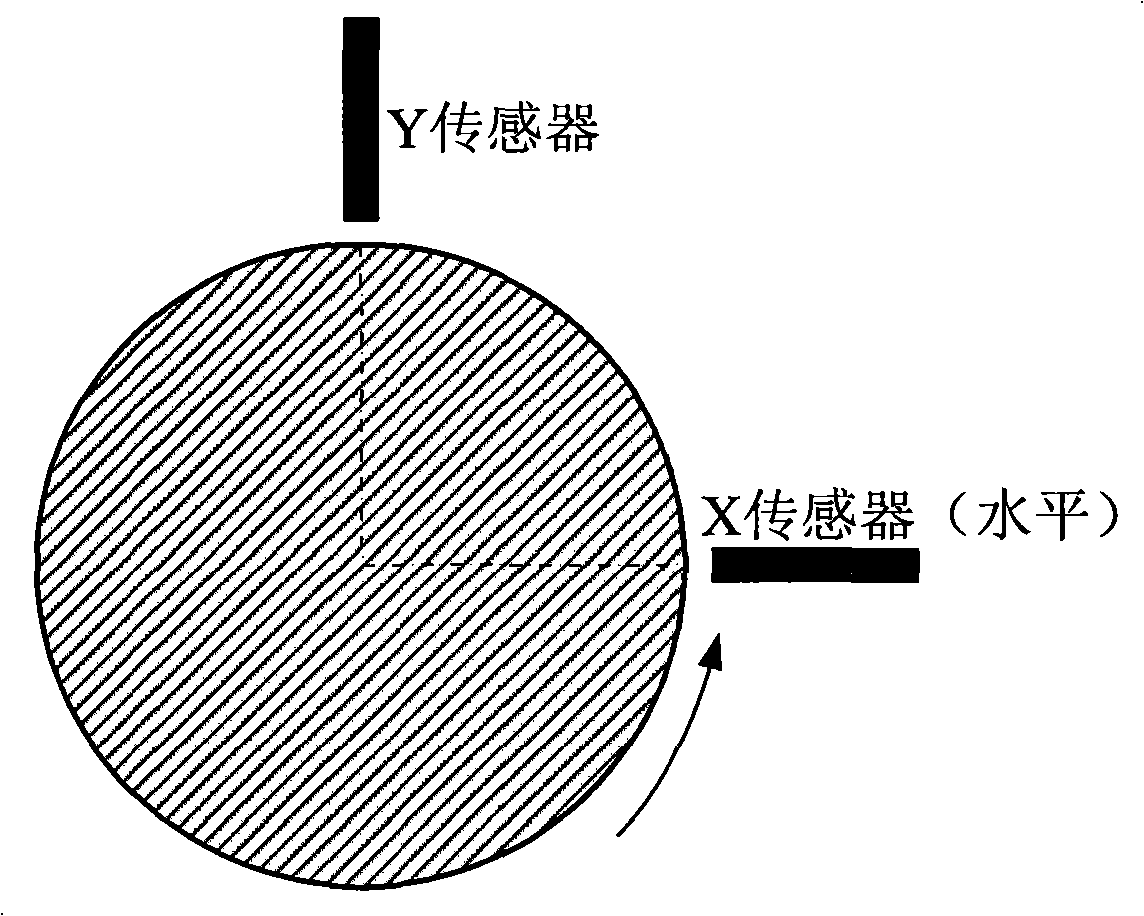
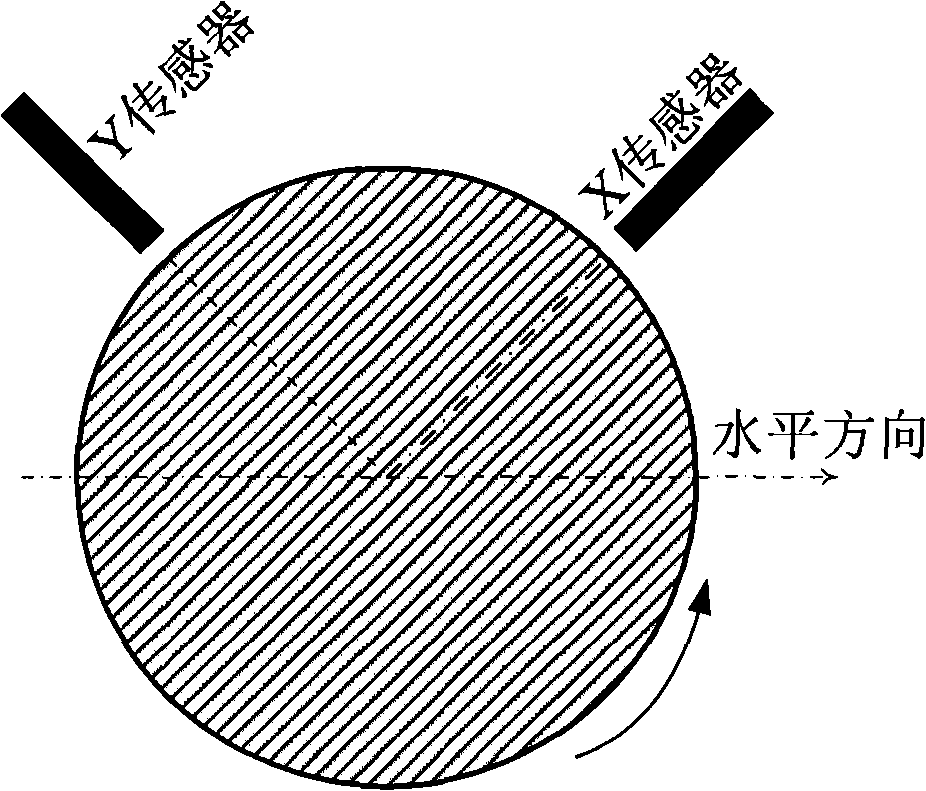
[0035] Simultaneously measure the x and y vibration displacement signal sequences of the rotating shaft at different speeds during the start-up process of a unit. The arrangement of the X and Y sensors is as follows: image 3 shown. The x-signal and y-signal sequences collected synchronously have a sampling rate of 2kHz and the number of sampling points is N=1024. The specific implementation is as follows:

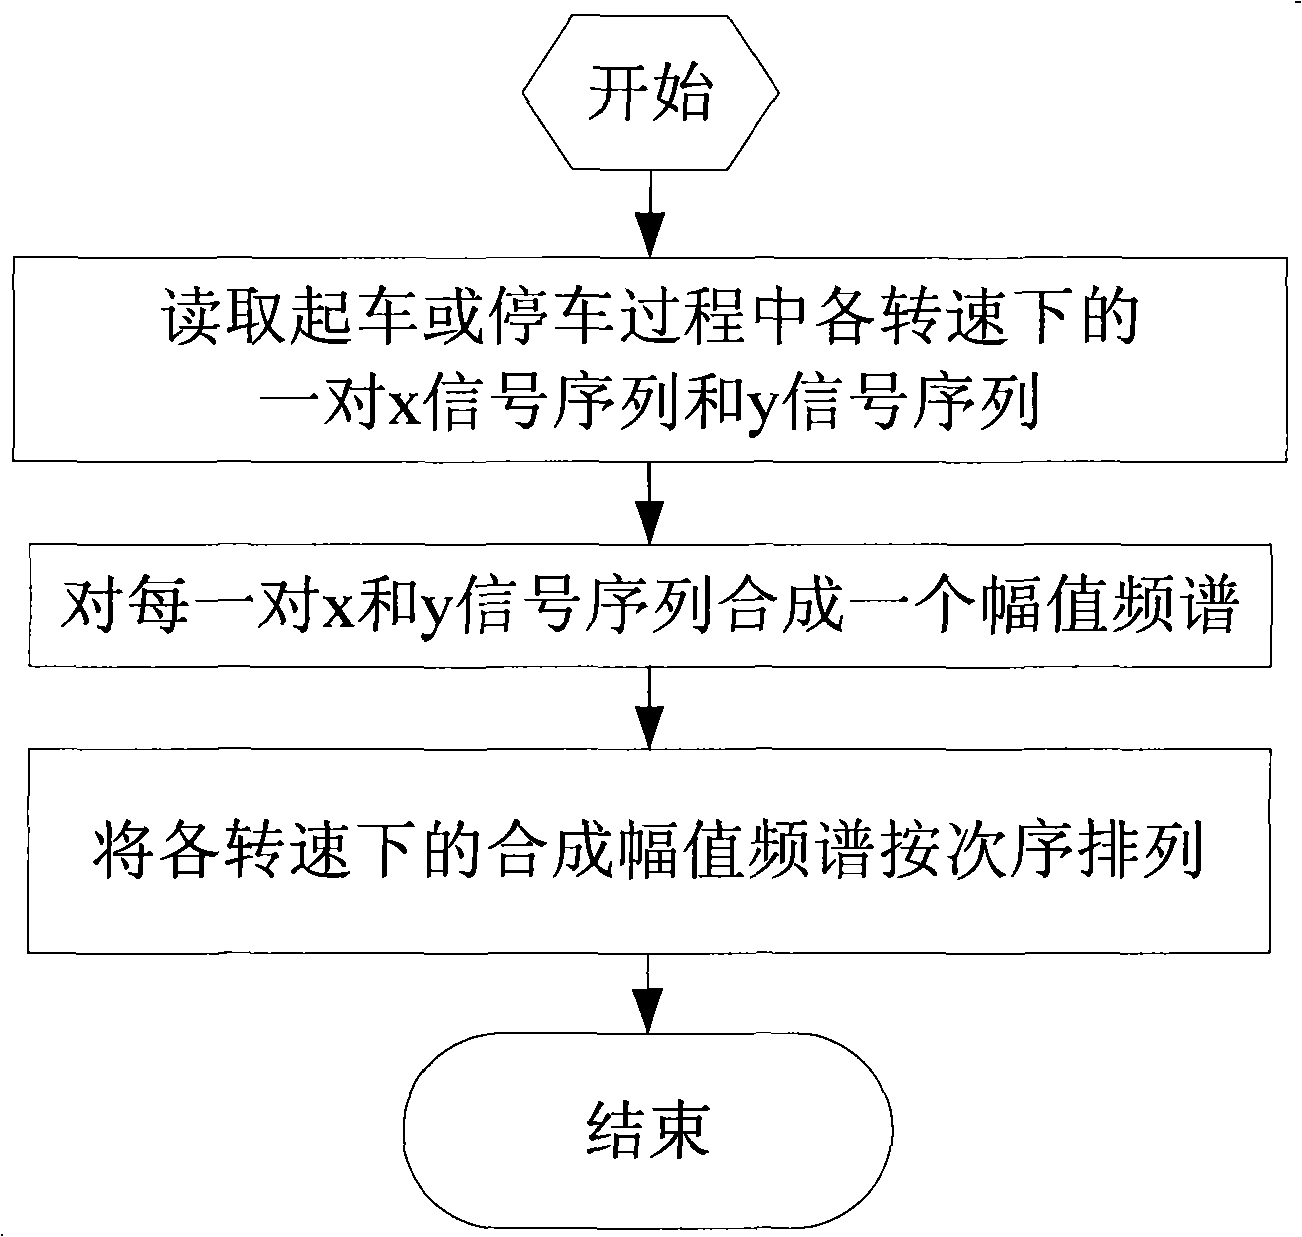
[0036] (1) Read the sequence pair of x signal and y signal at each speed during the starting process, the sampling rate is 2kHz, and the number of sampling points is N=1024.

[0037] (2) Perform fast discrete Fourier transform (FFT) on a pair of x-signal and y-signal sequences at each rotational speed, and the result is a 1024-point complex sequence.

[0038] (3) Based on the fast Fourier transform results of the two signals of x and y, obtain their respective Fourier series, and obtain parameters of a total of N / 2=512 harmonic components from small to large.

[0039] (...


PUM


Abstract

The invention relates to an amplitude spectrum array waterfall plot for shaft vibration analysis of starting-stopping process of equipment. A making method of the waterfall plot comprises three steps: (1) reading a pair of vibration displacement signal arrays, i.e. an x signal array and a y signal array of a rotating shaft in the process of starting or stopping; (2) evaluating a synthesized amplitude spectrum of the x signal array and the y signal array at each rotation speed; and (3) arranging the synthesized amplitude spectrum in rising speed or reducing speed sequence into an array plot which is the made amplitude spectrum array waterfall plot. Any amplitude on the waterfall plot made by the method can represent the true amplitude of the corresponding shaft vibration component in a bearing cross section; the shape of the waterfall plot is only involved with the starting and stopping process and has no relation with the installation position of a sensor; and the invention is convenient for understanding the characteristics of machine states.

Description

technical field [0001] The invention relates to an amplitude spectrum array waterfall diagram used for analyzing shaft vibration in the process of starting and stopping. [0002] For large rotating machines with sliding bearings as rotor supports, such as large motors, centrifugal compressors, etc., an important tool for the analysis and evaluation of the state of these devices is the amplitude of the vibration displacement signal of the shaft during the start and stop of the equipment Spectrum Array Waterfall Diagram (Waterfall Diagram). The waterfall diagram is a vivid statement, and the amplitude spectrum array waterfall diagram is actually an array diagram formed by arranging the amplitude spectrums of the displacement signals at various speeds during the starting or stopping process in order. [0003] Usually, two vibration displacement sensors perpendicular to each other pointing to the center of the rotating shaft are installed at a supporting section of the rotating s...

Claims


Application Information

Patent Timeline
Patent Type & Authority Applications(China)
IPC IPC(8): G01M19/00G01H1/00G01M99/00
Inventor 刘红星肇莹郑威史瑞超
Owner NANJING UNIV
Why Eureka
Try Eureka