Conventional logging information fusion visualization method and system thereof

A well logging and conventional technology, applied in the field of well information focusing and fusion visualization method and system, to achieve the effect of improving visual effects and improving information multi-solution

Active Publication Date: 2013-03-13
PETROCHINA CO LTD
View PDF3 Cites 0 Cited by
  • Summary
  • Abstract
  • Description
  • Claims
  • Application Information

AI Technical Summary

Problems solved by technology

[0004] The purpose of the embodiments of the present invention is to provide a calibration standardization method on the basis of geological logging sensitivity analysis by using the rich information recorded by conventional logging that can reflect complex geological problems, and realize logging information focusing, information fusion, and multidimensional logging. The one-dimensional visualization of the fusion of well information provides a fast and effective method and system for effectively mining conventional logging information to solve complex geological problems

Method used


Image

  • Conventional logging information fusion visualization method and system thereof
  • Conventional logging information fusion visualization method and system thereof
  • Conventional logging information fusion visualization method and system thereof

Examples


Embodiment 1

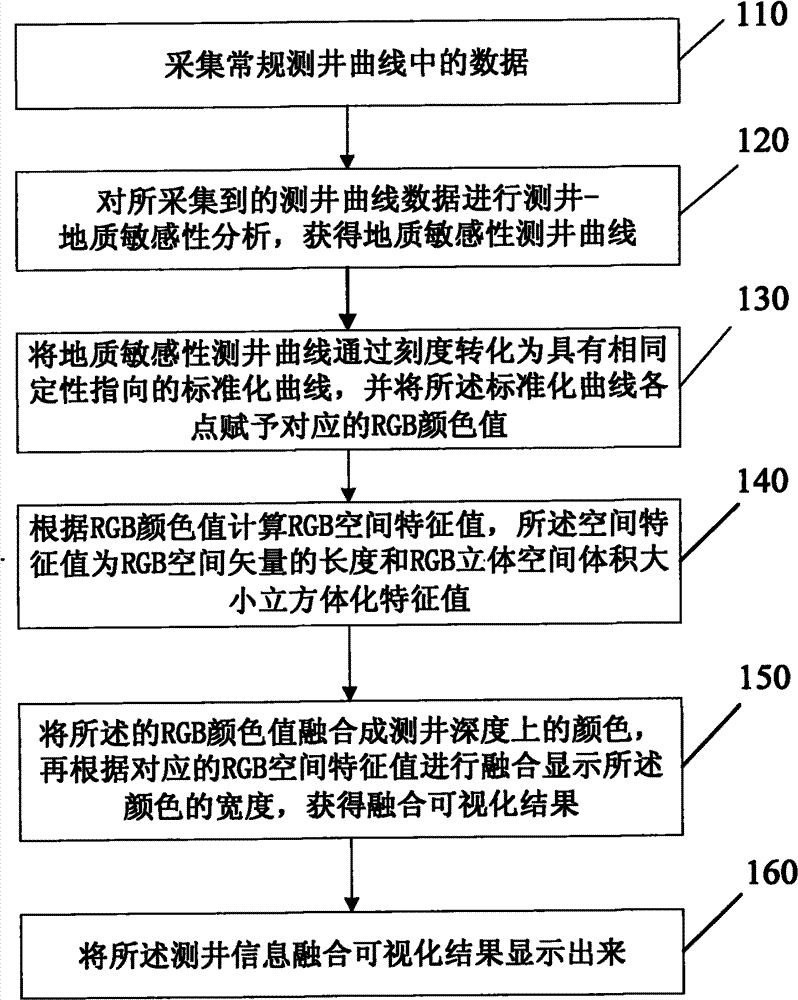
[0019] The embodiment of the present invention provides a conventional well logging information fusion visualization method, such as figure 1 As shown, the method includes:

[0020] Step 110: collecting data in conventional well logging curves;

[0021] This step is the input of conventional well logging curve data. Conventional well logging curves refer to one-dimensional curves recorded along the depth of the well, such as well completion logging curves such as lithology, physical properties, and electrical properties, and monitoring logging curves such as temperature, pressure, and flow rate. Well curve and other information; specific conventional lithology curves include natural gamma ray, spontaneous potential, and borehole diameter; conventional porosity curves include acoustic waves, density, and compensated neutrons; resistivity curves include deep resistivity, medium resistivity, and shallow resistivity; Physical measurement information such as pressure and temperatu...

Embodiment 2

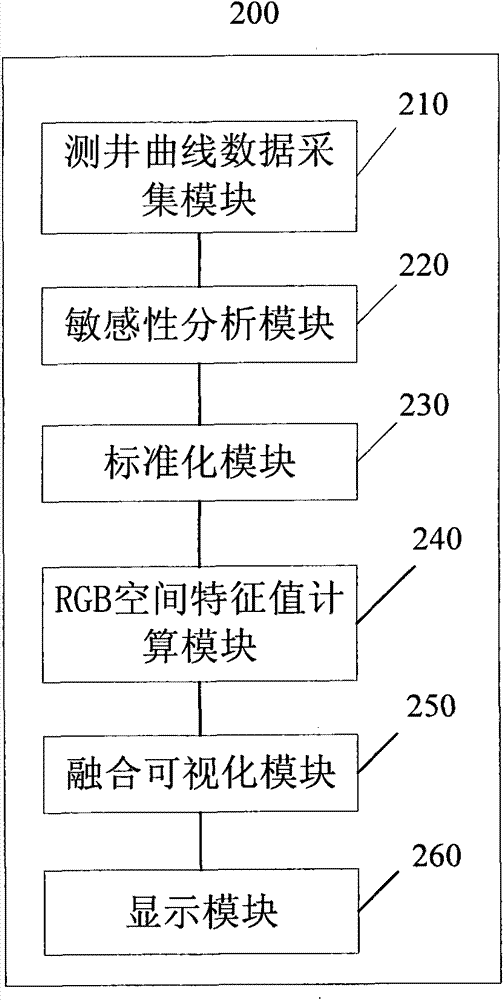
[0056] An embodiment of the present invention provides a conventional well logging information fusion visualization system, such as figure 2 As shown, the system 200 includes:

[0057] Well logging curve data acquisition module 210 is used to collect data in conventional well logging curves; conventional well logging curves refer to one-dimensional curves taken along the well depth, such as lithology (natural gamma ray, spontaneous potential, borehole diameter), Physical properties (acoustic time difference, density, compensated neutrons), electrical properties (deep resistivity, medium resistivity, shallow resistivity) and other well completion logging, temperature, pressure, flow and other monitoring and logging information;

[0058] The sensitivity analysis module 220 is used to perform logging-geological sensitivity analysis on the collected logging curve data to obtain geologically sensitive logging curve combinations; according to the research on geological problems, se...


PUM


Abstract

The invention provides a conventional logging information fusion visualization method and a system thereof. The method comprises the following steps that: data in a conventional logging curve is acquired; logging-geologic sensitivity analysis is carried out on the acquired data of the logging curve, and a geologic sensitivity logging curve is obtained; the geologic sensitivity logging curve is converted into a standardized curve with same qualitative orientation by scales, and all points of the standardized curve are endowed with corresponding RGB color values; according to the RGB color values, RGB space characteristic values are calculated, and the RGB space characteristic values are the length of RGB space vector and a visual cubic characteristic value of RGB cubic space volume size; the RGB color values are fused into the colors on logging depth, the widths of the fused colors are set according to the corresponding RGB space characteristic values, and a fused visualization result is obtained; and the fused visualization result of the logging information is displayed. The invention can enhance visual effect by a visualization technology and effectively improve information ambiguity of the single logging curve.

Description

technical field [0001] The invention relates to well logging information fusion processing and drawing display technology, in particular to a well information focusing fusion visualization method and system that can be used in the technical field of well logging geological evaluation. Background technique [0002] With the deepening of oil and gas exploration and development, the importance of exploration and development of oil and gas reservoirs with complex geological conditions has become increasingly prominent, and the identification and evaluation of oil and gas with low porosity, low permeability, low abundance and complex lithology has become increasingly difficult. Conventional logging evaluation methods often establish interpretation models based on logging information such as lithology, electrical properties, and physical properties for interpretation and evaluation. Methods such as crossplot technology, optimization technology, and fuzzy recognition technology are...

Claims


Application Information

Patent Timeline
Patent Type & Authority Patents(China)
IPC IPC(8): E21B47/00E21B47/002G01V1/40E21B49/00
Inventor 陈福利
Owner PETROCHINA CO LTD
Why Eureka
Try Eureka