Radar chart representation method for early warning and assessment index of power system

A power system and evaluation index technology, which is applied in the fields of electrical digital data processing, special data processing applications, instruments, etc., and can solve the problem of lack of description of the overall operating state indicators of the radar chart.

Active Publication Date: 2014-03-19
INTEGRATED ELECTRONICS SYST LAB
View PDF1 Cites 0 Cited by
  • Summary
  • Abstract
  • Description
  • Claims
  • Application Information

AI Technical Summary

Problems solved by technology

[0007] At present, whether it is a general-purpose radar chart or a dedicated radar chart, it only shows multiple relevant indica

Method used


Image

  • Radar chart representation method for early warning and assessment index of power system
  • Radar chart representation method for early warning and assessment index of power system
  • Radar chart representation method for early warning and assessment index of power system

Examples


Embodiment Construction

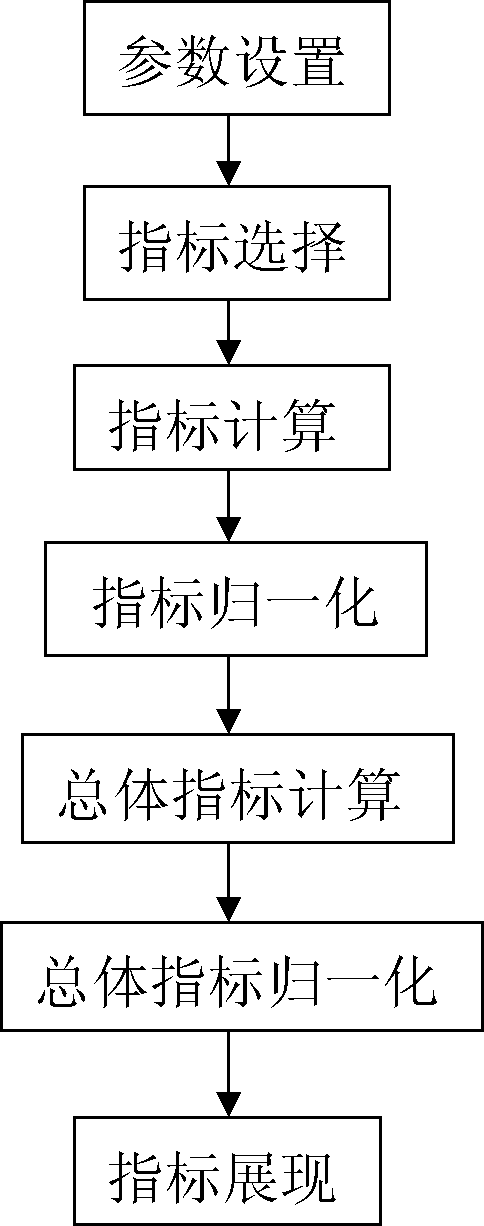
[0037] Such as figure 1 As shown, the present invention includes the following steps:

[0038] 1. Parameter setting: Configure the maximum value of the radar chart, scanning period, early warning limit and warning limit and other parameters.

[0039] 2. Index selection: configure the composition of the overall index.

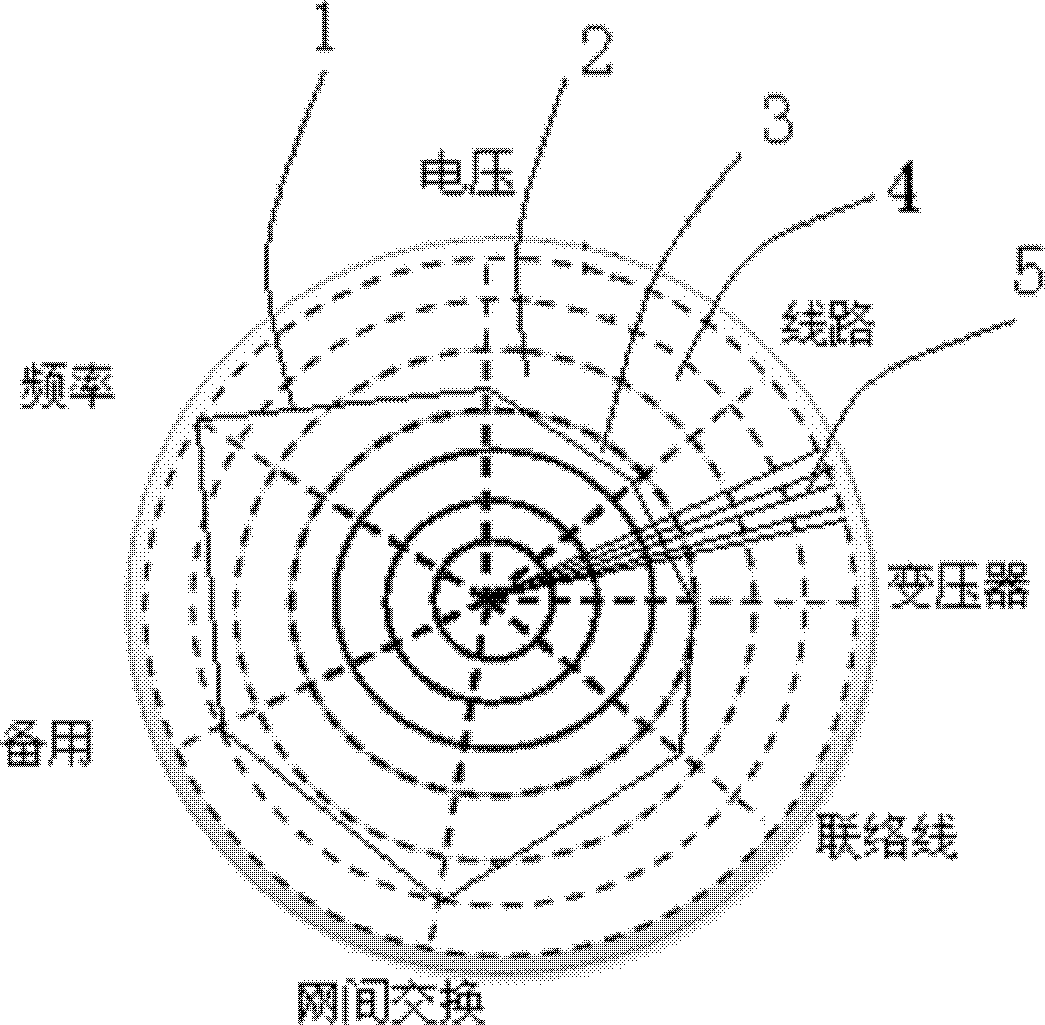
[0040] The radar chart shows a set of relevant indicators that are used to characterize a certain state of the power grid. For example, the running state of the power grid can be integrated by indicators such as voltage, line, transformer, standby, frequency, exchange power between grids, and tie-line power. description.

[0041] The index of the system includes the overall index and the component indexes that make up the overall index. For example, the operating status of the power grid is the overall index, which is an index vector; while the voltage, line, transformer, reserve, frequency, and inter-network exchange are the components in the vector. The index is a n...


PUM


Abstract

The invention discloses a radar chart representation method for early warning and assessment indexes of a power system, which comprises the following steps of: radar chart parameter setting; power system index selection, including overall index selection and component index selection of a radar chart; component index computation by adopting a nonlinear monotone increasing primary function; component index normalization; overall index computation, including adopting a primary function similar to the step two to construct the overall operation index of the radar chart; overall index normalization, including normalizing an overall index into an interval of [0, 100]; and index presentation, including presenting component indexes on the same radar chart. By conducting multidimensional index normalization to index states and overall operation state indexes to generate general indexes suitable for the presentation of the radar chart, the operation conditions of a power grid are presented intuitively, scheduling personnel can know the heath condition of the power grid on the whole and therefore the power grid can be monitored from the top to the bottom.

Description

Technical field [0001] The invention belongs to the field of power system dispatching automation, in particular to a radar chart display method of power system early warning and evaluation indicators. Background technique [0002] With the continuous expansion of the scale of the power system and the increasing complexity of dispatching services, more intelligent requirements are put forward for the power dispatch automation system, which are reflected in: [0003] 1. Power dispatch automation system: With the development of society and technology, the scale of power grids under the jurisdiction of dispatching departments at all levels is getting larger and larger, and more and more information is collected. There is an urgent need for a set of early warning and evaluation systems to monitor the entire The power grid conducts top-down intelligent monitoring. [0004] 2. Online early warning: Online early warning is an important part of the dispatch automation system. It mainly r...

Claims


Application Information

Patent Timeline
IPC IPC(8): G06F19/00G06Q50/06
Inventor 张东院王建功冷永杰
Owner INTEGRATED ELECTRONICS SYST LAB
Why Eureka
Try Eureka