

Network topology display method and device
A technology of network topology and display method, applied in the field of communication, can solve the problems of inability to compare related device status and data, low rendering efficiency, etc., to achieve the effect of improving efficiency and user experience
- Summary
- Abstract
- Description
- Claims
- Application Information
AI Technical Summary
Problems solved by technology
Method used
Image

Examples
Embodiment 1
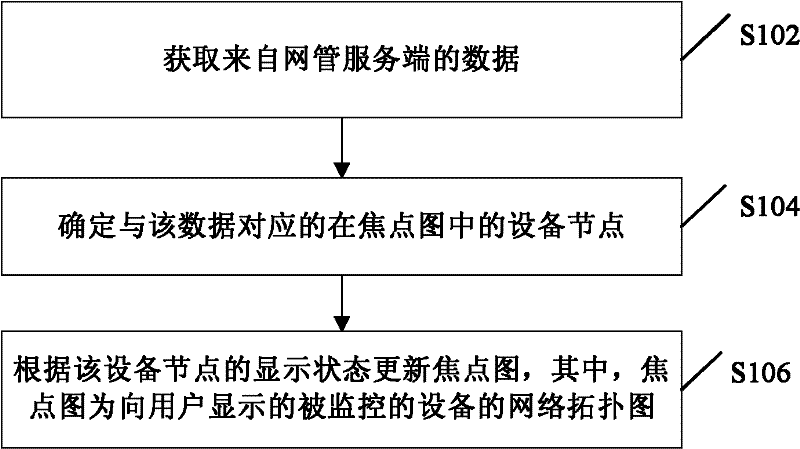
[0050] This embodiment provides a network management user with an efficient method for monitoring network equipment, and adopts hyperbolic tree technology to realize the visualization of equipment nodes, which can deploy all network equipment nodes in a limited area; increase expansion, Shrink function. On the basis of the hyperbolic tree graph, optimize the relationship between the visible nodes and the data model, asynchronously update the real-time data of the visible nodes, and draw local graphs, so as to achieve efficient state rendering and real-time data monitoring of the visible nodes Function.
[0051] Specifically, this embodiment realizes the visualization of a large node tree according to the hyperbolic tree technology theory. Using the "focus + context" detail optimization technology, the mouse drags the node, and the positions of all nodes change. The view focus occupies a larger display area, which can display the relationship between the node in focus and its ...
Embodiment 2
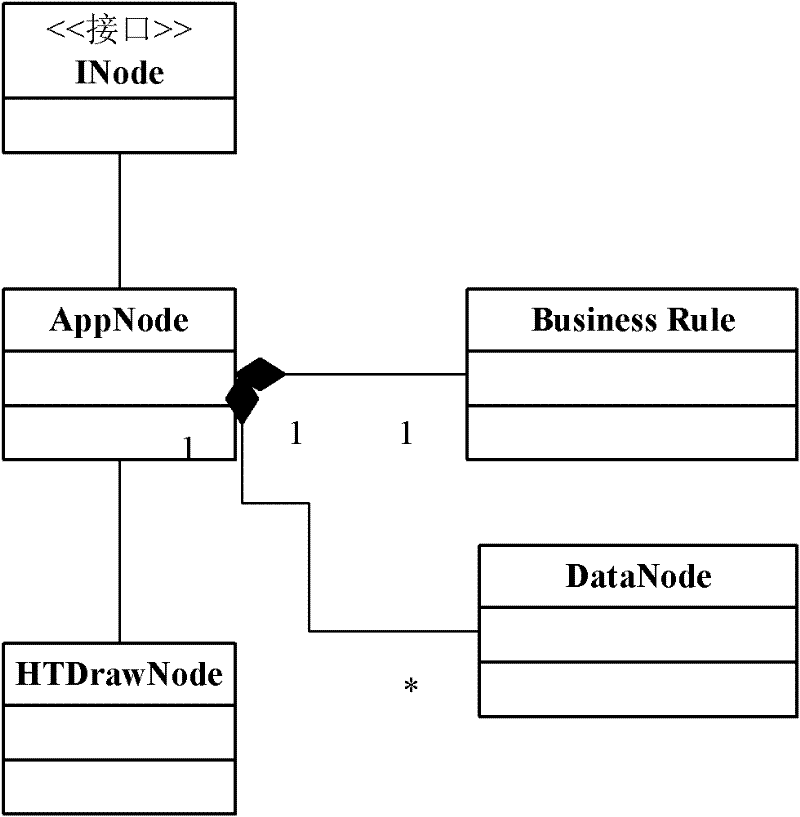
[0057] image 3 is a schematic diagram of a data model of topology monitoring according to Embodiment 2 of the present invention, such as image 3 As shown, the node tree structure and data model structure are defined. For example, INode is an interface, which is used to configure methods for obtaining node ID, name, status, business rule ID, subtree information, and data node list; AppNode is an application node, which is used to implement the INode interface and can be expanded; HTDrawNode is the The visible nodes of are corresponding to the application nodes one by one, and are used to configure the display characteristics of the application nodes, which can include node ID, icon, name, color, size, coordinates, whether to display in the graph, etc.; DataNode is a data node, used It is used to configure the data model; BusinessRule is a business rule, which is used to set processing rules for node status changes, such as alarms, performance, network topology, etc., which c...
Embodiment 3
[0062] This embodiment provides a method for rendering a partial graph when the network topology is updated. Figure 4 is a schematic diagram of the topology monitoring effect according to Embodiment 3 of the present invention, as shown in Figure 4 As shown, the network topology diagram of the monitoring device in this embodiment is displayed in the form of a node tree. During the implementation process, in order to illustrate the rendering effect of the partial diagram, different colors can be marked for the nodes. When it is calculated according to the business rules of the node that the state of the node has changed, color processing can also be added in order to clearly identify and highlight the dynamic effect.
[0063] The following examples illustrate the rendering methods of partial images in different scenarios.
[0064] Scenario 1: After the network management server data is updated in real time, a matching node is found according to the data model. If the node is ...
PUM
 Abstract
Description
Claims
Application Information