Fault mode visual method based on three-dimensional model of product

A failure mode and three-dimensional model technology, applied in special data processing applications, instruments, electrical digital data processing, etc., can solve problems such as difficulty in understanding the specific location of product failure modes, low acquisition efficiency, and inability to intuitively understand the distribution of failure modes

Active Publication Date: 2012-11-28
BEIHANG UNIV
View PDF2 Cites 30 Cited by
  • Summary
  • Abstract
  • Description
  • Claims
  • Application Information

AI Technical Summary

Problems solved by technology

However, in conventional failure mode analysis work, such as failure mode and effects analysis (FMEA), the results often exist in the form of textual materials such as reports, and there are some disadvantages in the understanding and analysis of fault information in textual form.
This is because in the process of failure mode analysis, the previous analysis information mainly comes from some product designs, process data, test procedures, failure mode eff

Method used


Image

  • Fault mode visual method based on three-dimensional model of product
  • Fault mode visual method based on three-dimensional model of product
  • Fault mode visual method based on three-dimensional model of product

Examples


Embodiment Construction

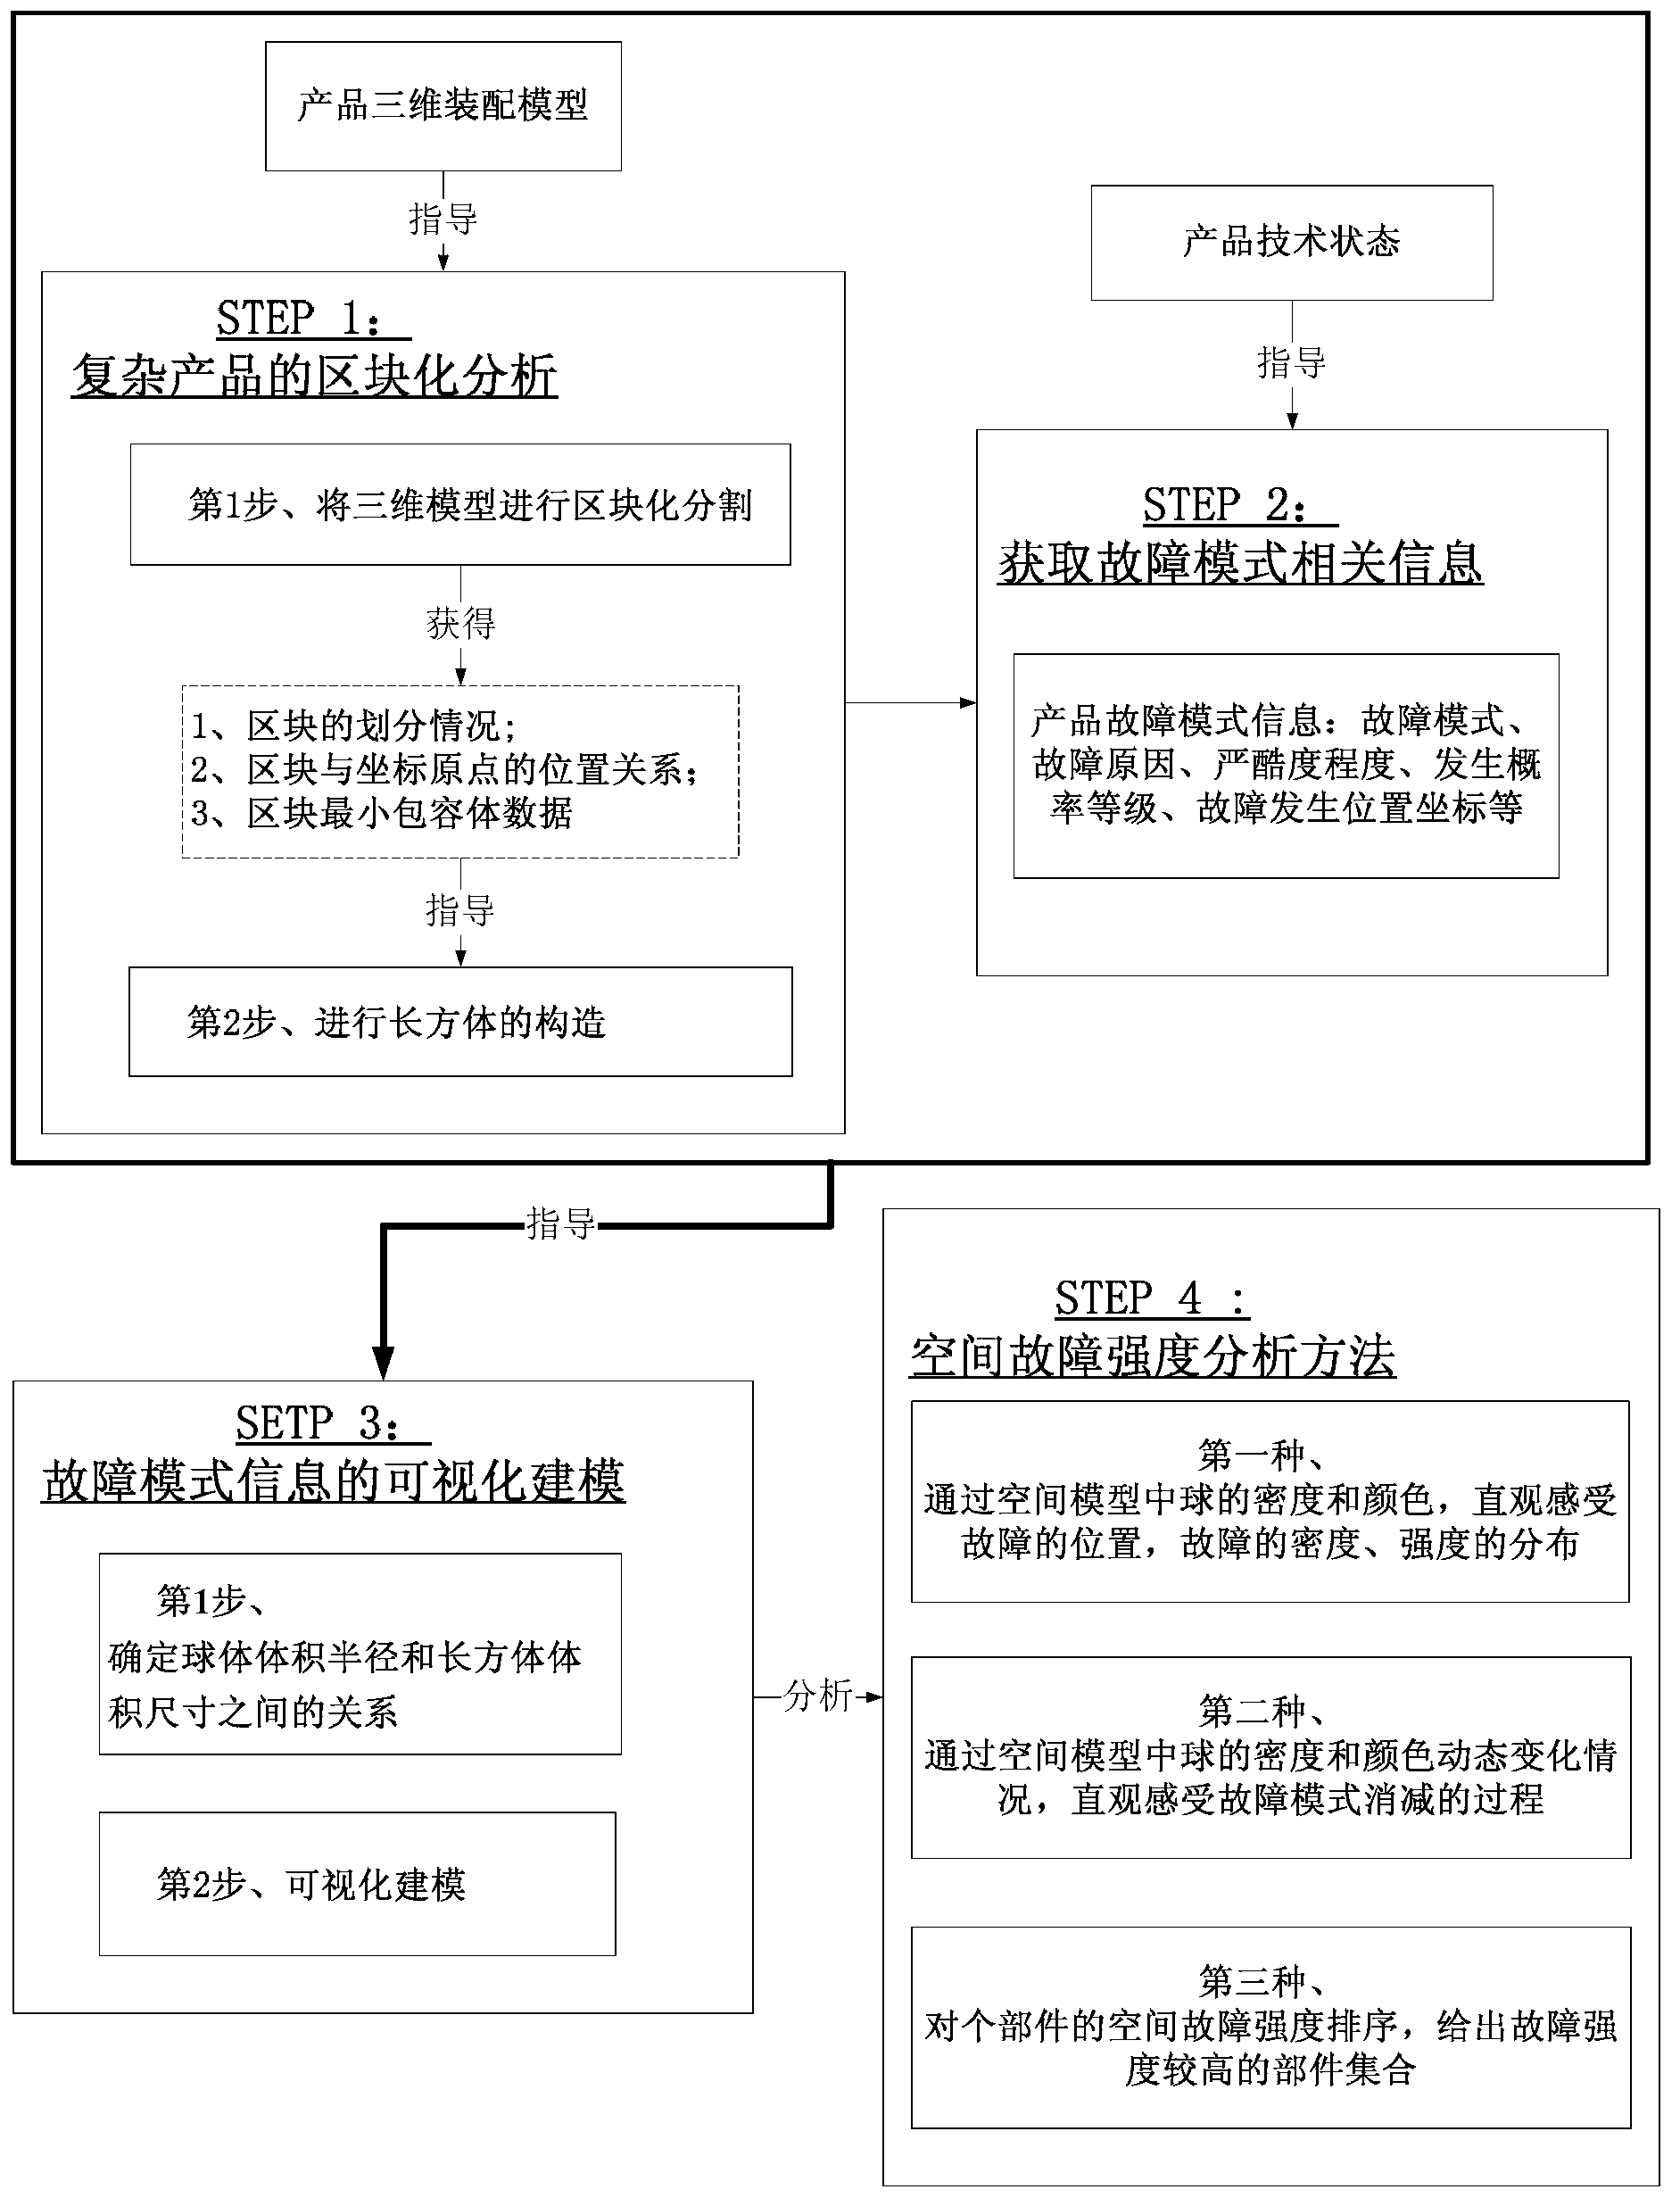
[0113] See Figure 8 , a failure mode visualization method based on a product three-dimensional model of the present invention, it is carried out according to the following four steps:

[0114] Step 1: Block analysis of complex products

[0115] Firstly, on the basis of the 3D assembly model of the product, the lowest agreed level of failure mode analysis is determined, and the 3D model is divided into blocks according to the lowest agreed level product, which are named block 1, block 2, and block 3 respectively. ...and so on. According to the actual situation of the product in space, the position coordinates of the center of each block relative to the coordinate origin (0,0,0) of the 3D model can be obtained respectively, that is, the coordinates of block 1 are (X 1 , Y 1 ,Z 1 ), the coordinates of block 2 are (X 2 , Y 2 ,Z 2 ), ... and so on.

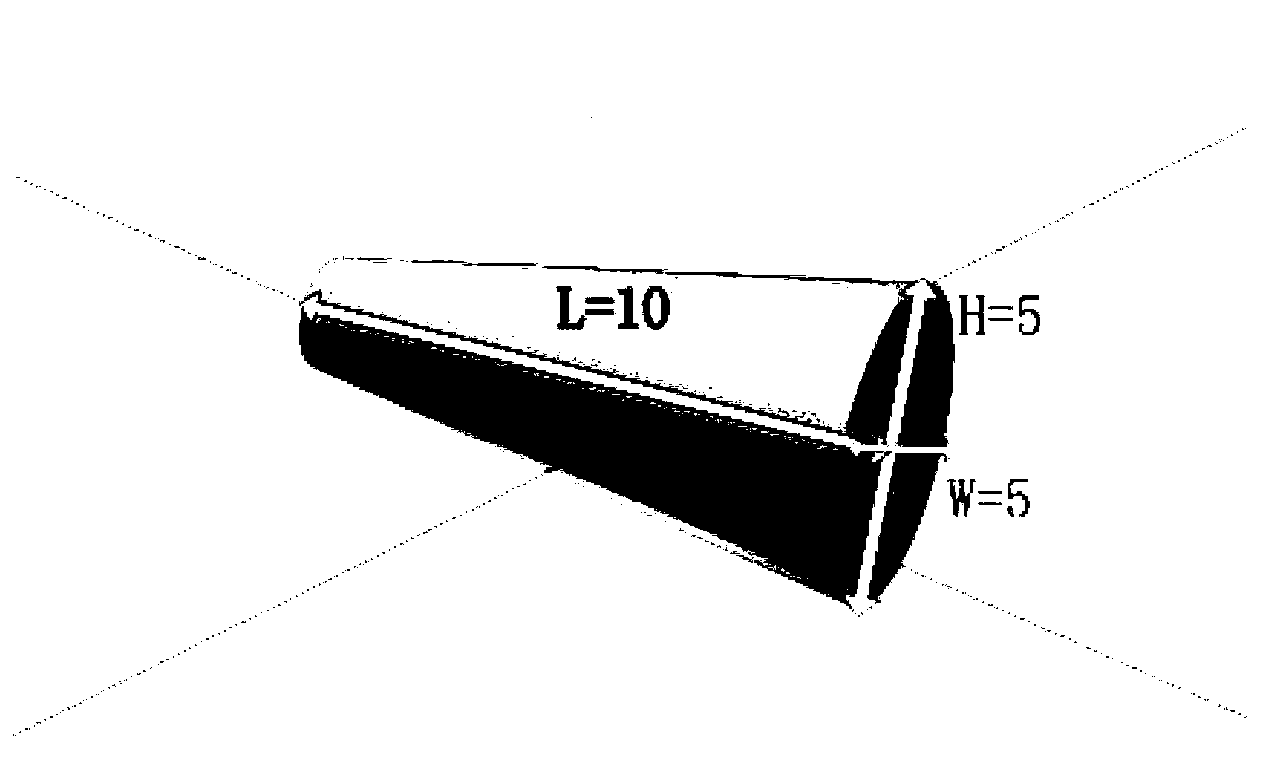
[0116] Then, carry out the construction of cuboid. First, a large cuboid needs to be established to represent the entire sy...


PUM


Abstract

The invention discloses a fault mode visualization method based on a three-dimensional model of a product. The method comprises four steps of: step 1. carrying out blocked partitioning and cuboid configuration on the three-dimensional model aiming at a complex product; step 2. collecting relevant information of a fault mode, analyzing a potential fault mode and a fault reason of the complex product and component parts at certain one technical state, obtaining an harsh degree and an occurrence probability grade, and obtaining a space coordinate of a fault mode generating position relative to the origin of coordinates and design and improvement measures corresponding to the fault mode according to the position of the product in a three-dimensional coordinate; step 3. carrying out visual modeling on the fault mode information; and step 4. carrying out a method for analyzing space fault intensity. The space fault intensity is defined, members with relatively high fault intensity are determined, and thus the fault is eliminated by designing corresponding improvement measures and use compensation measures and repairing assurance resource information, and finally the effectiveness verification is implemented. The method has a good application prospect in the technical field of product design.

Description

technical field [0001] The invention relates to a failure mode visualization method based on a product three-dimensional model during the realization process of complex product reliability design. This method uses information visualization technology to visualize the failure modes and their impact analysis results, which were originally limited to text reports, and integrate them into the three-dimensional model of the product, thereby providing clear and intuitive information for the display and decision-making of reliability design results, and targeting at faults. Mode information takes corresponding countermeasures and improvement measures in the complex product RMS realization process. The invention belongs to the technical field of product design. Background technique [0002] Accurate identification and analysis of faults is the basis for reliability design. However, in conventional failure mode analysis work, such as failure mode and effects analysis (FMEA), the re...

Claims


Application Information

Patent Timeline
IPC IPC(8): G06F17/30
Inventor 周璇任羿杨德真刘林林李静吕欣琦
Owner BEIHANG UNIV
Why Eureka
Try Eureka