Display control apparatus and method
A technology of display control and display position, which is applied in the direction of digital output to display equipment, image data processing, voice analysis, etc., and can solve problems such as inability to have multiple attributes
- Summary
- Abstract
- Description
- Claims
- Application Information
AI Technical Summary
Problems solved by technology
Method used
Image

Examples
Embodiment Construction
[0021]
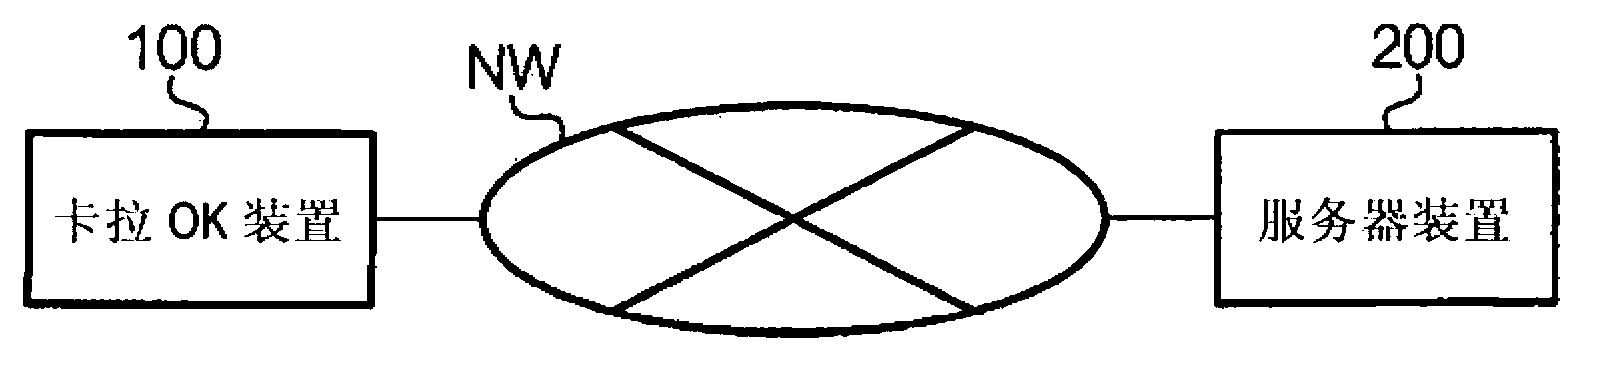
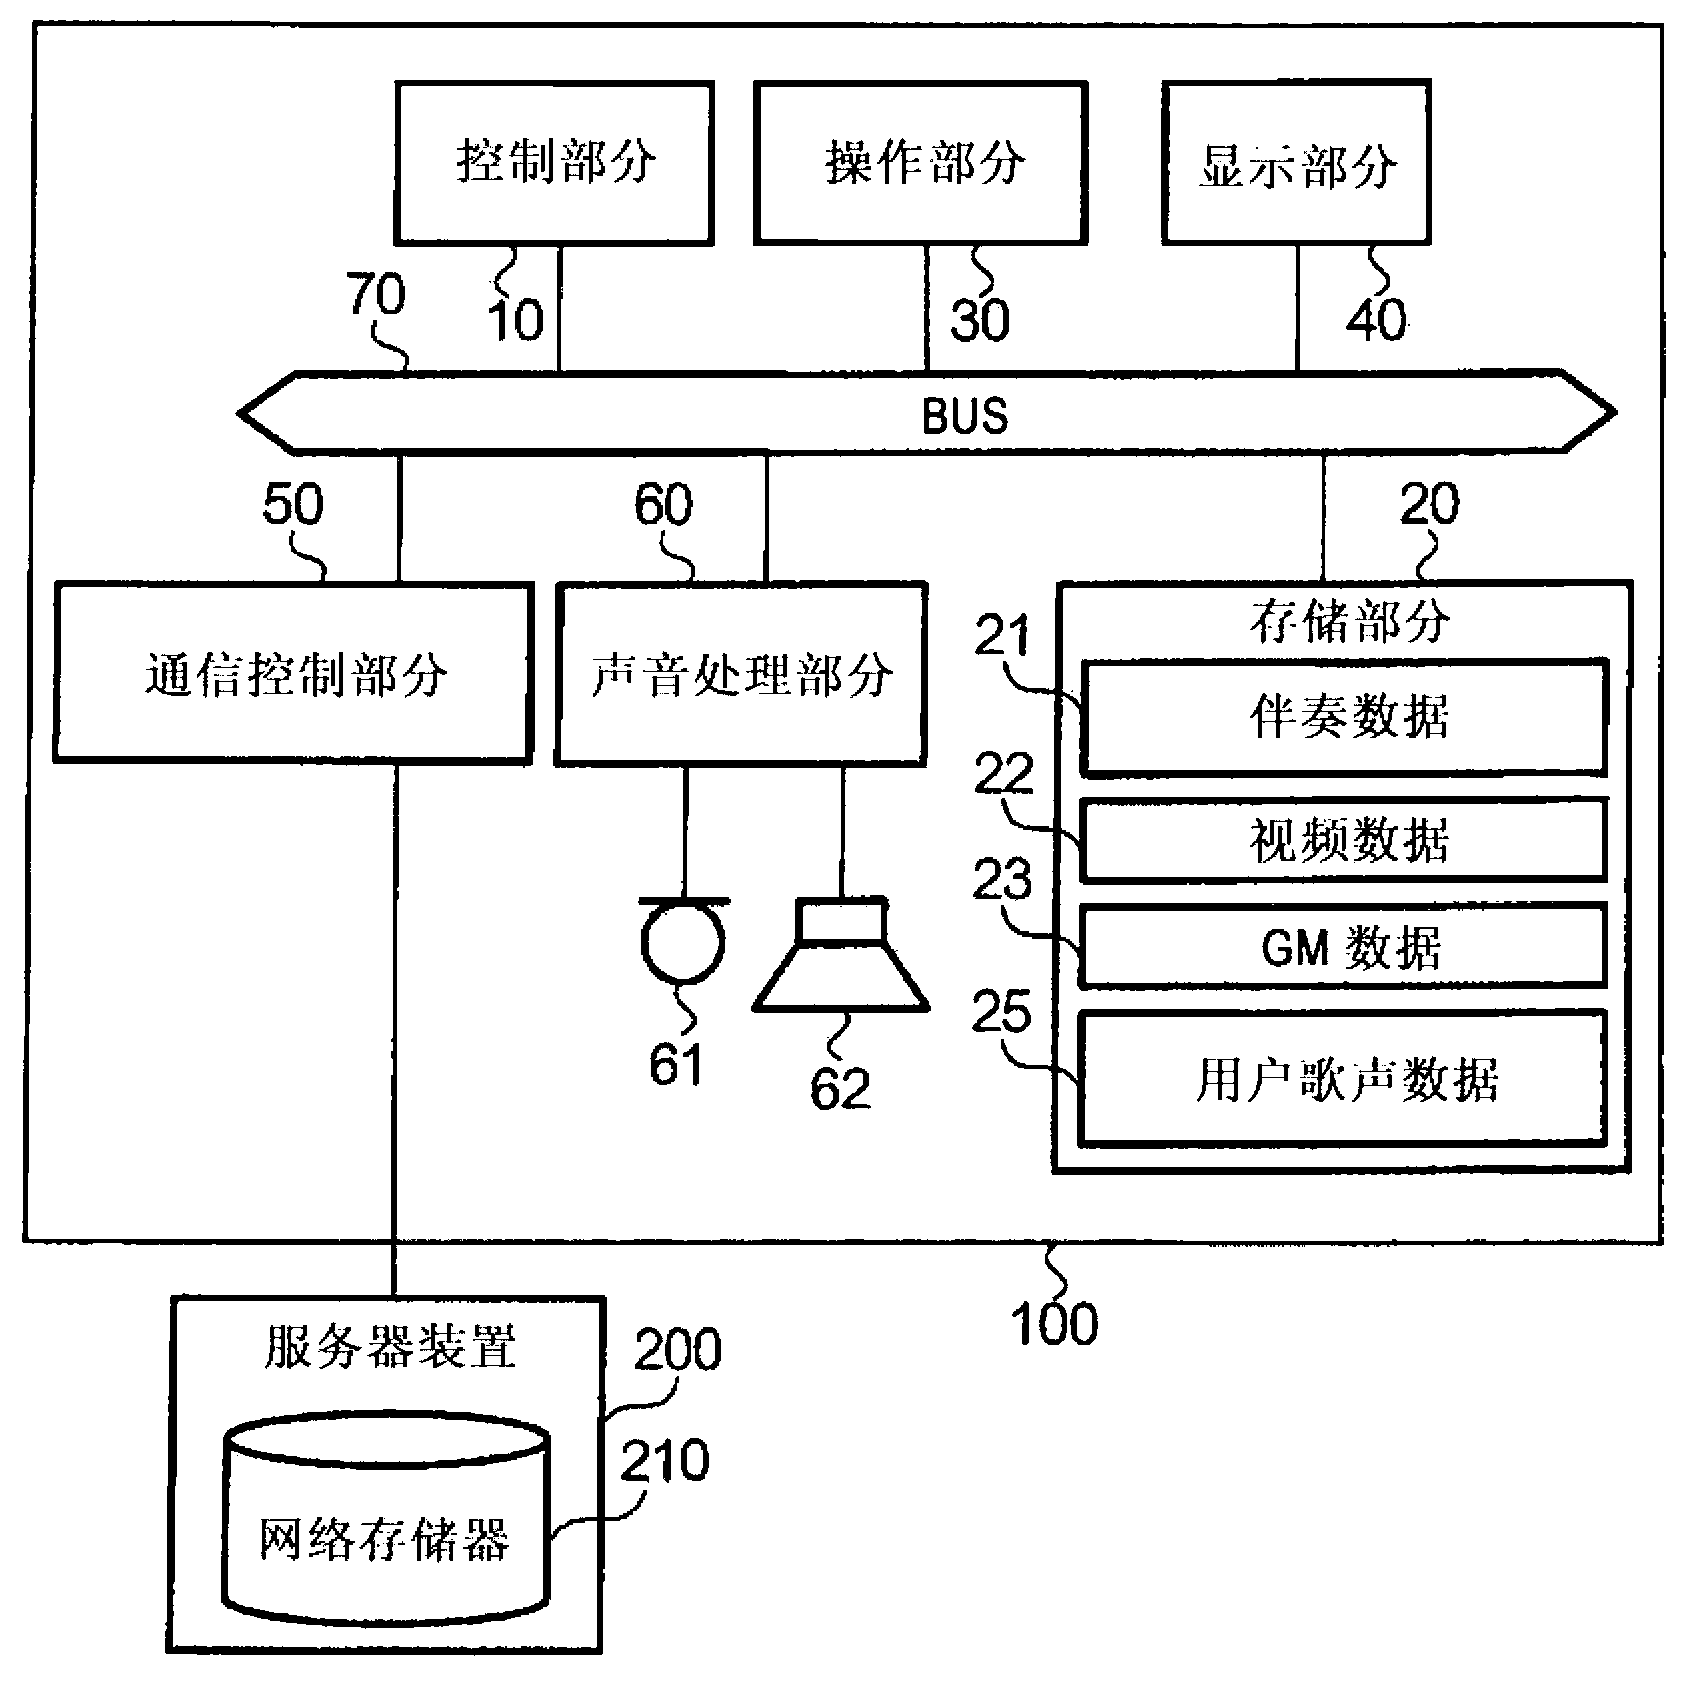
[0022] figure 1 is a configuration diagram showing a system employing an embodiment of the present invention. This system includes a karaoke device 100, a server device 200, and a network NW. The karaoke apparatus 100 is configured not only to reproduce a karaoke piece of music according to a user's request, but also to evaluate the user's singing according to the reproduced karaoke piece of music. The karaoke device 100 is an embodiment of the display control device of the present invention. The network NW is a LAN (Local Area Network) or the Internet for data communication between the karaoke device 100 and the server device 200 . The server device 200 has a storage section provided internally or provided externally, such as HDD (Hard Disk Drive), in which various data such as content data related to karaoke music are stored, and the server device 200 is configured to store the content data according to the user's request. Provided to the karaoke device 100. H...
PUM
 Abstract
Description
Claims
Application Information