
Signal strength display method and mobile terminal

A technology of signal strength and display method, which is applied in the field of communication, can solve problems such as being woken up, insufficient power saving, affecting user experience, etc., and achieves the effect of stably displaying signals

Inactive Publication Date: 2014-09-17
QINGDAO HISENSE MOBILE COMM TECH CO LTD
View PDF6 Cites 6 Cited by
  • Summary
  • Abstract
  • Description
  • Claims
  • Application Information

AI Technical Summary

Problems solved by technology

[0005] 1. Once the mobile terminal is in the coverage area of ​​multiple base stations, or is located in a remote mountainous area with less base station coverage, etc., resulting in poor reception of wireless communication signals, the signal grid will change frequently, affecting user experience
[0006] 2. Whenever the Modem reports the real-time detected signal strength to the AP, it must be woken up first, and then the detection result is sent to the AP. The AP will go to sleep after processing. The AP is often woken up, which is not enough to save power.

Method used


Image

  • Signal strength display method and mobile terminal
  • Signal strength display method and mobile terminal
  • Signal strength display method and mobile terminal

Examples


Embodiment 1

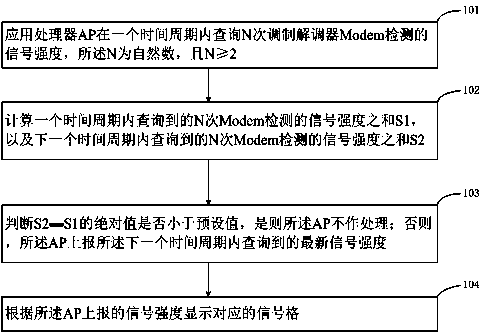
[0025] refer to figure 1 , shows a flow chart of a method for displaying signal strength according to Embodiment 1 of the present invention, and the method may specifically include the following steps:

[0026] In step 101, the application processor AP queries the signal strength detected by the Modem N times within a time period, where N is a natural number and N≥2.

[0027] In the embodiment of the present invention, the AP actively inquires, and records the signal strengths detected by the Modem for N times inquired within a time period T1. In order to accurately reflect the trend of signal strength changes, the query of the signal strength detected by the Modem for N times includes querying the signal strength once every predetermined query interval (p1 second in this embodiment) within the time period, that is, the time of each query The interval is p1 seconds, and a total of N queries are made. The relationship between T1 and p1 is T1=N*p1.

[0028] Step 102, calculat...

Embodiment 2

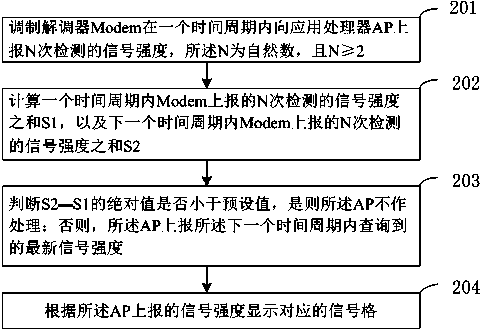
[0040] refer to figure 2 , shows a flow chart of a method for displaying signal strength according to Embodiment 2 of the present invention, and the method may specifically include the following steps: .

[0041] Step 201 , the modem reports the signal strength detected N times to the application processor AP within a time period, where N is a natural number and N≥2.

[0042] The embodiment of the present invention adopts the Modem reporting method, and the Modem records the detected signal strength every predetermined reporting interval (p2 seconds in this embodiment), and transmits it to the AP.

[0043] Step 202 , calculating the sum S1 of the signal strengths of N detections reported by the Modem within a time period, and the sum S2 of the signal strengths of N detections reported by the Modem within a next time period.

[0044] Add all signal strengths reported in one time period recorded in step 201 to obtain S1, and add all signal strengths reported in the next time p...

Embodiment 3

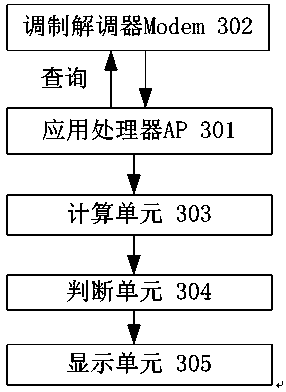
[0052] refer to image 3 , shows a structural block diagram of a mobile terminal according to Embodiment 3 of the present invention. The mobile terminal may include an application processor AP 301 , a modem 302 , a computing unit 303 , a judging unit 304 , and a display unit 305 .

[0053] The AP 301 is used to query the signal strength detected by the Modem 302 N times within a time period, where N is a natural number, and N≥2.

[0054] The calculation unit 303 is configured to calculate the sum S1 of signal strengths of N times of Modem detections queried within a time period, and the sum S2 of signal strengths of N times of Modem detections queried within a next time period.

[0055] The judging unit 304 is used to judge whether the absolute value of S2-S1 is less than a preset value, if yes, the AP does not process; otherwise, the AP reports the latest signal strength queried in the next time period.

[0056] The display unit 305 is configured to display a corresponding s...


PUM


Abstract

The invention provides a signal strength display method. Signal strength detected by a Modem is inquired N times by an AP in one time period, or signal strength detected by a Modem is reported to an AP in one time period, N is a natural number and larger than or equal to 2; the sum S1 of the inquired or reported signal strength in one time period is calculated, and the sum S2 of the inquired or reported signal strength in a next time period is calculated; whether the absolute value of S2-S1 is smaller than a preset value or not is judged, and if yes, the AP does not perform processing; if not, the newest signal strength inquired in the next time period is reported by the AP; the corresponding signal bar is displayed according to the signal strength reported by the AP. Due to the method, the AP awakening frequency is reduced, and the power saving effect is achieved. When the changing degree of the sum of two kinds of signal strength exceeds preset degree, the signal strength is displayed as the newest signal strength inquired in the next time period, and therefore the signal strength detected in the process can be filtered out, and a display signal is stabilized.

Description

technical field [0001] The invention relates to the field of communication technology, in particular to a signal strength display method and device for a mobile terminal. Background technique [0002] The signal strength displayed by the mobile terminal is to measure the current network signal of the mobile terminal in real time through the Modem (modem), report the measurement result to the AP (Application Processor, application processor), and the AP notifies the UI (User Interface, user interface) to perform corresponding interface refresh and display. [0003] An existing method for displaying signal strength is that after the modem reports the real-time measurement result to the AP, the AP does not perform any additional processing and directly reports the received result to the UI. [0004] The inventor finds that the prior art has the following defects in the process of realizing the present invention: [0005] 1. Once the mobile terminal is within the coverage of m...

Claims


Application Information

Patent Timeline
Patent Type & Authority Applications(China)
IPC IPC(8): H04W24/08H04W24/10
CPCY02B60/50Y02D30/70
Inventor 陈泽元
Owner QINGDAO HISENSE MOBILE COMM TECH CO LTD
Learn More