Graphical display module and display method of automobile meter detection data

A technology for graphical display and detection data, applied in vehicle parts, transportation and packaging, etc., can solve the problem that multiple types of detection data cannot be displayed graphically at the same time

Active Publication Date: 2017-10-27
AEROSPACE HI TECH HLDG GROUP
View PDF5 Cites 0 Cited by
  • Summary
  • Abstract
  • Description
  • Claims
  • Application Information

AI Technical Summary

Problems solved by technology

[0003] The purpose of the present invention is to solve the problem that multiple types of detection data of automobile meters cannot be displayed graphically at the same time, and provide a graphical display module and display method of detection data of automobile meters

Method used


Image

  • Graphical display module and display method of automobile meter detection data
  • Graphical display module and display method of automobile meter detection data

Examples


specific Embodiment approach 1

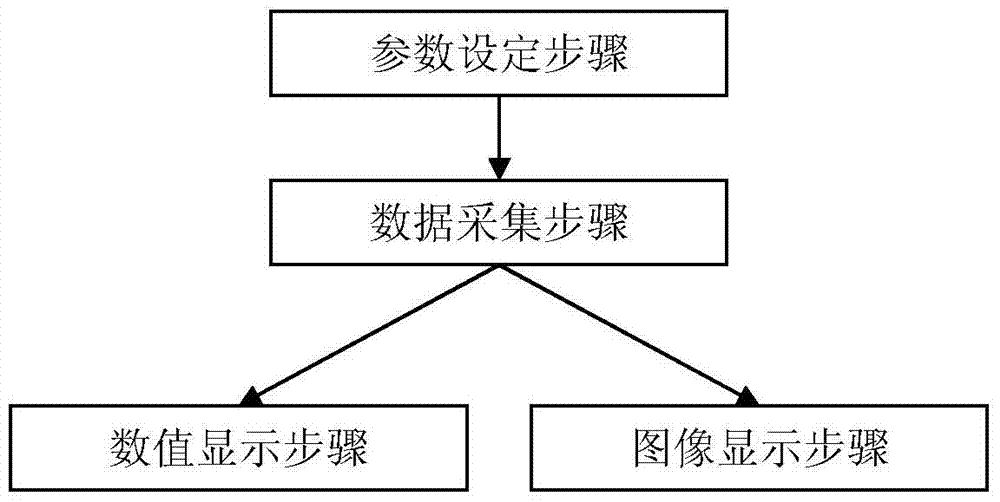
[0020] Specific implementation mode one: combine figure 1 and figure 2 Describe the present embodiment, the graphical display module of the automobile instrument detection data described in the present embodiment includes the following units:

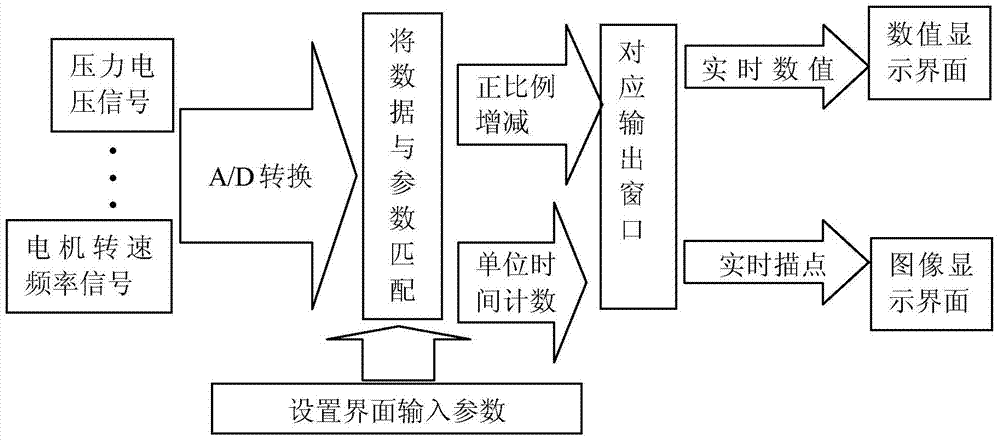
[0021] Parameter setting unit: receiving the parameters set by the user, the parameters include data types and detection time, the data types include pressure, temperature, laser ranging and motor speed;

[0022] Data collection unit: collect corresponding data according to the data type set by the user, and store the data;

[0023] Numerical display unit: display each type of data collected on the screen at the same time, and different types of data are displayed in different areas of the screen;

[0024] Image display unit: display each type of data collected on the screen in the form of two-dimensional curves, and the two-dimensional curves corresponding to each type of data are displayed in different areas of the screen, each two...

specific Embodiment approach 2

[0031] Specific embodiment 2: This embodiment is a further limitation of the graphical display module of the automobile instrument detection data described in the first embodiment. In this embodiment, the graphical display module further includes the following units:

[0032] Unit determination unit: determine the unit of the ordinate of the two-dimensional curve according to the type of data;

[0033] And the image display unit also displays the unit of the ordinate on the corresponding two-dimensional curve.

[0034] In this embodiment, the unit of the ordinate is automatically determined. For example, if the data type selected by the user is pressure and temperature, the unit of the ordinate of the pressure curve is Newton, and the unit of the ordinate of the temperature curve is Celsius. This embodiment automatically matches and displays the ordinate unit according to the type of data, does not require manual setting by the user, and is easy to operate, and the image displ...

specific Embodiment approach 3

[0035] Specific embodiment three: this embodiment is a further limitation of the graphical display module of the automobile instrument detection data described in the first embodiment. In this embodiment, the graphical display module further includes the following units:

[0036] Sampling frequency determination unit: determine the sampling frequency according to the detection time set by the user;

[0037] And the data acquisition unit performs sampling according to the sampling frequency.

[0038] In this embodiment, the user does not need to manually set the sampling frequency, but the sampling frequency is automatically determined according to the detection time set by the user. Normally, the size of the area occupied by each image on the screen is fixed. According to the detection time set by the user, combined with the size of the area, the sampling frequency is reasonably determined so that a continuous curve can be displayed on the screen. The detection time can be ch...


PUM


Abstract

The invention provides an automotive instrument test data graphical display module and display method and relates to the automotive instrument detection technology. The Automotive instrument test data graphical display module and display method aims at solving the problem that multiple automotive instrument test data cannot be graphically displayed simultaneously. The automotive instrument test data graphical display method comprises setting types of data which need to be tested and the test time by a user; collecting the corresponding types of data; displaying the data on a screen in numerical and graphical ways, wherein the sampling frequency can be automatically adjusted and units of the data can also be automatically matched with the types of the data. According to the automotive instrument test data graphical display module and display method, the multiple test data can be simultaneously displayed and accordingly the test time is greatly shortened, the test efficiency is improved, and the automotive instrument test data graphical display module and display method is suitable for the test on various instrument data and can also be applied to an enterprise management system.

Description

technical field [0001] The invention relates to the detection technology of an automobile instrument. Background technique [0002] In the process of automobile instrument inspection, various data need to be detected, such as pressure, temperature, motor speed, laser distance measurement, etc. At present, the detected data can only be displayed in a single way, but cannot be displayed on the same interface at the same time, so these data only It can be detected separately, that is, only one type of data can be detected at the same time, and the detection efficiency is greatly reduced. Moreover, when these data are displayed graphically, the unit and display range of the coordinate axes of each image need to be set separately, and the operation is cumbersome. Contents of the invention [0003] The purpose of the present invention is to solve the problem that multiple types of test data of automobile meters cannot be displayed graphically at the same time, and provide a grap...

Claims


Application Information

Patent Timeline
Patent Type & Authority Patents(China)
IPC IPC(8): B60K35/00
Inventor 李春龙王大钊张志波曲成伟张志远胡伟冯永明
Owner AEROSPACE HI TECH HLDG GROUP
Why Eureka
Try Eureka