Method and device for generating evolution diagram of event group

A technology for event evolution and event generation, applied in the field of data processing, it can solve the problems of long time, the evolution process that cannot reflect the heat of a single event, and the compression of the display area of ​​geothermal events, so as to reduce the time complexity.

Active Publication Date: 2015-09-09
BAIDU ONLINE NETWORK TECH (BEIJIBG) CO LTD
View PDF4 Cites 7 Cited by
  • Summary
  • Abstract
  • Description
  • Claims
  • Application Information

AI Technical Summary

Problems solved by technology

[0006] However, existing visibility event evolution displays have some prominent shortcomings
For a line chart, the lines of different events tend to occlude each other, and high heat events will compress the display area of ​​other geothermal events; the line chart cannot show the continuity of events, and the same event will be counted multiple times at different times Reflect the evolution process of a single event heat, etc.
Although the bubble chart overcomes the problems of mutual occlusion between the event lines in the line chart and the inability to reflect the evolution process of a single event, in order to ensure that the bubbles do not overlap, it is necessary to calculate the position of each bubble in the coordinate system, and perform this calculation The time complexity of the process is high
The change process of events can be seen through the event iceberg map, but because most of the time is laid out at different heights, it is difficult for users to compare the heat differences between different events; in addition, the time complexity of laying out the event iceberg map is also relatively high. High, it takes a long time to draw the event iceberg map with a large number of events

Method used


Image

  • Method and device for generating evolution diagram of event group
  • Method and device for generating evolution diagram of event group
  • Method and device for generating evolution diagram of event group

Examples


Embodiment 1

[0058] Figure 7 is a flowchart illustrating a method of generating an event group evolution graph according to an exemplary embodiment of the present invention. The method is performed by a computer system.

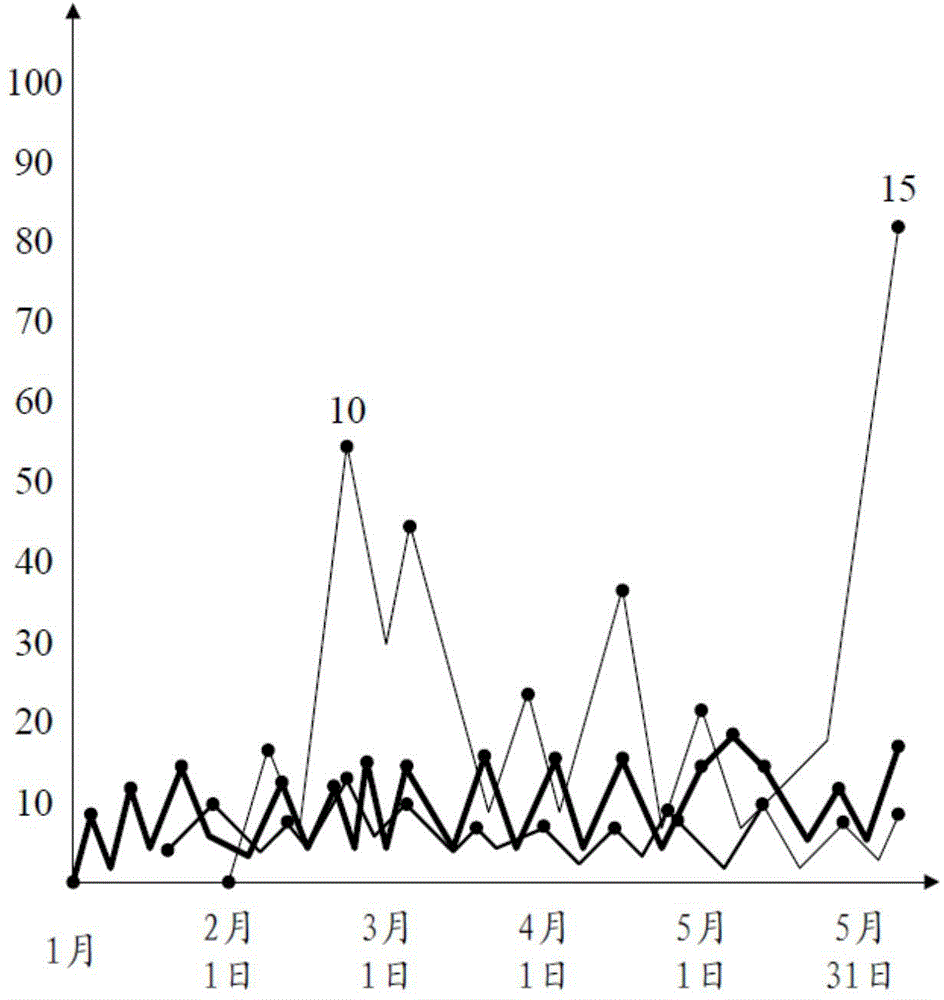
[0059] refer to Figure 7 , in step S710, a plurality of event evolution graphs are obtained, and the event evolution graphs indicate the evolution state of the popularity of the event over time.

[0060] Event evolution graphs for individual events can be drawn as previously described.

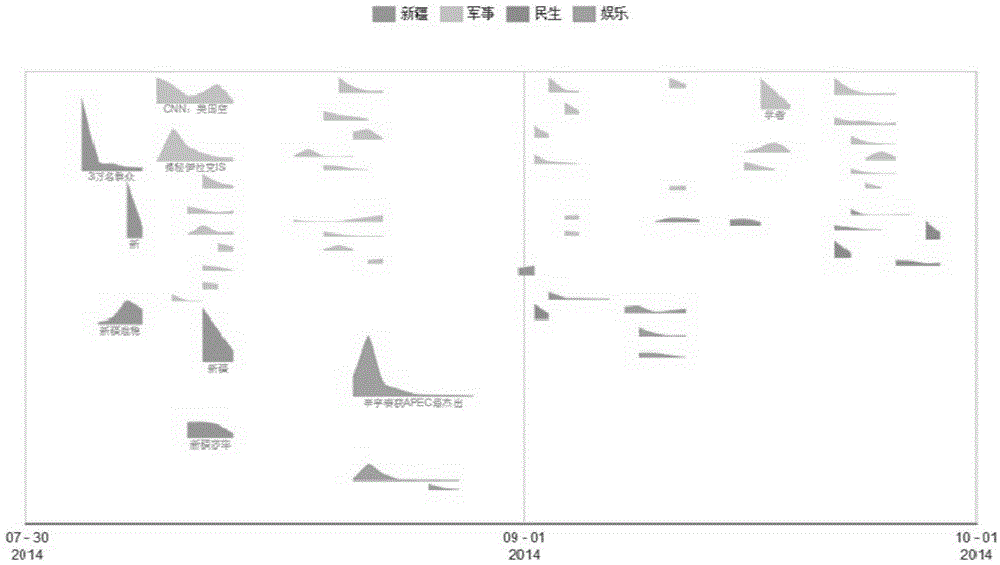
[0061] In step S720, according to the time intervals of the multiple events and the popularity of the corresponding events, the drawing positions of the multiple events in the merge candidate area are sequentially marked, wherein, for any event, according to the event's The data of the time interval, the popularity of attention and the previously marked drawing position mark the drawing position of the event in the merging candidate area.

[0062] Here, the left and right endpoints ...

Embodiment 2

[0072] Figure 8 is another exemplary embodiment according to the present invention shown in Figure 7 A flowchart of the processing of step S720 shown in .

[0073] refer to Figure 8 , according to a preferred embodiment of the present invention, in step S7221, the multiple events are sorted in descending order of the overall popularity of the events concerned.

[0074] The overall popularity here may be, for example but not limited to, the sum of the popularity values ​​of events at various time points, the average value of the popularity values ​​of events at various time points, or the popularity values ​​of events at various time points peak among them.

[0075] It should be pointed out that step S7221 is not a step that must be executed, but for arranging the event evolution diagrams of the multiple events according to the overall popularity of the events concerned; sorting the events according to the order of the overall popularity of the events from high to low, us...

Embodiment 3

[0097] Figure 9 is a logic block diagram illustrating an apparatus for generating an event group evolution graph according to an exemplary embodiment of the present invention.

[0098] refer to Figure 9 , the apparatus for generating an event group evolution graph according to an exemplary embodiment of the present invention includes an event evolution graph acquisition unit 910 , a drawing position labeling unit 920 and an event group evolution graph generation unit 930 .

[0099] The event evolution diagram acquisition unit 910 is configured to acquire a plurality of event evolution diagrams, the event evolution diagrams indicate the evolution state of the popularity of the event over time.

[0100] The drawing position labeling unit 920 is used to mark the drawing positions of the multiple events in the merge candidate area in turn according to the time interval of the multiple events and the degree of attention of the corresponding events, wherein, for any event, accord...


PUM


Abstract

The embodiment of the invention provides a method and device for generating an evolution diagram of an event group. The method comprises the steps: obtaining a plurality of event evolution diagrams which indicate the evolution state of the popularity of concerned events; sequentially marking the drawing positions of a plurality of events in a combination candidate region according to the time sections of the plurality of events and the popularity of the corresponding events; and respectively enabling the plurality of event evolution diagrams to be copied in the combination candidate region according to the drawing positions, so as to generate the evolution diagram of the event group. When the position of the evolution diagram of any one event in the combined drawing region is determined, there is no need of considering the layout of other events, and the longitudinal drawing position just needs to be determined according to longitudinal heights corresponding to marked time points, thereby reducing the time complexity in layout of the event evolution diagrams, and reducing the time complexity from O(nlgn) to O(n).

Description

technical field [0001] The invention relates to data processing technology, in particular to a method and device for generating an event group evolution diagram. Background technique [0002] With the development of Internet technology, the traditional news media has begun to transform towards the Internet. More and more online news media reports are more time-sensitive and spread more widely than traditional paper media. Netizens’ comments and reposts on news events on platforms such as news websites and social networks can largely reflect the direction of public opinion on an event. Collecting data on the Internet, automatically extracting events and their attention is the key to mastering and controlling the direction of public opinion. At present, there are relatively mature technologies for event extraction and mining, but the graphical display of event evolution process is a relatively blank field. [0003] Currently, in the industry, a line chart is usually used to...

Claims


Application Information

Patent Timeline
Patent Type & Authority Applications(China)
IPC IPC(8): G06T11/20
Inventor 车丽美李永沈剑平李炫莫洋郑楚煜齐沁芳宋元峰
Owner BAIDU ONLINE NETWORK TECH (BEIJIBG) CO LTD
Why Eureka
Try Eureka