Methods for Identifying Spectral Differences

A technology for marking spectra and differences, applied in the field of spectroscopy and instrument analysis, can solve unreasonable problems, achieve the effect of simple equipment, low cost, and qualitative judgment

Active Publication Date: 2018-08-17
SHANGHAI OCEANHOOD OPTO ELECTRONICS TECH
View PDF4 Cites 0 Cited by
  • Summary
  • Abstract
  • Description
  • Claims
  • Application Information

AI Technical Summary

Problems solved by technology

If the correlation coefficient is used to measure the spectral consistency, judging according to the correlation coefficient, unreasonable conclusions will be obtained

Method used


Image

  • Methods for Identifying Spectral Differences
  • Methods for Identifying Spectral Differences
  • Methods for Identifying Spectral Differences

Examples


Embodiment 1

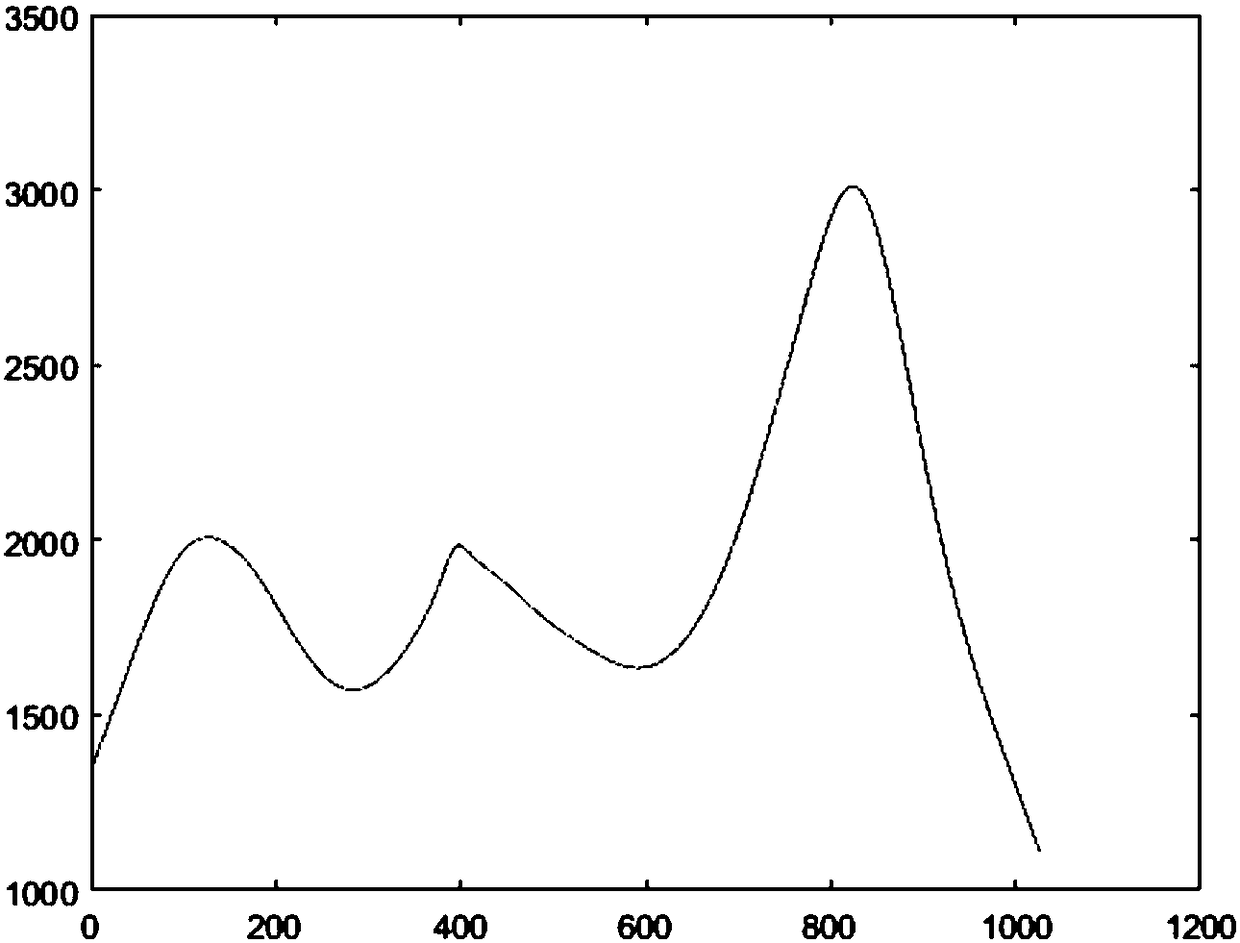
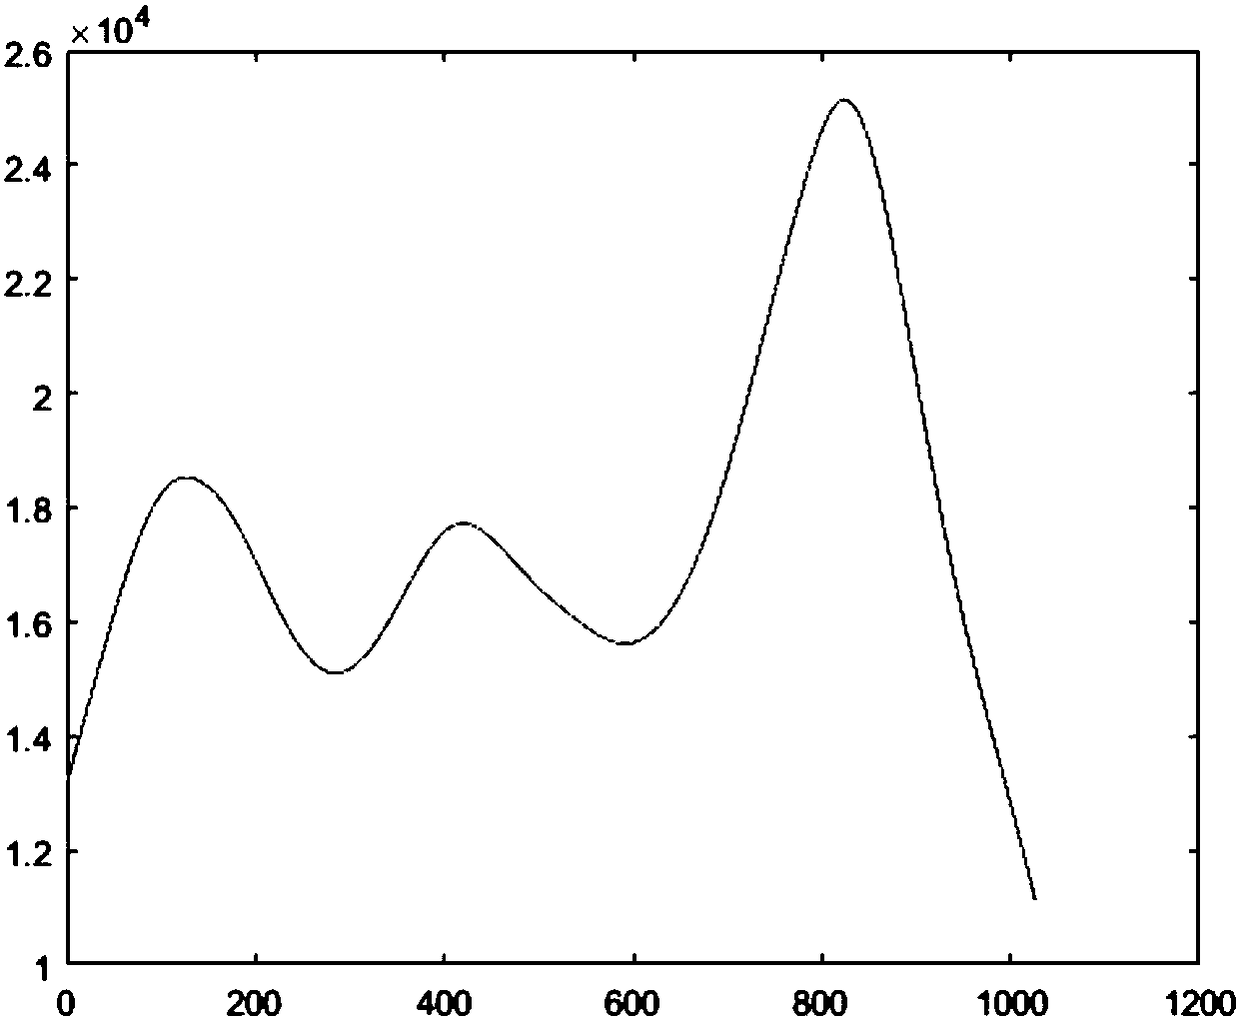
[0049] S1. First choice figure 1 , figure 2 , image 3 The three spectra shown are compared separately figure 1 and figure 2 , figure 1 and image 3 , figure 2and image 3 difference;

[0050] S2. figure 1 , figure 2 , image 3 contains 1026 data points respectively, and takes moving windows of 8, 16, 32, 64, 128, 256, and 512 data points respectively;

[0051] S3. From the left end of the spectrogram, calculate the vector angle of the two spectral lines in the moving window of 8 data points;

[0052] S4. The moving window is moved to the next point, and the vector angle is calculated until the moving window reaches the right end of the spectrogram;

[0053] S5. Save the vector angle calculated by moving the moving window to the data sequence S temp ;

[0054] S6. Enlarge the data window, move from the left end of the spectrogram, calculate the vector angle between the two spectrograms in the moving window, move the moving window to the next point, calculate ...


PUM


Abstract

The invention relates to a method for identifying spectrum difference. The method comprises the following steps: defining a plurality of moving windows in different scales for a spectrogram; under each scale, calculating vector angle values of compared spectrograms in the window and acquiring a series of included angle values in the whole spectral scope through the moving windows; adjusting the size of the window, thereby acquiring the complete spectral line difference under each scale; inspecting the difference distribution on different positions and scales; judging the consistency of the spectral line according to the difference distribution. According to the method, the qualitative judgment for near infrared spectrum can be realized by judging the consistency of the measuring spectrum and the standard spectrum; the applied equipment is simple and the cost is low; the recognizing reasonability is enhanced; the method is simple and direct and is easy to understand.

Description

technical field [0001] The invention relates to the fields of spectroscopy and instrumental analysis, in particular to a method for marking spectral differences. Background technique [0002] Spectrum is a means of expressing the properties of substances. Usually, the clear characteristic peaks contained in mid-infrared and Raman are used to characterize substances. However, near-infrared spectroscopy usually lacks clear characteristic peaks, which affects the qualitative accuracy. At present, the near-infrared qualitative method mostly adopts the pattern recognition method, which is discriminated by relatively general correlation coefficients, cosine values ​​of included angles and other similar coefficients. [0003] Due to the insignificant near-infrared spectral features, the difference in instrument response will also cause the lack of specificity of the existing similarity coefficients. [0004] Taking the spectral lines shown in the figure as an example, figure 1 i...

Claims


Application Information

Patent Timeline
Patent Type & Authority Patents(China)
IPC IPC(8): G01N21/359
CPCG01N21/359
Inventor 姚志湘粟晖
Owner SHANGHAI OCEANHOOD OPTO ELECTRONICS TECH
Why Eureka
Try Eureka