A Method and Device for Abnormal Correction of Micro-resistivity Scanning Imaging Logging Data

A technology for logging data and scanning imaging, which is used in measurement devices, radio wave measurement systems, and electrical/magnetic detection for logging records. Level changes, etc.

Active Publication Date: 2020-04-14
中石化石油工程技术服务有限公司 +3
View PDF5 Cites 0 Cited by
  • Summary
  • Abstract
  • Description
  • Claims
  • Application Information

AI Technical Summary

Problems solved by technology

[0004] The purpose of the present invention is to provide a method for correcting the abnormality of micro-resistivity scanning imaging logging data to solve the problem that the correction of abnormal data does not reflect the change of the data level, resulting in the fact that the corrected data cannot reflect the real change of the data

Method used


Image

  • A Method and Device for Abnormal Correction of Micro-resistivity Scanning Imaging Logging Data
  • A Method and Device for Abnormal Correction of Micro-resistivity Scanning Imaging Logging Data
  • A Method and Device for Abnormal Correction of Micro-resistivity Scanning Imaging Logging Data

Examples


example 1

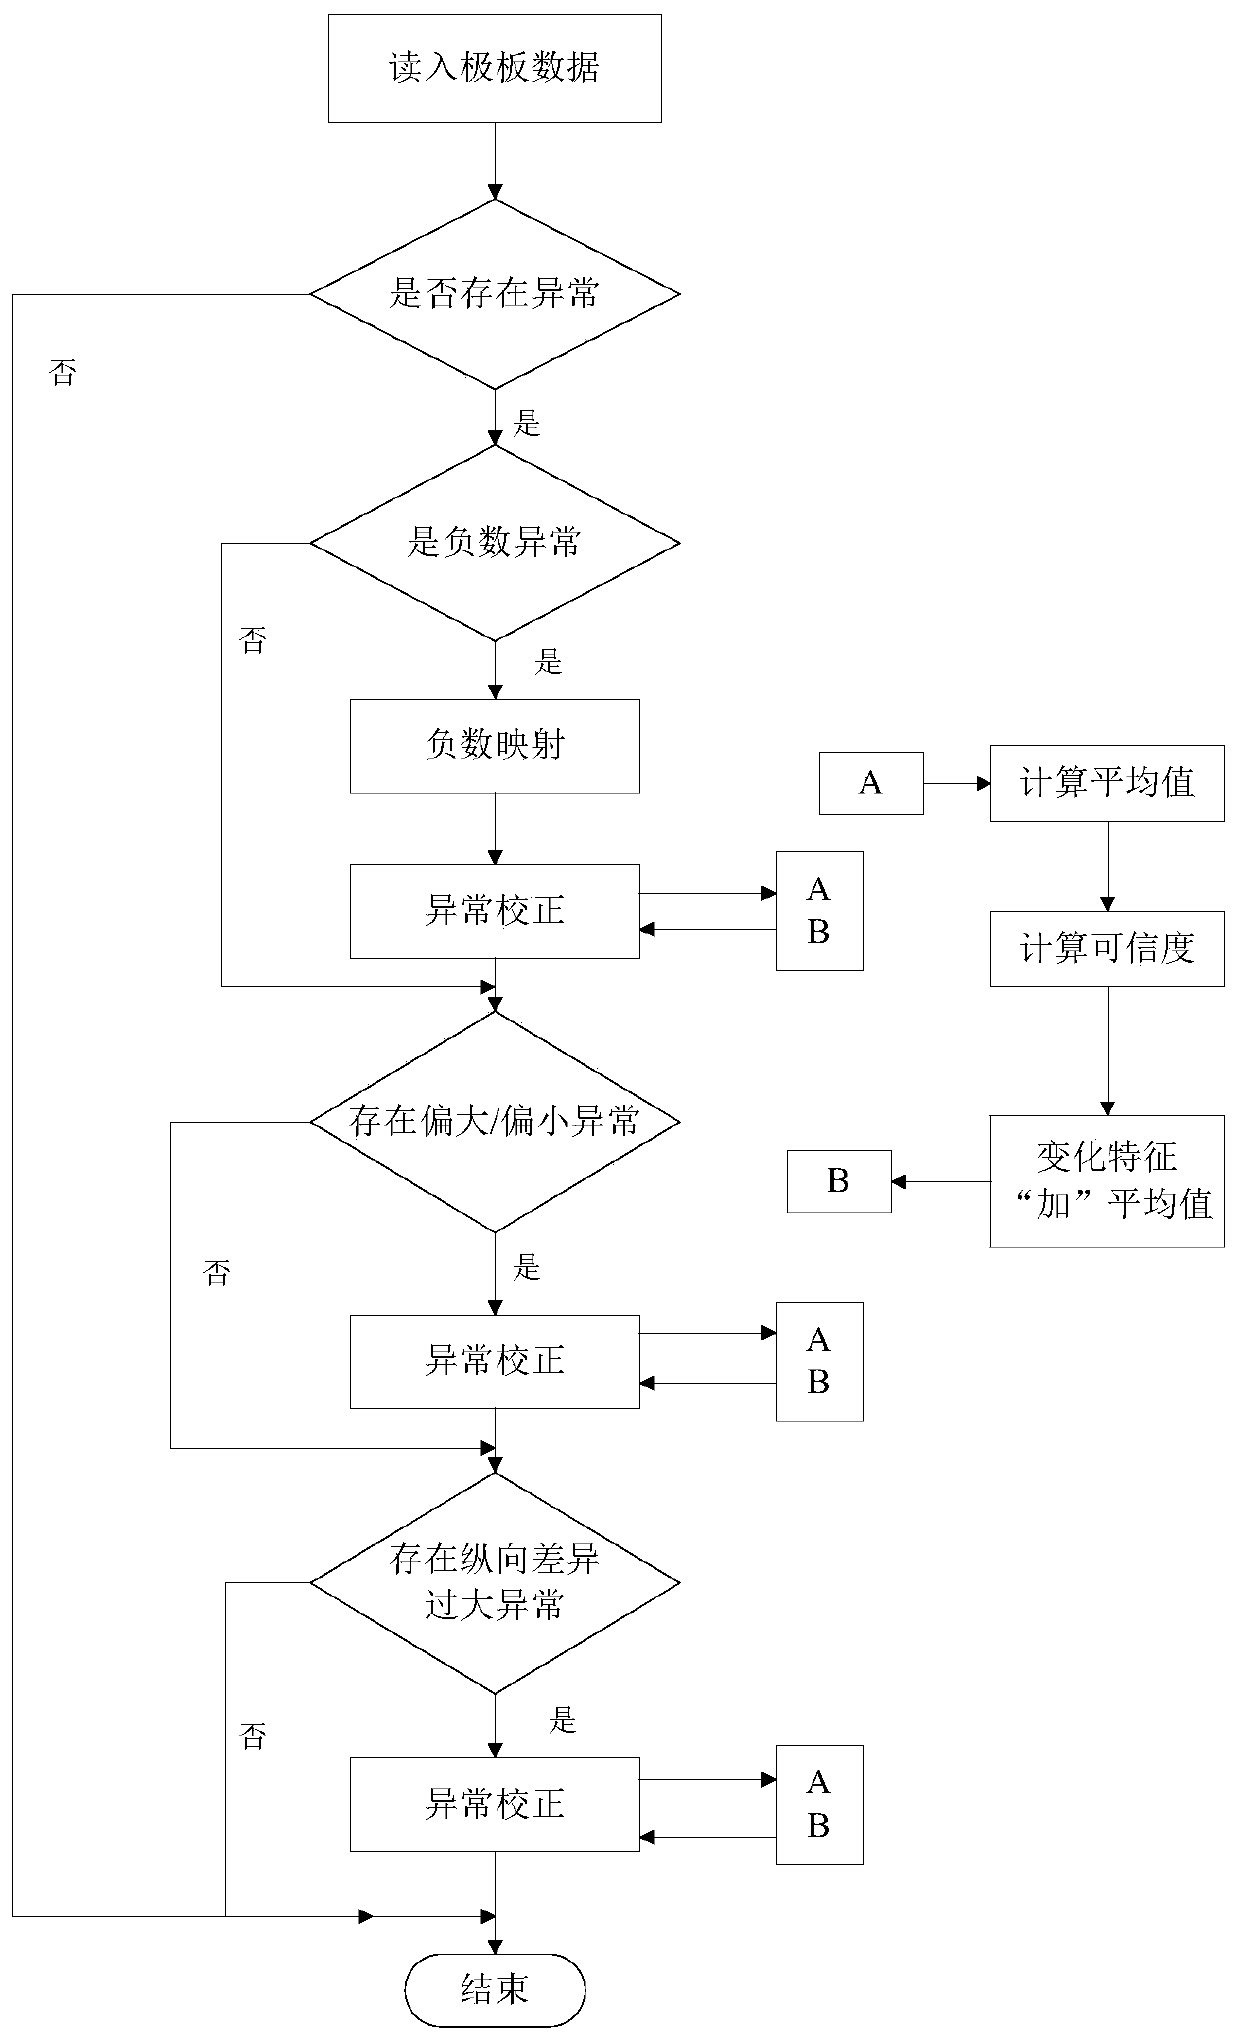
[0111] Example 1: Correct the abnormally large data of the pole plate or electric buckle.

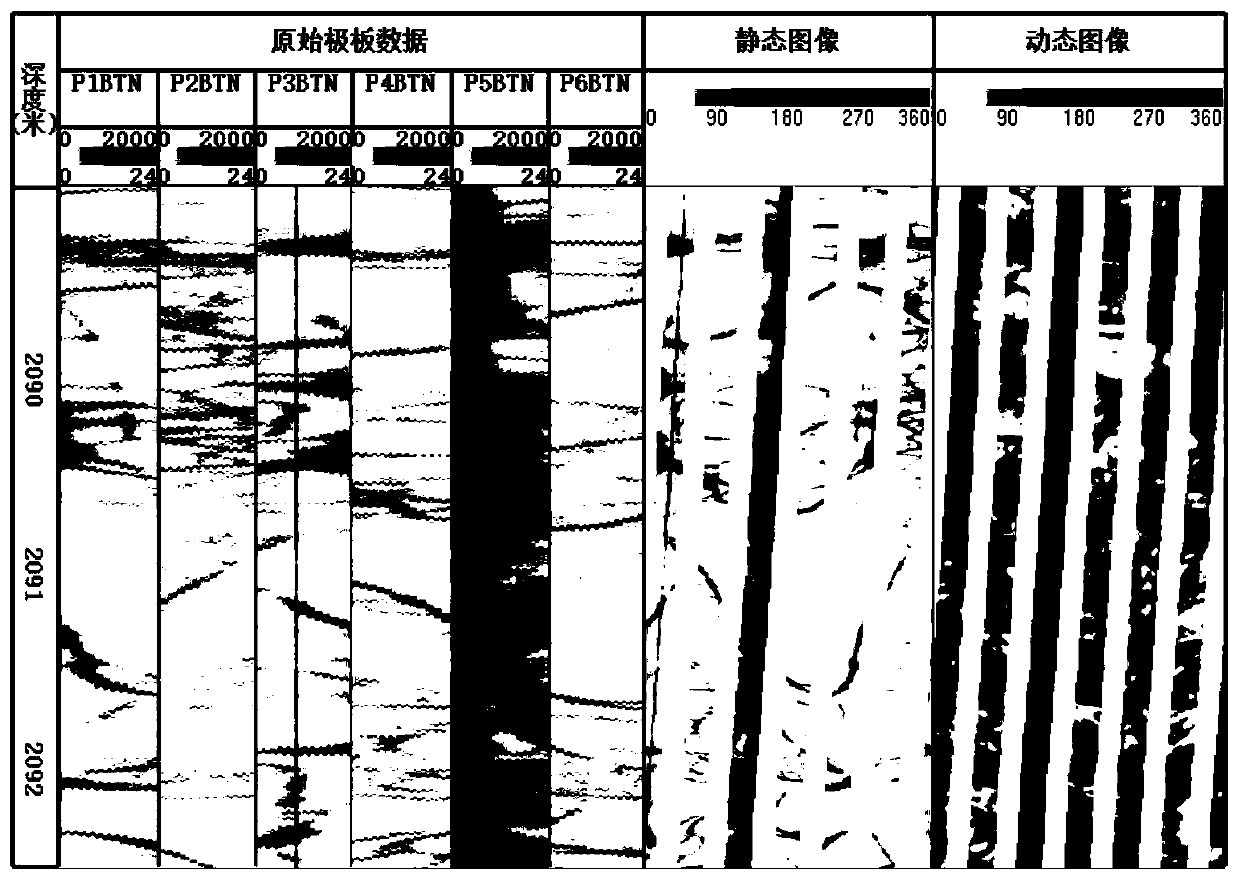
[0112] Such as image 3 The original data and imaging display of the STAR-II microresistivity scanning imaging of Well X1, through the abnormal detection of the original data, the detection results show that the value of the whole well section of the No. 5 plate is too large, and the No. 3 plate and the No. The value of the segment is too large (see the original plate data in the first track), and the processed static and dynamic images have obvious dark bands and linear stripes (the second and third tracks). Applying the correction method of the present invention can correct the abnormal type detected, and the corrected plate data and imaging results are as follows: Figure 4 shown.

example 2

[0113] Example 2: Processing of negative outliers in well logging data.

[0114] Figure 5 The original plate data curves were scanned and imaged for the FMI microresistance of well X2. It can be seen that there are a large number of negative values ​​(FCC1 and FCC2) on the main board on the No. 3 arm, but the change trend of each button curve is consistent with that of other plates. It belongs to the situation that the plate data is completely invalid, and this kind of data can still be used after certain correction processing.

[0115] Before correction, if the negative number is replaced by a very small value close to 0, a large number of white blocks will appear in the image, which is obviously inappropriate; if the negative number is not handled abnormally, the color scale range corresponding to the valid data will be reduced, and the resolution of the static image will be reduced. reduce (such as Figure 7 The first static image), dynamic images appear white spots or w...

example 3

[0116] Example 3: Verification of Correction for Excessive Differences in Formation Characteristic

[0117] Figure 8 The original plate data and images of XRMI micro-resistivity scanning imaging for Well X3 show that the lithology of the formation in the measured section of the well has changed greatly, and the upper part is a sandy mudstone formation, and the recorded plate value ranges from 0 to 1000 (such as Figure 8 The first and second traces), the lower part is the tuff formation, and the range of plate values ​​recorded is 0-1000 (such as Figure 8 4th and 5th track), although this kind of data is a true reflection of the formation, it cannot scale and describe the static image very well, which affects the effect of longitudinal mapping, such as Figure 8 In the third track, in order to better scale and display the static image of the upper stratum, all the lower images are brightened. In the sixth track, in order to show the static image of the lower stratum, the scale ...


PUM


Abstract

The invention relates to a method and a device for correcting abnormal micro-resistivity scanning imaging logging data and belongs to the technical field of petroleum engineering logging. The method includes firstly, collecting logging data and judging whether the data are abnormal or not and an abnormal type; secondly, selecting normal data adjacent to the abnormal data according to the abnormal type to compute an average value; thirdly, computing credibility of the abnormal data based on similarity between the abnormal data and the adjacent normal data, and judging whether the abnormal data are credible or not according to the credibility; finally, substituting the average value for the abnormal data as a correction value if not, and if yes, extracting change characteristics of the abnormal data, and adding the corresponding average value to the change characteristics to serve as a correction value of the abnormal data. The method can enable the abnormal data to fit the adjacent normal data in size on the whole after correction, the change characteristics of the abnormal data are retained partially, and good imaging effects can be obtained after visualization imaging.

Description

technical field [0001] The invention relates to a method and device for correcting abnormality of micro-resistivity scanning imaging logging data, belonging to the technical field of petroleum engineering logging. Background technique [0002] The micro-resistivity scanning imaging logging tool has multiple plates, and multiple electric buttons are distributed on each plate to measure the change of conductivity around the well. In the process of collecting data, due to the complexity of the instrument or the downhole situation, Sometimes there will be abnormal data. If these abnormal data are not processed, the imaging effect, as well as the interpretation and application of imaging data will be significantly affected. For example: Due to the irregular well wall, the polar plate is not well attached to the well wall, or some electric buckles are damaged, the conductivity recorded by individual polar plates will be low, or the measured data of individual electric buckles will...

Claims


Application Information

Patent Timeline
Patent Type & Authority Patents(China)
IPC IPC(8): G01V3/18G01V3/38
CPCG01V3/18G01V3/38
Inventor 王慧萍李治江杨春文田新陈虎周贤斌何素文杨頔何小兵刘洋
Owner 中石化石油工程技术服务有限公司
Why Eureka
Try Eureka