A Map-Based Big Data Display Interface Interaction Method

A technology for displaying interfaces and interactive methods, applied in the field of data interaction, can solve problems such as spending a lot of time, limited data analysis, and low value of data information operations, and achieve the effect of reducing clicks to view

Active Publication Date: 2020-04-21
成都知道创宇信息技术有限公司
View PDF5 Cites 0 Cited by
  • Summary
  • Abstract
  • Description
  • Claims
  • Application Information

AI Technical Summary

Problems solved by technology

[0006] Most of the existing large-screen displays can only display data in one dimension of 3D or 2D
The 3D earth is often just a dynamic rendering, and the actual data information operation value is not very great
The data analysis that can be combined with 2D maps is also very limited. Once the data is divided into too detailed, users will spend a lot of time in operation to find the data display interface
Such interaction will undoubtedly increase the user's operation steps

Method used


Image

  • A Map-Based Big Data Display Interface Interaction Method
  • A Map-Based Big Data Display Interface Interaction Method
  • A Map-Based Big Data Display Interface Interaction Method

Examples


Embodiment Construction

[0039]The present invention will be described in further detail below with reference to the drawings and specific embodiments.

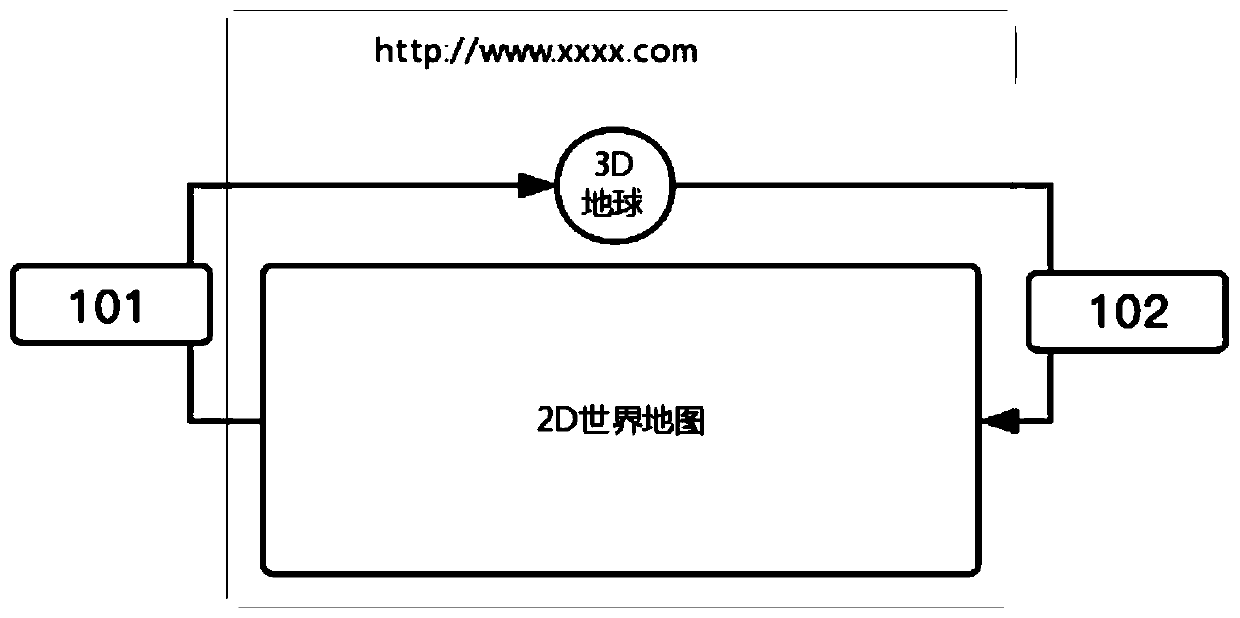
[0040] The present invention builds a data platform through 3D and 2D maps, achieves real-time interaction with attack data, and allows regional data to be displayed more intuitively and in detail. The ultimate core value of big data lies in "optimized allocation of resources". After presenting massive amounts of data through maps, the traditional one-way passive information acquisition method is transformed into a two-way linkage method to increase user participation. , to provide users with unlimited assistance and possibilities for big data visualization needs, so that non-professional users can easily deal with various professional data applications.

[0041] Such as figure 1 As shown, the user can drag and rotate at any angle on the 3D earth to change the geographical position display of the 2D map, so as to achieve linkage between the two maps...


PUM


Abstract

The invention discloses a map-based big data display interface interactive method; a data platform is set up through 3D and 2D maps, real-time interaction of attack data is achieved, and regional data can be displayed more visually and elaborately. Linked operation of 2D map and 3D earth is not limited only to switching of display modes; however, in switching, data of the map and earth can be mutually converted and analyzed, user's operation cost is decreased, and data checking and data analyzing efficiency are improved for users, interactive experience associated is more humanized, complex interactive experience for existing map retrieval is avoided, and it is possible for users to accurately locate required data information in shortest time.

Description

technical field [0001] The invention relates to the field of data interaction, in particular to a map-based big data display interface interaction method. Background technique [0002] Big data refers to "massive and complex data collections that cannot be extracted, stored, searched, shared, analyzed, and processed with existing software tools." The industry usually uses 4 V (i.e. Volume, Variety, Value, Velocity) to summarize the characteristics of big data. [0003] On the open sharing platform of the Internet, it is difficult for users to control and operate these data, and most of them will cost a lot of manpower and material resources. Most of them are analyzed by internal personnel, and it is difficult to form a mature commercial product. Based on the map data itself, it is huge and dense, and it does not generate value for the data itself. How to analyze and utilize large The key that should be solved is the help of data to the business. [0004] Taking the Intern...

Claims


Application Information

Patent Timeline
Patent Type & Authority Patents(China)
IPC IPC(8): G06F9/4401G06F3/0481G06T19/00
CPCG06F3/0481G06T19/003
Inventor 杨媛
Owner 成都知道创宇信息技术有限公司
Why Eureka
Try Eureka