Power data analysis method and device based on K-line graph, and intelligent terminal

A technology of power data and analysis methods, applied in circuit devices, electrical components, AC network circuits, etc., can solve the problem of inability to use electricity to grasp the health situation and operation situation, difficult to use electricity data analysis, power consumption characteristics, and insufficient change trends. Intuitive, in-depth and other issues, to accurately outline the overall health and operation situation, and overcome the effect of low visualization

Inactive Publication Date: 2017-10-24
ELECTRIC POWER RES INST OF GUANGDONG POWER GRID
View PDF4 Cites 13 Cited by
  • Summary
  • Abstract
  • Description
  • Claims
  • Application Information

AI Technical Summary

Problems solved by technology

[0004] The embodiment of the present invention provides a power data analysis method, device and intelligent terminal based on the K-line diagram, which solves the problem of using average load curves, maximum load curves, etc. in the prior art to display and analyze power consumption trends of power users The simple form is not intuitive and in-depth enough to present the user's electricity consumption characteristics, changing trends, etc., it is difficult to conduct accurate electricity consumption data analysis, and it is impossible to have an overall grasp of the electricity consumption health and operation situation on the user side of the power industry technical problem

Method used


Image

  • Power data analysis method and device based on K-line graph, and intelligent terminal
  • Power data analysis method and device based on K-line graph, and intelligent terminal
  • Power data analysis method and device based on K-line graph, and intelligent terminal

Examples


Embodiment 1

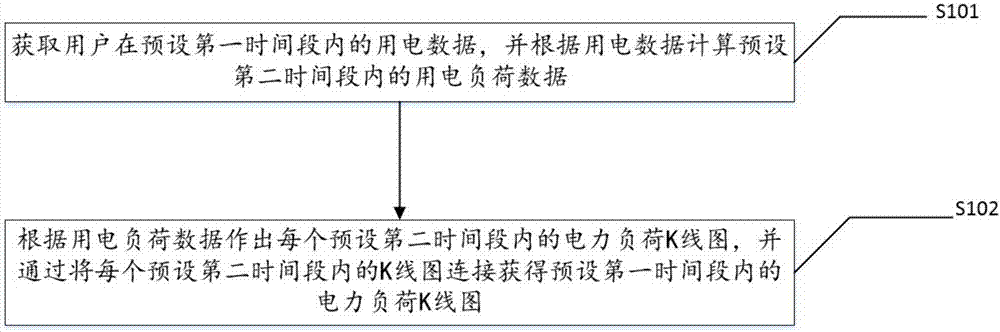
[0049] see figure 1 , a schematic flowchart of an embodiment of a K-line diagram-based power data analysis method provided by an embodiment of the present invention.

[0050] An embodiment of a K-line diagram-based power data analysis method provided in an embodiment of the present invention includes:

[0051] S101. Obtain the electricity consumption data of the user in the preset first time period, and calculate the electricity load data in the preset second time period according to the electricity consumption data. The electricity load data includes maximum load, peak average load, and average load , flat valley average load and minimum load, the preset first time period includes at least one preset second time period.

[0052] It can be understood that the user refers to industrial and commercial users such as schools, hospitals, factories, companies, etc., and can also be a certain region (such as a specific prefecture-level city or a specific town, etc.) or a certain ind...

Embodiment 2

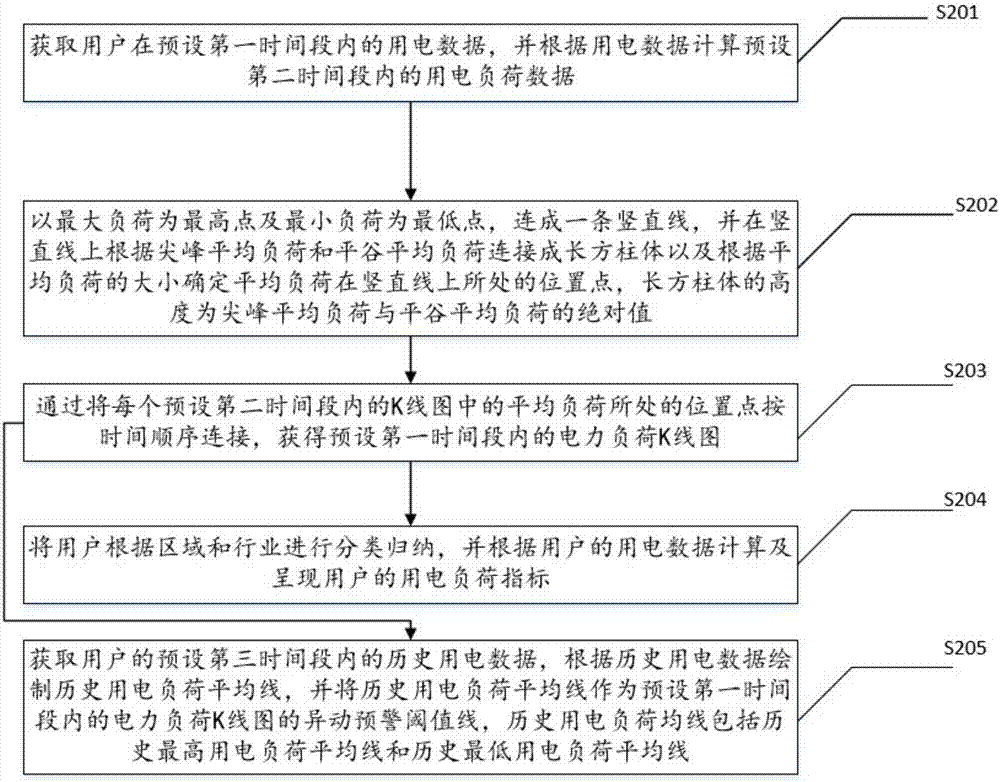
[0064] see figure 2 , a schematic flowchart of another embodiment of a K-line diagram-based power data analysis method provided by an embodiment of the present invention.

[0065] An embodiment of a K-line diagram-based power data analysis method provided in an embodiment of the present invention includes:

[0066] S201. Obtain the electricity consumption data of the user in the preset first time period, and calculate the electricity load data in the preset second time period according to the electricity consumption data. The electricity load data includes maximum load, peak average load, and average load , flat valley average load and minimum load, the preset first time period includes at least one preset second time period.

[0067] The implementation process of S201 is similar to the above-mentioned S101, and will not be repeated here.

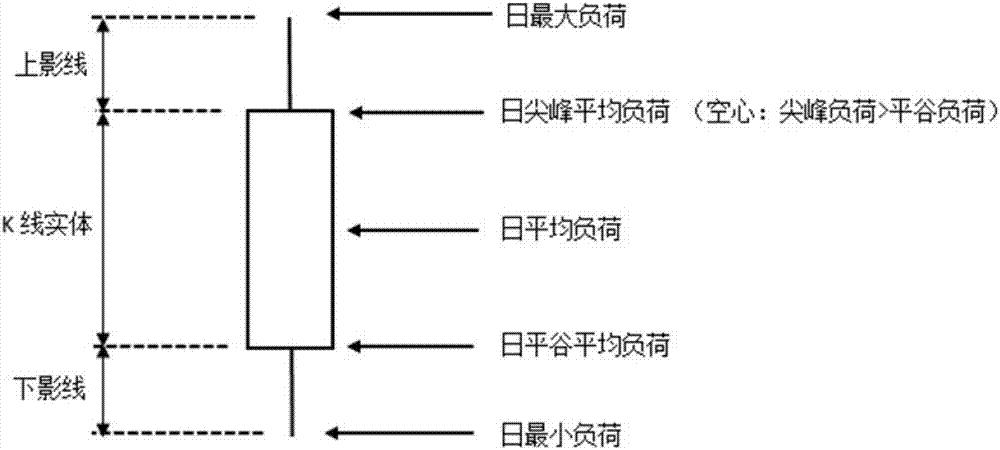
[0068] S202. Take the maximum load as the highest point and the minimum load as the lowest point, connect to form a vertical line, and ...

Embodiment 3

[0095] A K-line diagram-based power data analysis device provided in an embodiment of the present invention includes:

[0096] Calculation module 301, used to obtain the electricity consumption data of the user in the preset first time period, and calculate the electricity load data in the preset second time period according to the electricity consumption data, the electricity load data includes the maximum load, peak average The load, average load, flat valley average load and minimum load, the preset first time period includes at least one preset second time period.

[0097] The drawing module 302 is configured to draw a power load K-line diagram within each preset second time period according to the electricity load data, and obtain a preset first time period by connecting the K-line diagrams within each preset second time period. K-line diagram of power load within a time period;

[0098] The drawing module specifically includes:

[0099] The first drawing sub-module 302...


PUM


Abstract

The invention discloses a power data analysis method and device based on a K-line graph, and an intelligent terminal, aiming to solve the technical problems that in the prior art, the display and analysis of the power users' electricity consumption trend is usually in simple manners such as an average load curve or a maximum load curve, so that the display of the electricity consumption characteristic or change trend of the users is not direct and deep, the electricity consumption data is difficult to be accurately analyzed, and the electricity consumption health condition and running condition of the user side in the power industry cannot be generally known. The method includes acquiring the electricity consumption data of the user in the first preset time period, and calculating the electricity consumption load data in each second preset time period based on the electricity consumption data; making a power load K-line graph in each second preset time period according to the electricity consumption load data, and obtaining the power load K-line graph in the first preset time period by connecting the K-line graphs in the second preset time periods.

Description

technical field [0001] The present invention relates to the field of power data analysis, in particular to a K-line diagram-based power data analysis method, device and intelligent terminal. Background technique [0002] With the transformation of economic development mode, the transformation of energy and power development mode, the adjustment of industrial structure, the advancement of urbanization process, the deepening of power market reform, and the changes of factors such as population environment and climate, my country's cities, especially large-scale The city's electricity demand characteristics, electricity structure, and load characteristics have undergone new changes and presented new features. Under this new situation, power grid companies need to grasp the changes in power demand more accurately, and carry out reasonable marketing strategies according to the characteristics of demand. [0003] In the prior art, the display and analysis of power consumption tren...

Claims


Application Information

Patent Timeline
Patent Type & Authority Applications(China)
IPC IPC(8): H02J3/00
CPCH02J3/00H02J3/003H02J2203/20
Inventor 卢世祥林国营
Owner ELECTRIC POWER RES INST OF GUANGDONG POWER GRID
Why Eureka
Try Eureka