Negative sample selection method against single-type collaborative filtering problems
A collaborative filtering and negative sample technology, applied in the field of Internet recommendation, can solve the problems of not considering the influence of the user's social relationship interests, not considering the user's interest characteristics, etc.
- Summary
- Abstract
- Description
- Claims
- Application Information
AI Technical Summary
Problems solved by technology
Method used
Image

Examples
Embodiment
[0063] Assume that a user set {a, b, c, d, e, f} consisting of 6 users acts on an item set {item1, item2,..., item10} consisting of 10 items. User behavior data records are shown in Table 1. The social relationship here is assumed to be a one-way follow relationship. For example, user a follows user b, then b is a friend of a, but a is not a friend of b. In this embodiment, the specific process of selecting negative samples for user a is introduced in detail. Figure 6 It is a schematic diagram of friends obtained according to the friends following relationship in this embodiment.
[0064] Table 1 User Behavior Data
[0065] user
Items with behavior
follow friends
a
item2, item3, item5
b,c,d
b
item1, item2, item7
a,d
c
item1, item2, item3, item4, item7
a
d
item1, item2, item5, item6
b
e
item1, item5, item7, item9
a,d,c
f
item4, item8, item10, item1
e
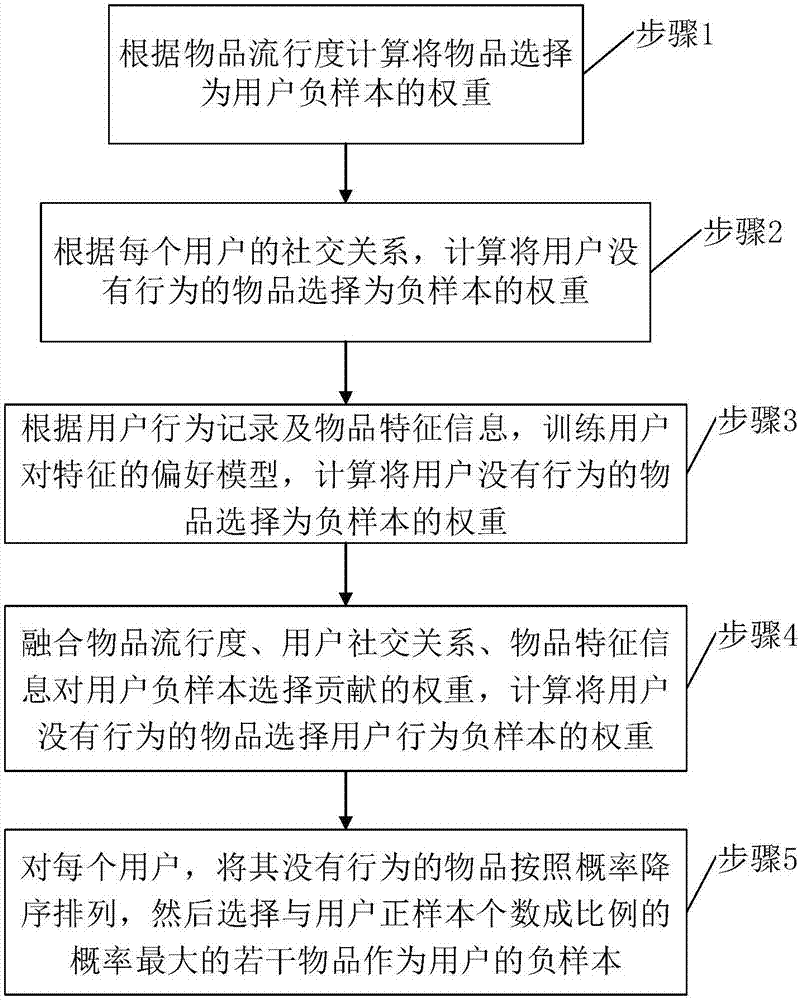
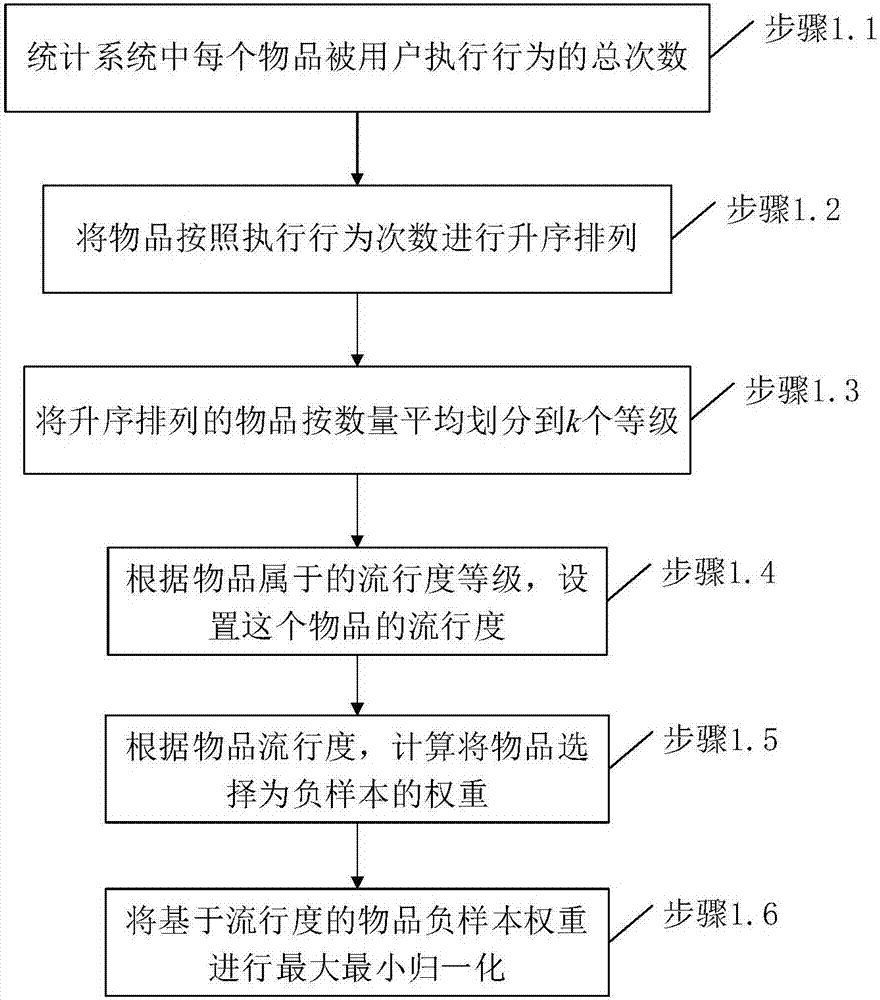
[0066] Step 1: ...
PUM
 Abstract
Description
Claims
Application Information
PatSnap Eureka turns technology decisions into work you can execute. Powered by our Innovation Knowledge Graph, it runs expert workflows across engineering, life sciences, materials and intellectual property. Get your review-ready output in minutes.


