

Image threshold segmentation method based on two-dimensional empirical mode decomposition and genetic algorithm
A technology of empirical mode decomposition and genetic algorithm, which is applied in the field of image threshold segmentation, can solve problems such as not easy to determine the optimal segmentation threshold, over-segmentation, noise sensitivity, etc., and achieve good and complete segmentation results
- Summary
- Abstract
- Description
- Claims
- Application Information
AI Technical Summary
Problems solved by technology
Method used
Image

Examples
Embodiment 1
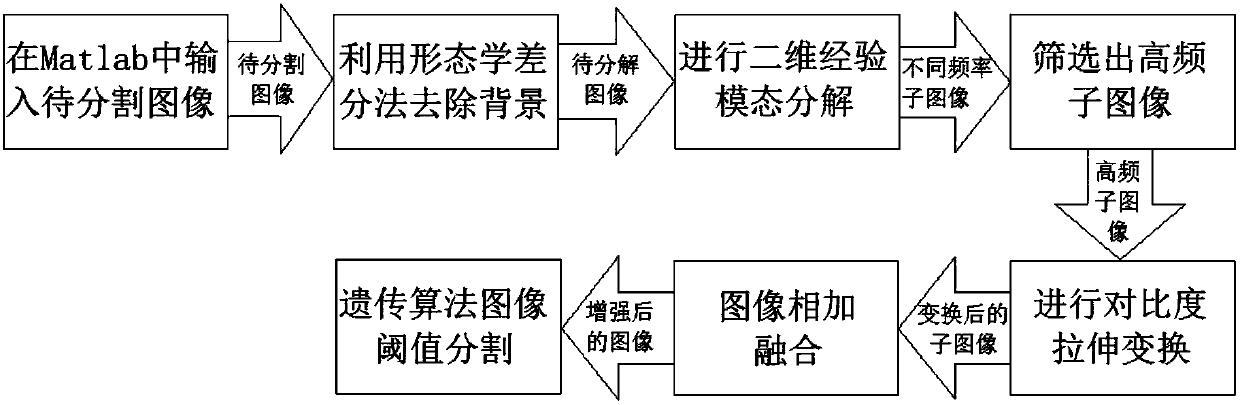
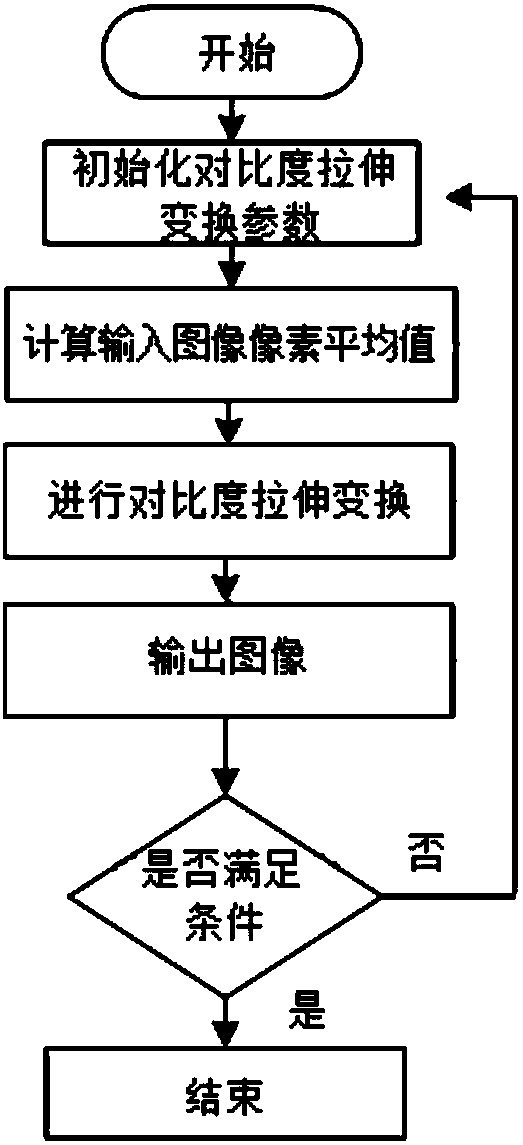
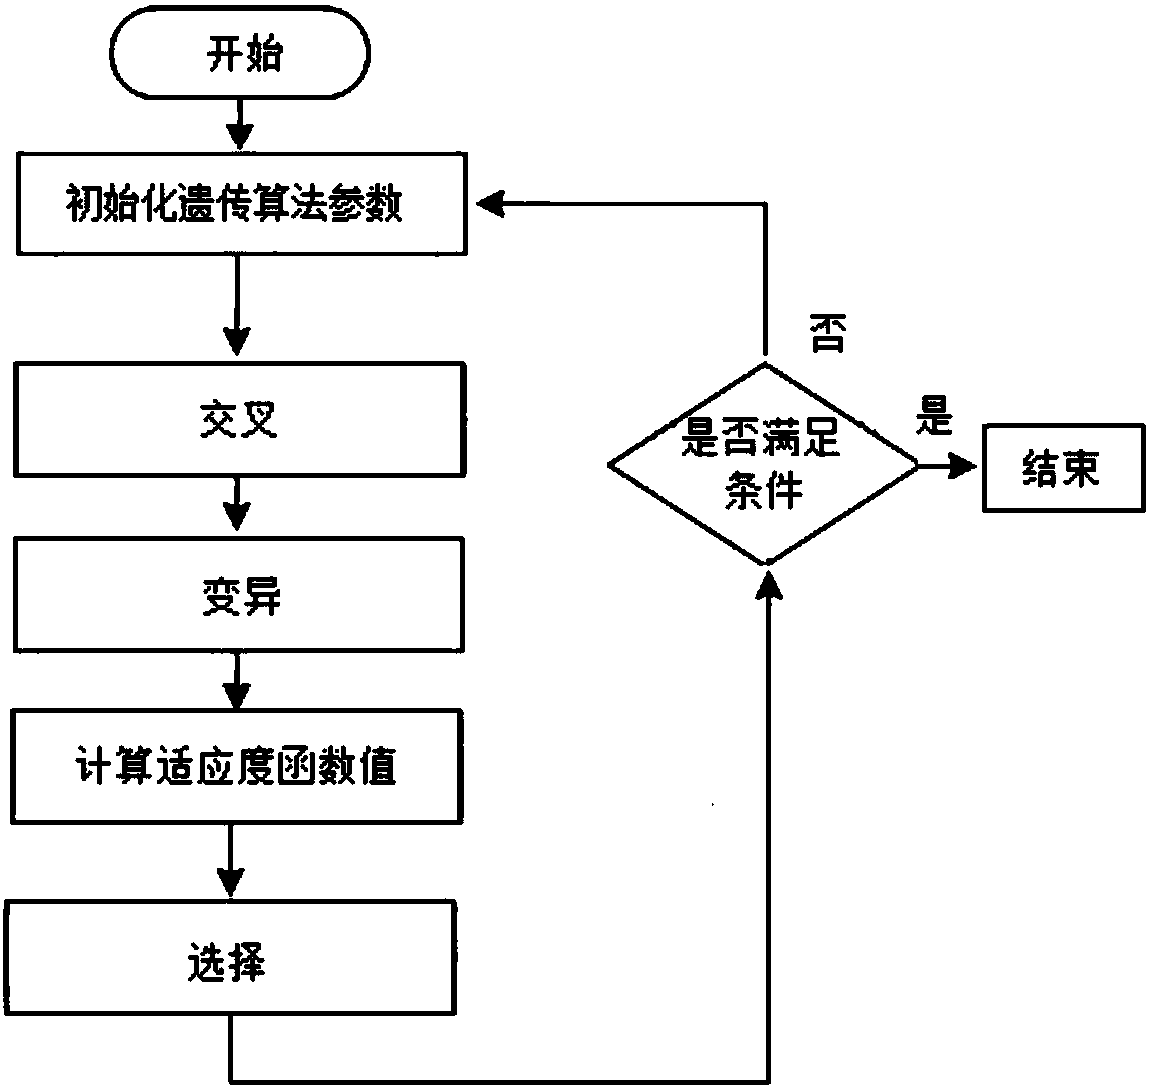
[0051] Embodiment 1: as Figure 1-12 As shown, an image threshold segmentation method based on two-dimensional empirical mode decomposition and genetic algorithm, input an image to be segmented, remove the background of the image through the morphological difference method, and obtain the difference image d(x,y), and then A series of intrinsic mode functions IMF(x,y) and the remainder REF are obtained by decomposing the two-dimensional empirical mode decomposition algorithm; the series of intrinsic mode functions IMF(x,y) are represented as sub-images of different frequencies, and removal cannot Low-frequency sub-images that represent detailed information, and high-frequency sub-images are screened out; then the contrast stretching transformation algorithm is used to perform contrast stretching transformation on high-frequency sub-images; then the transformed high-frequency sub-images are added and fused to obtain the enhanced image Image H; Finally, threshold segmentation is ...
PUM
 Abstract
Description
Claims
Application Information