Supercharge Your Innovation With Domain-Expert AI Agents!

Electric power big data visualization dynamic adjustment system

A dynamic adjustment, big data technology, applied in data processing applications, visual data mining, structured data retrieval, etc., can solve the problem of limited manual processing level of drag and drop operators, insufficient degree of automatic processing, and messy charts. And other issues

Active Publication Date: 2019-01-18
山东电力高等专科学校
View PDF6 Cites 0 Cited by
  • Summary
  • Abstract
  • Description
  • Claims
  • Application Information

AI Technical Summary

Problems solved by technology

CN108268201A provides a power data chart processing method based on dragging and recalculation, which can form a plurality of neatly arranged and concise power charts by dragging a complex power data chart, and further solves the problem of complex charts when they are displayed. Often forms a bunch of "messy" questions
However, the dragging process still requires manual operation, and the degree of automatic processing is not particularly sufficient, and it is limited by the manual processing level of the dragging operator.

Method used


Image

  • Electric power big data visualization dynamic adjustment system

Examples


Embodiment Construction

[0006] In order to make the object, technical solution and advantages of the present invention clearer, the present invention will be further described in detail with reference to the accompanying drawings. This description presents, by way of illustration and not limitation, specific embodiments consistent with the principles of the invention in sufficient detail to enable those skilled in the art to practice the invention without departing from this disclosure. Other embodiments may be utilized and the structure of elements may be changed and / or substituted within the scope and spirit of the invention. Accordingly, the following detailed description should not be read in a limiting sense.

[0007] The present invention will be further described below by way of examples, but not limitation of the present invention.

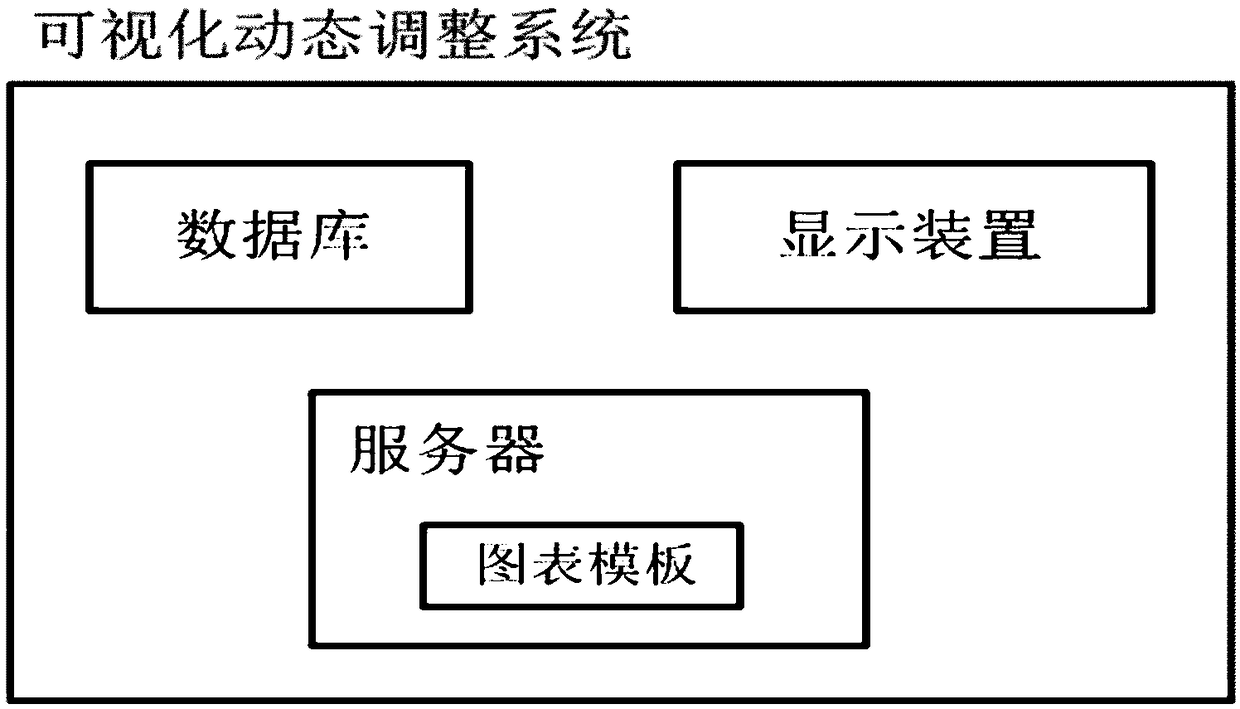
[0008] According to the present invention, there is provided a dynamic adjustment system for big data visualization of electric power, including: a database sto...


PUM


Abstract

The invention relates to an electric power big data visualization dynamic adjustment system, which is characterized in that the system comprises a database for storing data to be displayed, a server for processing the data to be displayed and a display device (for example, a display device), wherein a plurality of chart templates for displaying the data to be displayed on the display device are also stored in the server.

Description

technical field [0001] The invention belongs to the field of electric power data chart processing, and in particular relates to a dynamic adjustment system for visualizing large electric power data. Background technique [0002] Data visualization technology is developing at a high speed. Through visualization, users can intuitively obtain a large amount of data information. Baidu's ECharts is an open-source visualization library implemented using JavaScript, which can run smoothly on PCs and mobile devices, and is compatible with most current browsers (IE8 / 9 / 10 / 11, Chrome, Firefox, Safari, etc.), providing big data Visualization provides a shortcut to rapid implementation. [0003] In the case of many data content items (such as electric power big data), the visualization of big data through two-dimensional or 2.5-dimensional charts will also cause display confusion caused by many content items in the chart, making it impossible for users to view from the Obtain informati...

Claims


Application Information

Patent Timeline
IPC IPC(8): G06F16/26G06Q50/06
CPCG06Q50/06
Inventor 王雪筠张晓蓉王乃玉徐珊珊侯雪莲
Owner 山东电力高等专科学校
Features
  • R&D
  • Intellectual Property
  • Life Sciences
  • Materials
  • Tech Scout
  • Unparalleled Data Quality
  • Higher Quality Content
  • 60% Fewer Hallucinations
Learn More