Implementation method for drawing web frequency diagram plug-in
An implementation method and technology of frequency graph, applied in the front-end field of the web, can solve the problem that the characteristics of the frequency band cannot be displayed well, and achieve the effect of intuitive display, simple drawing, and improvement of development efficiency
- Summary
- Abstract
- Description
- Claims
- Application Information
AI Technical Summary
Problems solved by technology
Method used
Image
Examples
Embodiment Construction
[0015] A Bézier curve, also known as a Bézier curve or a Bézier curve, is a mathematical curve applied to two-dimensional graphics applications. The design principle of the present invention is: add a self-defined third point to the one-dimensional frequency segment, and then draw it with a two-dimensional quadratic Bezier curve, so that the frequency map can be displayed clearly and beautifully .
[0016] The present invention is a method for drawing frequency diagrams based on quadratic Bezier curves and canvas labels, comprising the following steps:
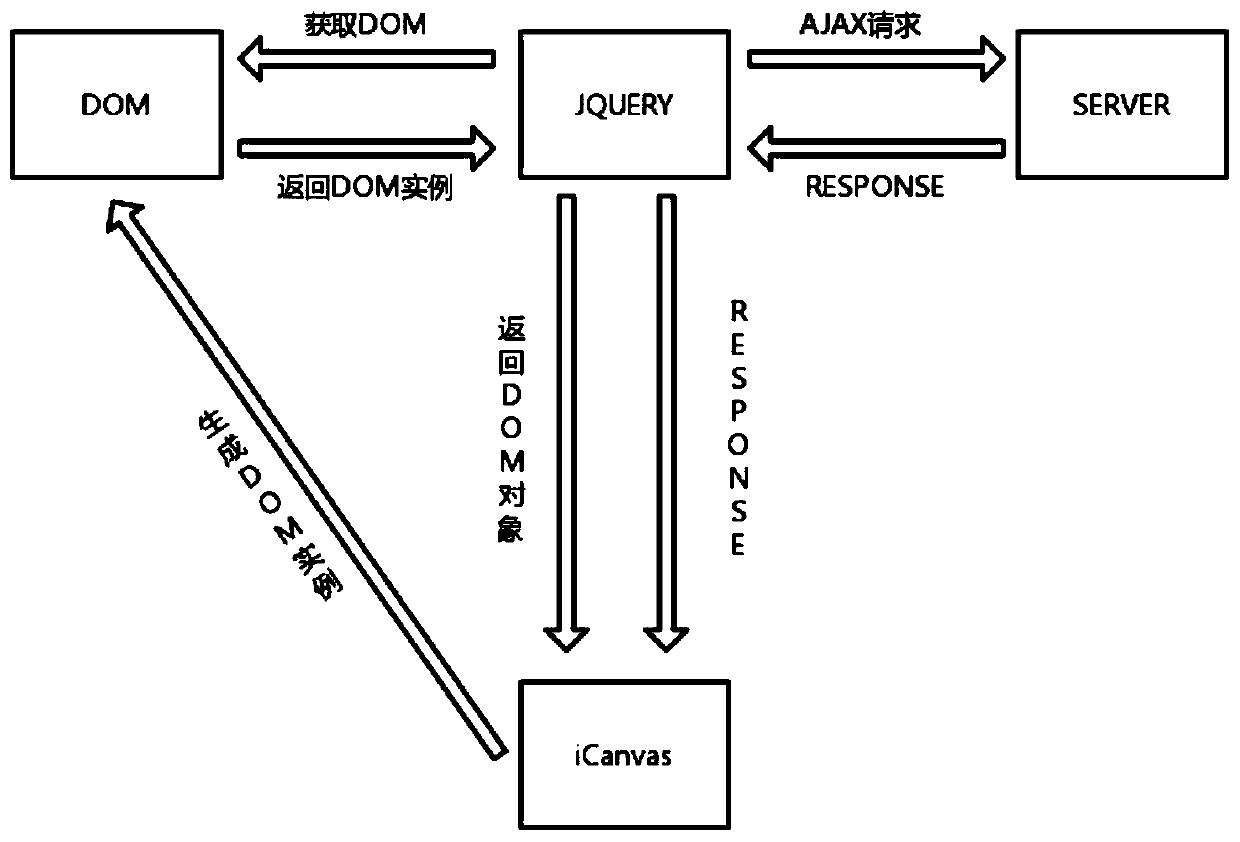
[0017] After the web program starts, when entering the H5 page, the plug-in is initialized.
[0018] Call the init method of the plug-in to draw the canvas drawing module in the corresponding H5 tag.
[0019] Use the setOption method in the plug-in to input relevant parameters to configure the parameters of the frequency graph (the displayed frequency range and the displayed frequency segment array). First, draw the coordina...
PUM
 Abstract
Description
Claims
Application Information
 - R&D
- Intellectual Property
- Life Sciences
- Materials
- Tech Scout
- Unparalleled Data Quality
- Higher Quality Content
- 60% Fewer Hallucinations
Browse by: Latest US Patents, China's latest patents, Technical Efficacy Thesaurus, Application Domain, Technology Topic, Popular Technical Reports.
© 2025 PatSnap. All rights reserved.Legal|Privacy policy|Modern Slavery Act Transparency Statement|Sitemap|About US| Contact US: help@patsnap.com

