Method for displaying enterprise association relationship graph based on d3

A technology of association relationship and graph, which is applied in the display field of enterprise association relationship graph, and can solve problems such as poor page fluency and poor user experience

Active Publication Date: 2020-03-17
ZHEJIANG UNIV OF TECH
View PDF7 Cites 5 Cited by
  • Summary
  • Abstract
  • Description
  • Claims
  • Application Information

AI Technical Summary

Problems solved by technology

[0004] In order to solve the disadvantages of poor user experience and poor page fluency in the existing map display, the present invention provides a d3-based display method of an enterprise association map with good user experience and good page fluency

Method used


Image

  • Method for displaying enterprise association relationship graph based on d3
  • Method for displaying enterprise association relationship graph based on d3

Examples


Embodiment Construction

[0032] The present invention will be further described below in conjunction with the accompanying drawings and embodiments.

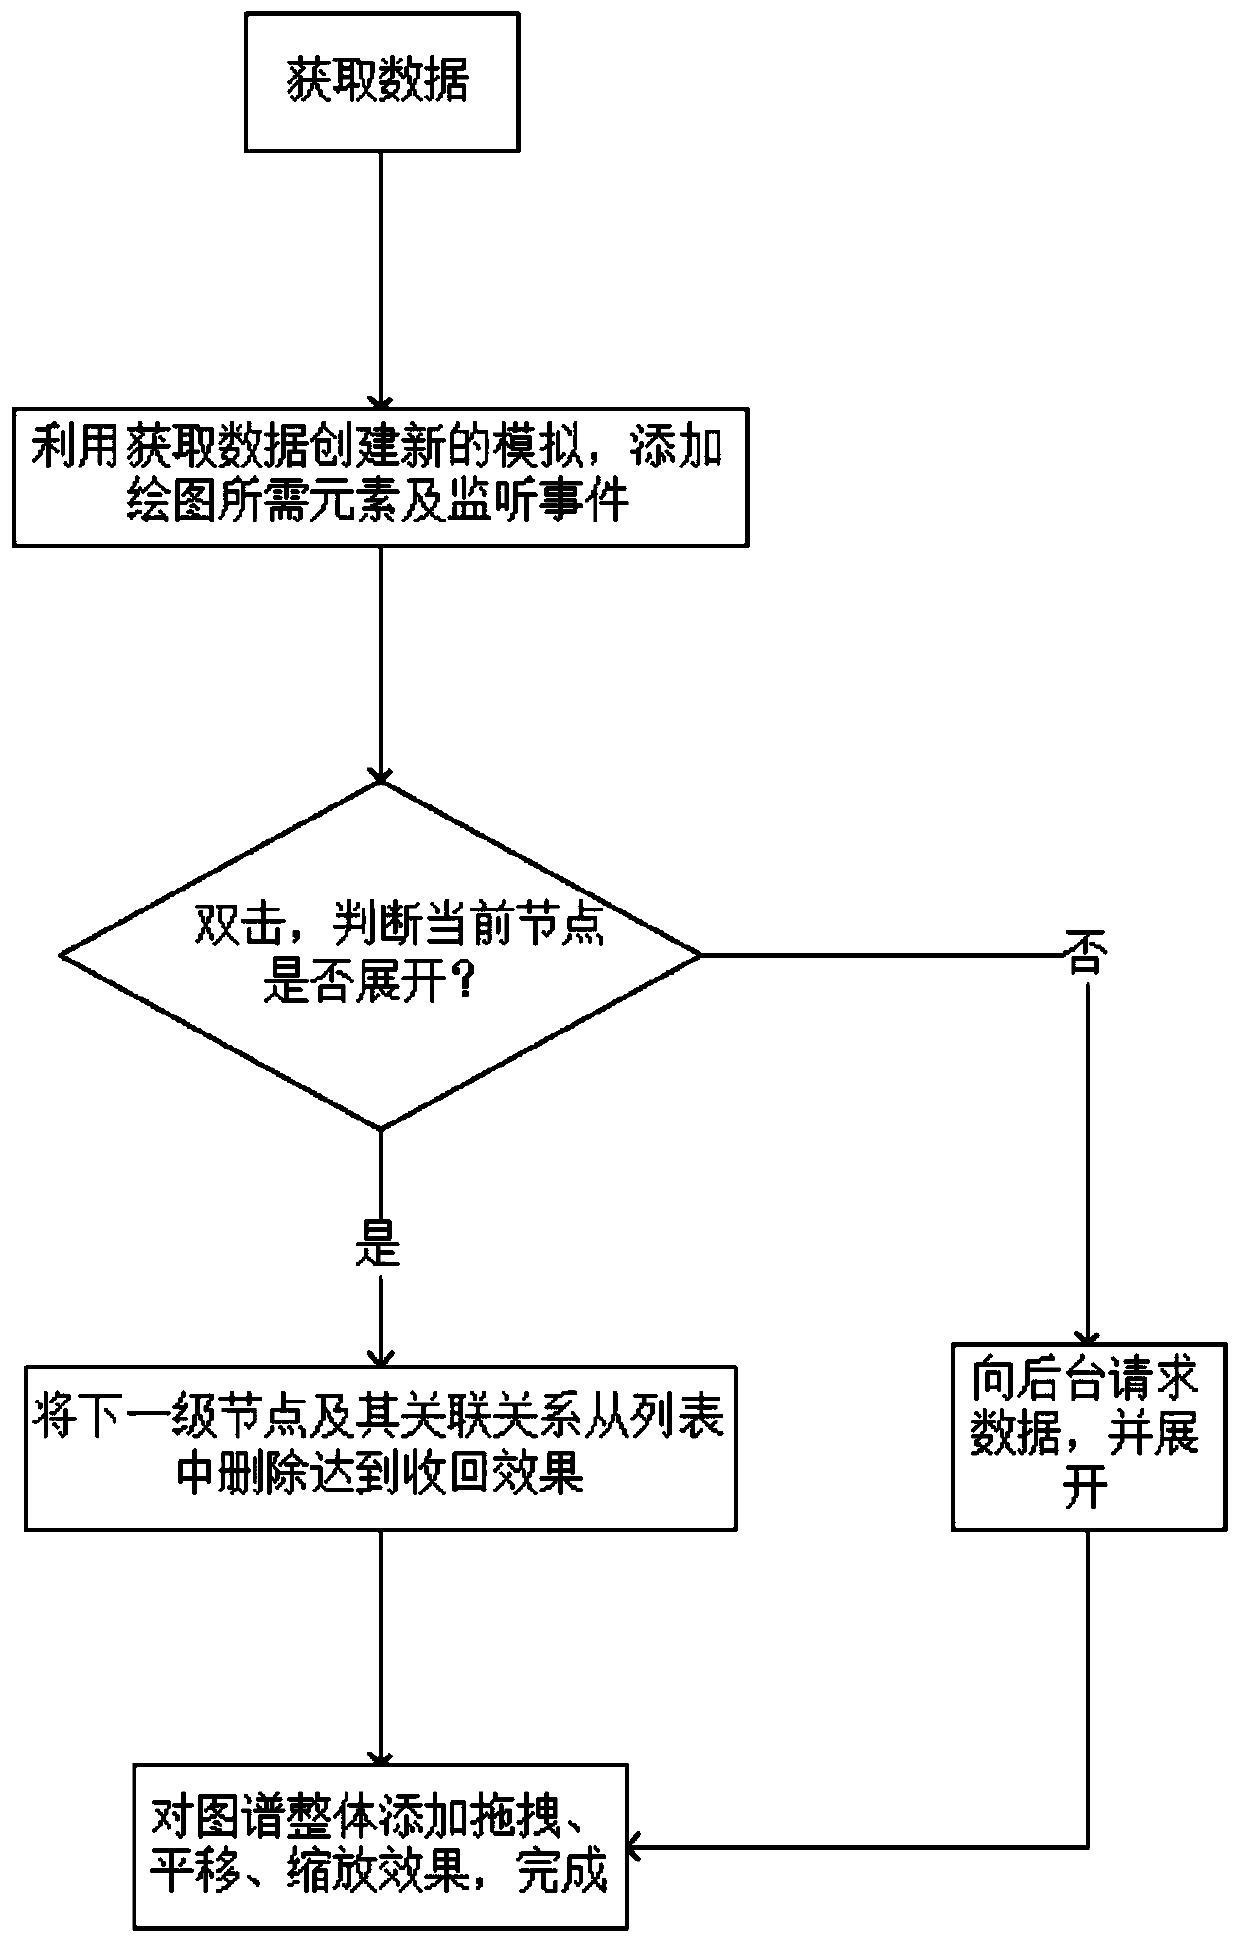
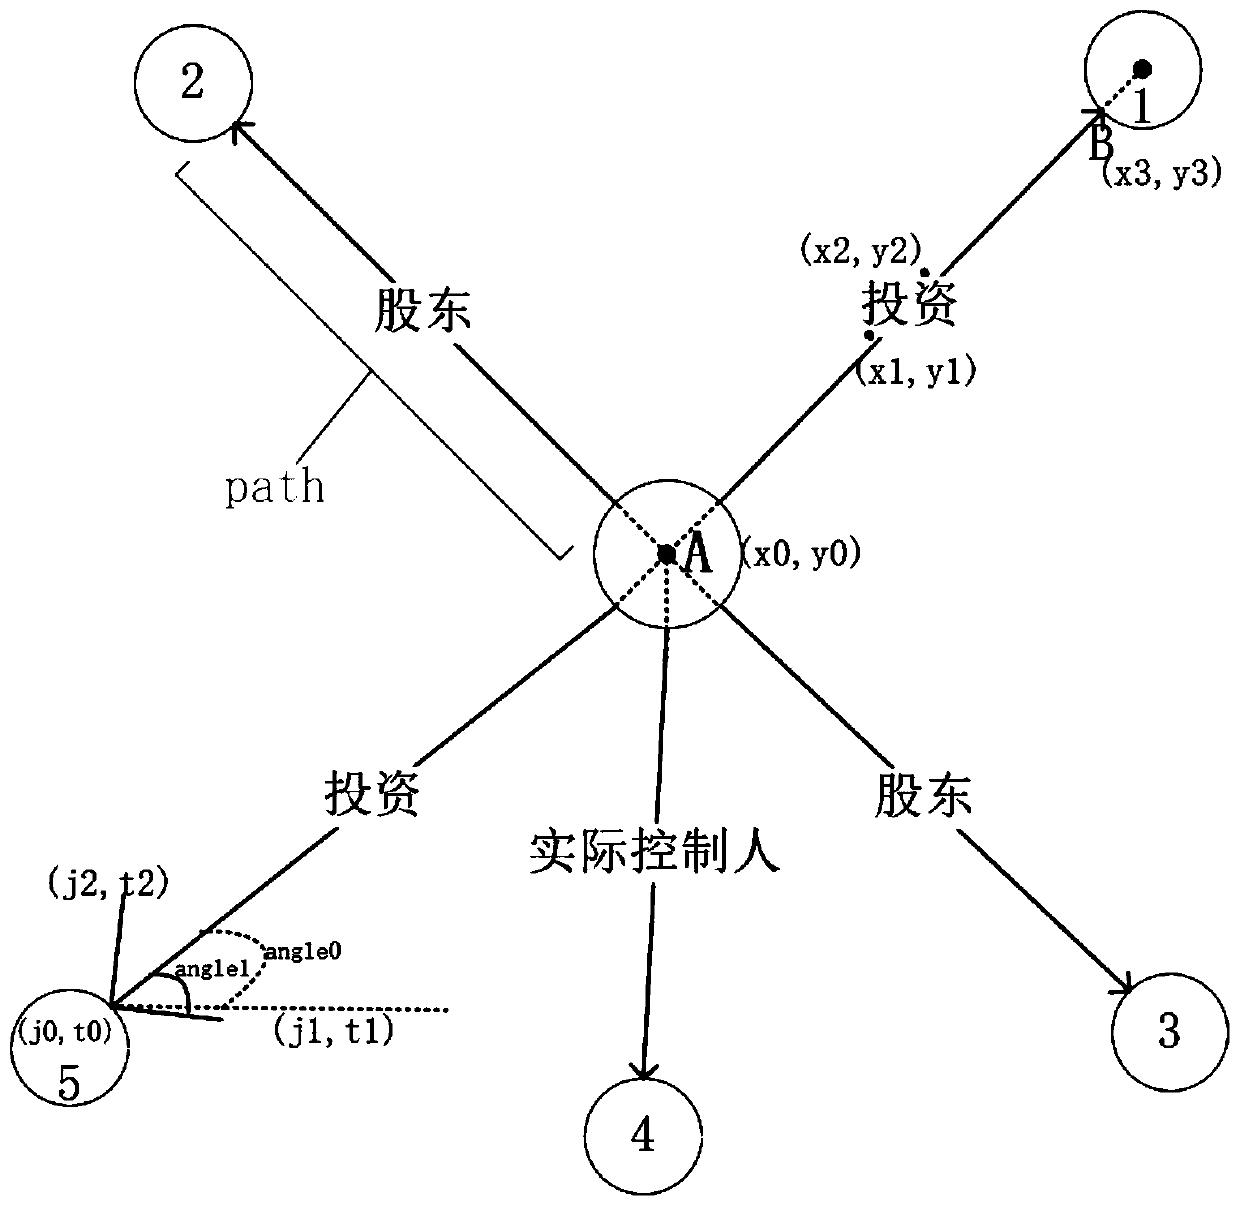
[0033] refer to figure 1 and figure 2 , a method for displaying a d3-based enterprise relationship graph, comprising the following steps:

[0034] S1 gets relational data

[0035] The organization's internal data, third-party data, and data crawled from mainstream websites using web crawlers are stored and analyzed to form the data required to complete the map. Data D is mainly composed of two parts: node data N and edge data E. The node data N includes basic information such as entity name, entity id, entity category, registered capital, and creation time, and the edge data E includes sourceid, targetid, and edge type. After the acquired data D is encapsulated into an object by the tool class, it is serialized by the fastjson package and returned to a json file. The data in json format is easier to render at the front end.

[0036] S2 builds a rel...


PUM


Abstract

The invention discloses a method for displaying an enterprise association relationship graph based on d3, which comprises the following steps of S1, obtaining relationship data D required for drawing,performing serialization operation by a fastjson package after the obtained data D is packaged into an object through a tool class, and returning a json file; S2, creating a new forceSimulation by utilizing the D, defining an svg canvas, calling a tick method to obtain node coordinates (x, y) in real time, based on a node array N and an edge array E of the layout, adding three graphic elements required for drawing: line, circle and text, and binding attributes in the data N and the data E with the three graphic elements; and S3, realizing functions of double-click node expansion and double-click node deletion for an existing map, updating page data in real time according to operation, and only retaining data displayed on a page. The method is good in user experience and good in page fluency.

Description

technical field [0001] The invention relates to a display method of a d3-based enterprise association relationship map. Background technique [0002] Nowadays, as the number of enterprises continues to increase, enterprise data is also increasing and accumulating. Through the enterprise map, we can query the multi-dimensional information of enterprises, deeply dig the links between enterprises and enterprises, and between enterprises and individuals, so as to see the relationship between enterprises. Insight into enterprise customer value and risk. When using the map to represent the relationship between enterprises (or individuals), it can be more convenient, intuitive, and concise to show the relationship between enterprises and enterprises, individuals and individuals, and individuals and enterprises, which can better meet user needs or assist users. Analysis to support risk control and decision-making. Especially in the financial industry, effective data from customers...

Claims


Application Information

Patent Timeline
Patent Type & Authority Applications(China)
IPC IPC(8): G06F16/901G06F16/904
CPCG06F16/9024G06F16/904
Inventor 徐东伟孙佳慧顾淳涛俞山青
Owner ZHEJIANG UNIV OF TECH
Why Eureka
Try Eureka