Data display method and device

A data display and historical data technology, applied in data processing applications, instruments, finance, etc., can solve the problems of large amount of calculation, small income, waste, etc., and achieve the effect of reducing calculation work

Pending Publication Date: 2020-03-17
BANK OF CHINA
View PDF4 Cites 0 Cited by
  • Summary
  • Abstract
  • Description
  • Claims
  • Application Information

AI Technical Summary

Problems solved by technology

[0002] In the existing technology, there are many kinds of financial products. Due to the different types and returns of various financial products, users often need to pay a lot of calculation work to obtain financial products that meet their requirements, and there are still small returns. Question: Banks or related financial industry service personnel have a deeper understanding of most financial products than ordinary users, but because the daily data of each financial product has varying degrees of change, when it is necessary to provide product references for users , it is also necessary to understand the data changes of various financial products in real time, and give certain references based on experience, which cannot guarantee the optimality of the combination, resulting in the premise of wasting a lot of energy, still unable to obtain the user's optimal combination plan; secondly , due to the differences in the needs of different users, combined with the real-time changes of various financial products, the staff often need to spend a lot of energy to complete the screening from a large number of financial products when facing the needs of users, and the work efficiency is extremely low
[0003] Based on this, in the current financial field, due to the real-time changes in the data of various financial products, there are many ways to combine them, and the overall calculation amount is huge, which makes it impossible for the staff in the industry to effectively improve work efficiency and screen Develop a suitable financial product portfolio plan

Method used


Image

  • Data display method and device
  • Data display method and device
  • Data display method and device

Examples


Embodiment Construction

[0025] The implementation of the present invention will be described in detail below in conjunction with the accompanying drawings and examples, so as to fully understand and implement the process of how to apply technical means to solve technical problems and achieve technical effects in the present invention. It should be noted that, as long as there is no conflict, each embodiment and each feature of each embodiment in the present invention can be combined with each other, and the formed technical solutions are all within the protection scope of the present invention.

[0026] In the description of this specification, the words "comprising", "comprising", "having", "containing" and so on are all open terms, meaning including but not limited to. A description referring to the terms "one embodiment," "a particular embodiment," "some embodiments," "for example," etc., means that a particular feature, structure, or characteristic described in connection with the embodiment or ex...


PUM


Abstract

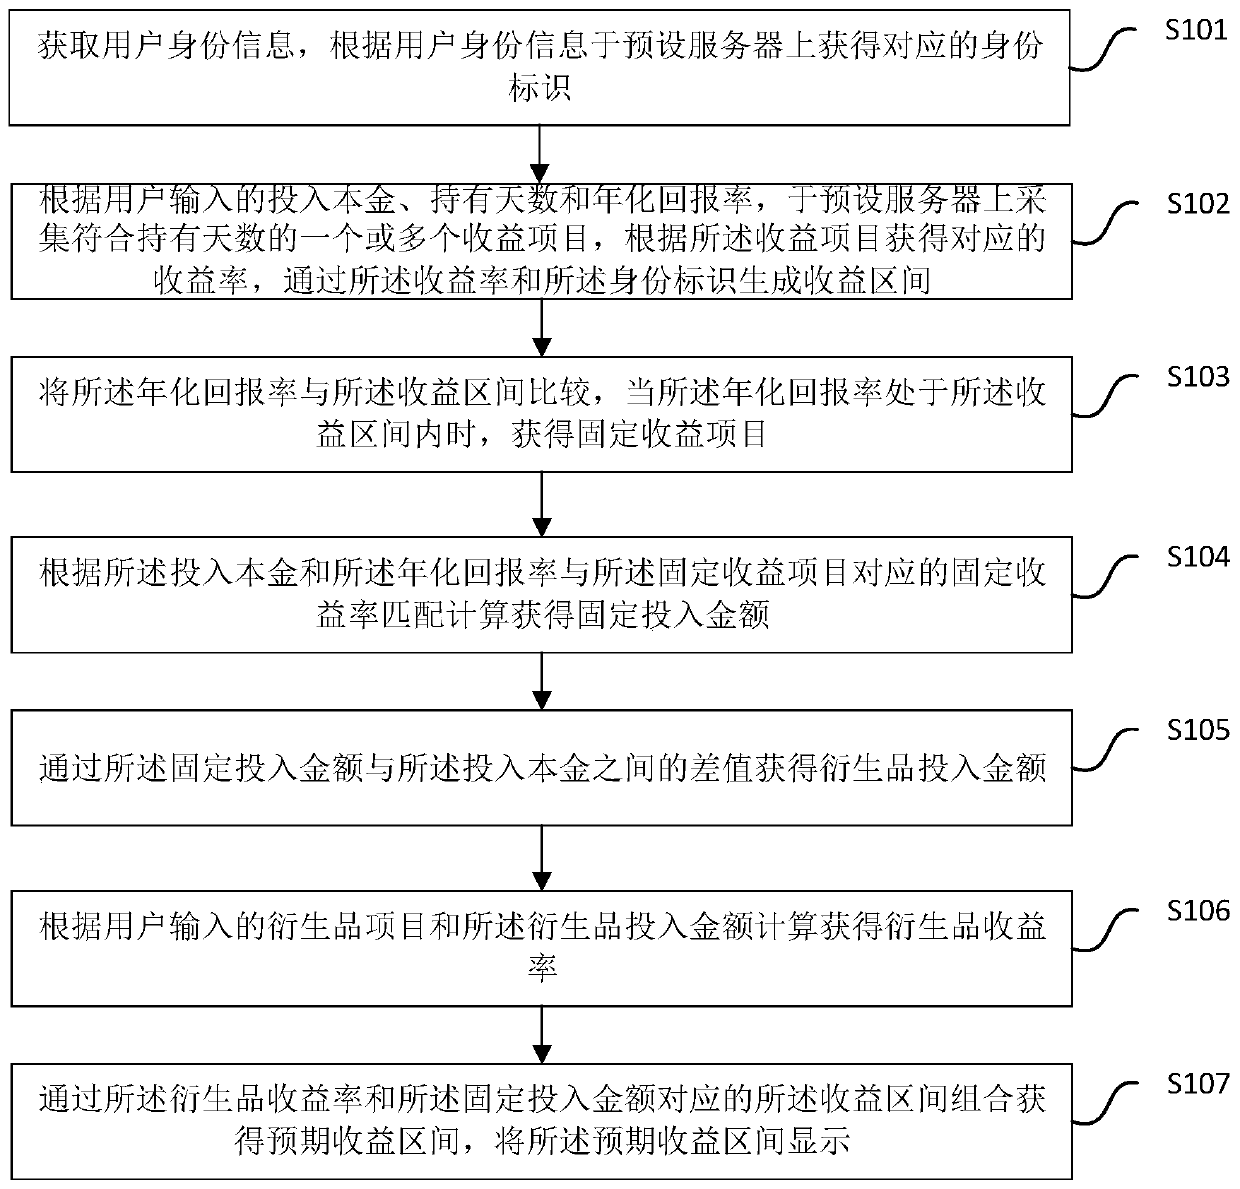
The invention discloses a data display method and device, and the method specifically comprises the steps: obtaining the identity information of a user, and obtaining a corresponding identity label ona preset server according to the identity information of the user; according to the input principal, the number of holding days and the annual return rate input by the user, collecting one or more income items on a preset server, obtaining a corresponding income rate, and generating an income interval through the income rate and the identity identifier; comparing the annual return rate with the income interval, and obtaining a fixed income project when the annual return rate is within the income interval; performing matching calculation according to the input principal and the annual return rate and a fixed yield corresponding to the fixed yield project to obtain a fixed input amount; obtaining the derivative input amount through the difference value between the fixed input amount and theinput principal; calculating to obtain a derivative yield according to the derivative project and the derivative investment amount input by the user; and obtaining an expected income interval throughthe combination of the derivative yield and the income interval corresponding to the fixed investment amount, and displaying the expected income interval.

Description

technical field [0001] The invention relates to the field of graphic data display, in particular to a data display method and device. Background technique [0002] In the existing technology, there are many kinds of financial products. Due to the different types and returns of various financial products, users often need to pay a lot of calculation work to obtain financial products that meet their requirements, and there are still small returns. Question: Banks or related financial industry service personnel have a deeper understanding of most financial products than ordinary users, but because the daily data of each financial product has varying degrees of change, when it is necessary to provide product references for users , it is also necessary to understand the data changes of various financial products in real time, and give certain references based on experience, which cannot guarantee the optimality of the combination, resulting in the premise of wasting a lot of ener...

Claims


Application Information

Patent Timeline
Patent Type & Authority Applications(China)
IPC IPC(8): G06Q40/06H04L29/06
CPCG06Q40/06H04L63/0876
Inventor 金业胡宁宁刘儒军
Owner BANK OF CHINA
Why Eureka
Try Eureka