River delta facies sand body configuration prediction method
A prediction method, delta technology, applied in the field of oil and gas field mining geological research, to achieve the effect of improving prediction accuracy
- Summary
- Abstract
- Description
- Claims
- Application Information
AI Technical Summary
Problems solved by technology
Method used
Image

Examples
Embodiment 1
[0025] The present invention proposes a method for predicting the architecture of river delta facies sand body, comprising the following steps:
[0026] S001: Obtain the gamma ray detection response curve of each single well in the target depth interval;
[0027] S002: According to the gamma ray detection response curve, count the sand body thickness of each single well in the target depth interval, and draw the sand body thickness distribution plan;
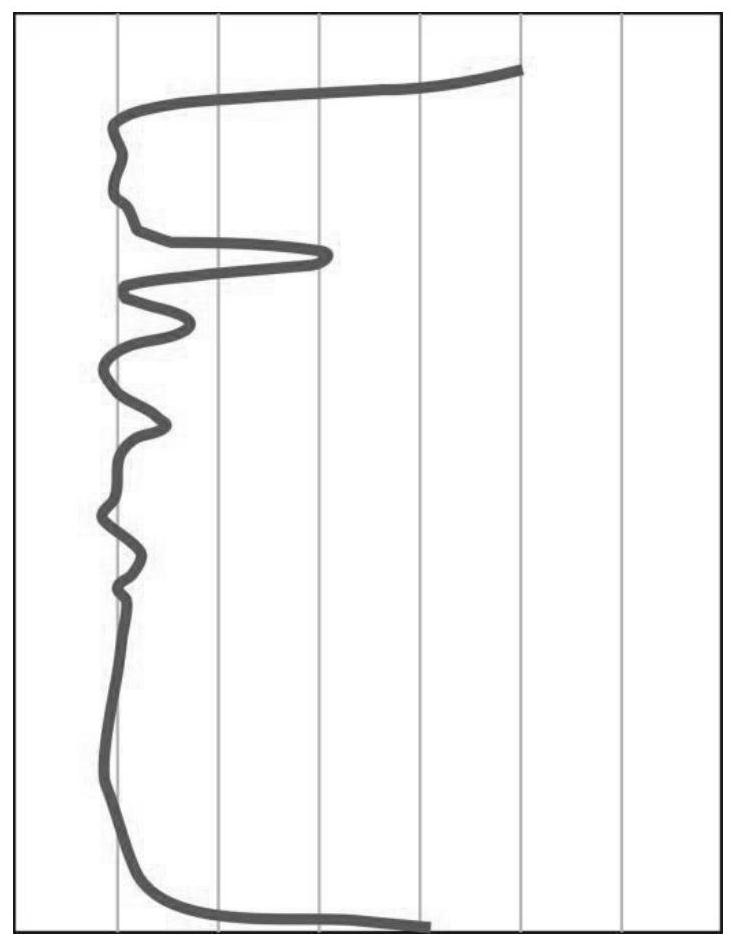
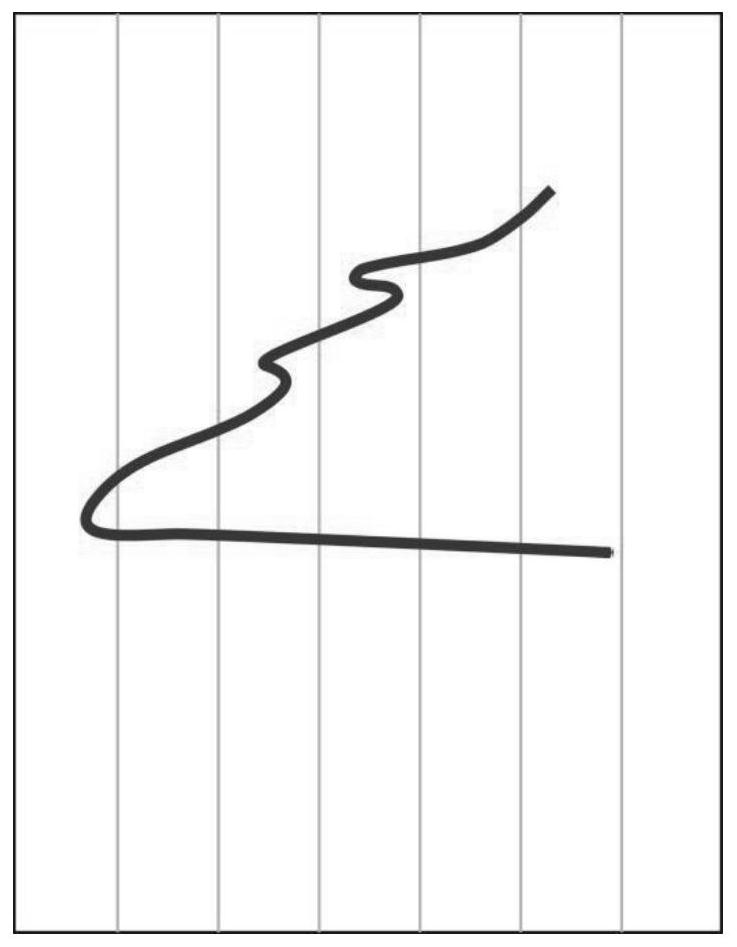
[0028] S003: Distinguish the box curve and the bell curve from the gamma ray detection response curve according to the shape;
[0029] S004: Mark the box-shaped curve and bell-shaped curve distinguished from the gamma-ray detection response curve next to the corresponding well position in the sand body thickness contour map, and circle the box-shaped curve corresponding to the box-shaped curve in the figure area and the bell-shaped area corresponding to the bell curve.
Embodiment 2
[0031] S001: Obtain the gamma ray detection response curve of each single well in the target depth interval;
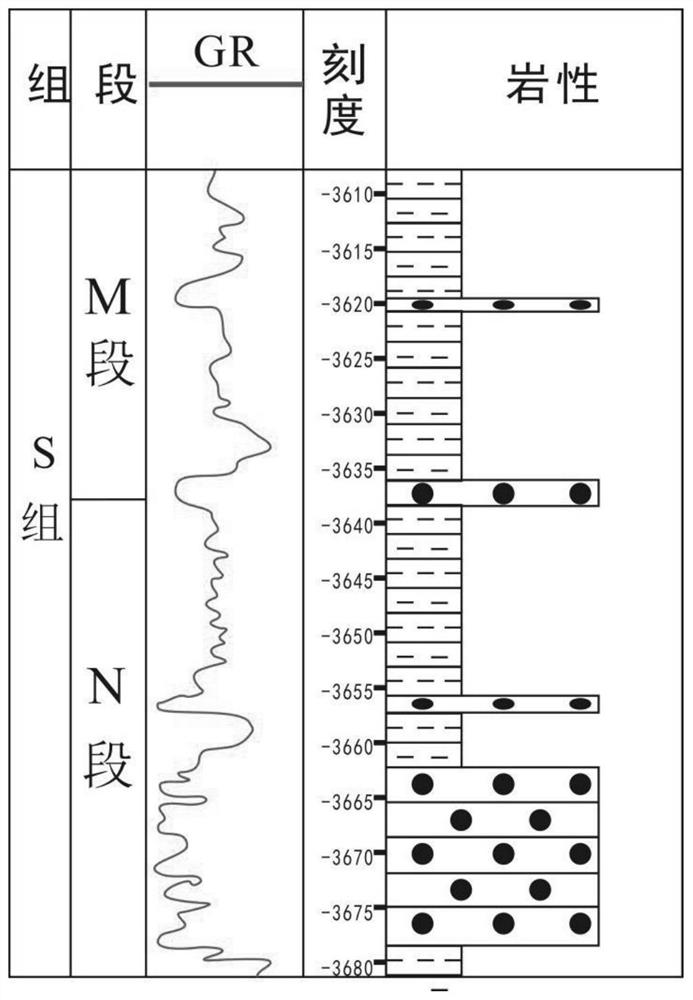
[0032] like figure 1 As shown, in step S001, a gamma ray detection device is deployed to detect each single well in the block, and the gamma ray detection response curve of each single well in the target depth interval is obtained. The gamma ray detection device belongs to the prior art.
[0033] Each single well in this gas reservoir area has been drilled and gamma-ray detection has been carried out earlier, so it is only necessary to collect the gamma-ray detection data and reservoir configuration data of the single well in this gas reservoir block. Each single well data is processed in the text software, such as figure 1 As shown, the layer and thickness of the sandstone are clarified.
Embodiment 3
[0035] S002: According to the gamma ray detection response curve, count the sand body thickness of each single well in the target depth interval, and draw the sand body thickness distribution plan;
[0036] like Figure 4 and Figure 5 , in step S002, according to the intensity of the detected gamma ray detection response curve of each single well, the corresponding sand body position is distinguished, the sand body thickness of the target layer is obtained, the equivalent interval is set for the sand body thickness, and then the sand body is drawn Plane map of body thickness equivalent distribution.
[0037] Among them, the depth range of the target layer is 3606m-3678m, and the equivalent interval of sand body thickness is 3m. In this gas reservoir area, when the gamma ray detection reaction intensity GR Figure 4 and Figure 5 In , each black dot represents the location of a single well.
PUM
 Abstract
Description
Claims
Application Information
 - R&D
- Intellectual Property
- Life Sciences
- Materials
- Tech Scout
- Unparalleled Data Quality
- Higher Quality Content
- 60% Fewer Hallucinations
Browse by: Latest US Patents, China's latest patents, Technical Efficacy Thesaurus, Application Domain, Technology Topic, Popular Technical Reports.
© 2025 PatSnap. All rights reserved.Legal|Privacy policy|Modern Slavery Act Transparency Statement|Sitemap|About US| Contact US: help@patsnap.com