A method and system for generating heat map considering spatial density differences

A space density and heat map technology, which is applied to instruments, other database browsing/visualization, geographic information databases, etc., can solve problems affecting the expression of heat maps, and achieve the effect of avoiding too deep segmentation and simplifying huge calculations

Active Publication Date: 2022-08-02
HUBEI UNIV
View PDF1 Cites 0 Cited by
  • Summary
  • Abstract
  • Description
  • Claims
  • Application Information

AI Technical Summary

Problems solved by technology

[0007] In view of this, the present invention proposes a thermal map generation method that takes into account the difference in spatial density to solve the problem of affecting the expression of thermal maps due to unreasonable bandwidth settings

Method used


Image

  • A method and system for generating heat map considering spatial density differences
  • A method and system for generating heat map considering spatial density differences
  • A method and system for generating heat map considering spatial density differences

Examples


Embodiment Construction

[0057] The technical solutions in the embodiments of the present invention will be clearly and completely described below in conjunction with the embodiments of the present invention. Obviously, the described embodiments are only a part of the embodiments of the present invention, but not all of the embodiments. Based on the embodiments of the present invention, all other embodiments obtained by persons of ordinary skill in the art without creative efforts shall fall within the protection scope of the present invention.

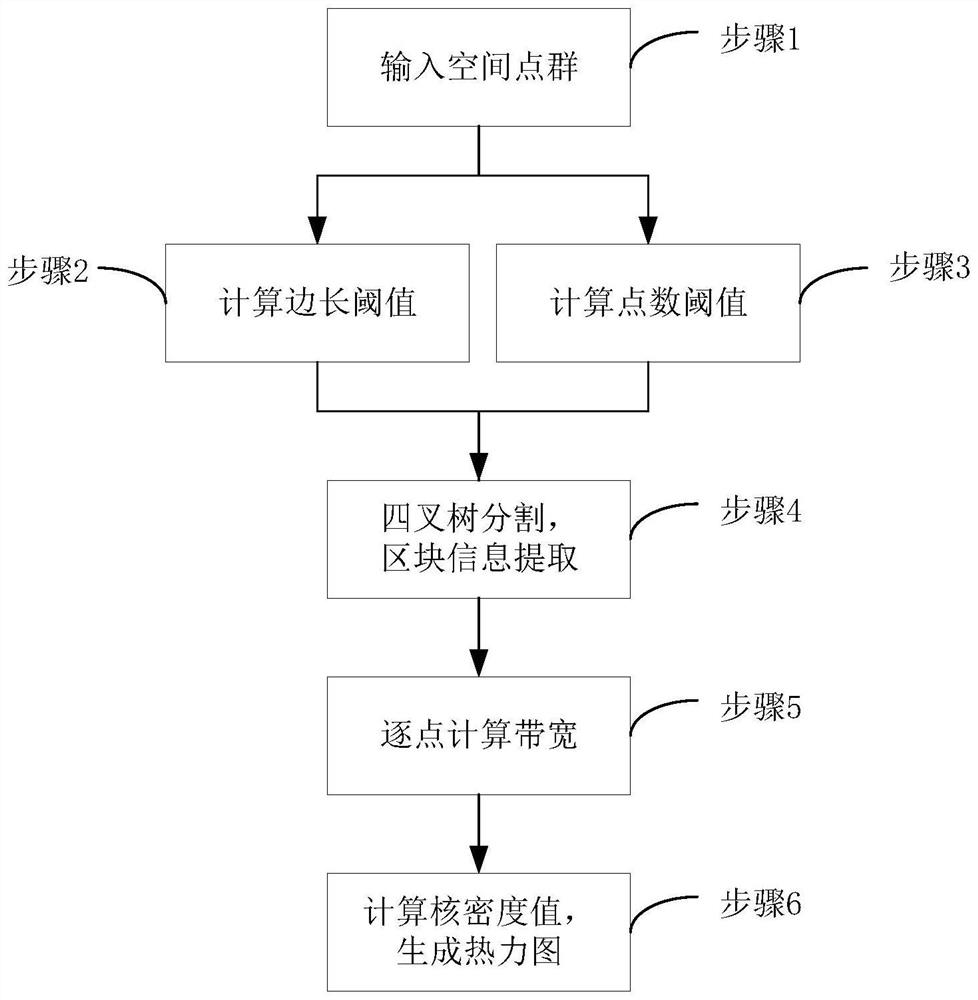
[0058] like figure 1 As shown, the present invention proposes a method for generating a heat map considering spatial density differences, including the following steps:

[0059] Step 1: Collect the experimental data of the selected research objects and research areas, and save them in the form of spatial point groups; specifically, select the corresponding research areas and research objects according to the experimental purpose, collect experimental data, an...


PUM


Abstract

The invention discloses a method and system for generating a heat map taking into account differences in spatial density. The method includes: collecting experimental data and saving it in the form of a spatial point group; The true distance is used as the side length threshold of quadtree segmentation; the number of the spatial point group is counted, and the point number threshold is calculated; the quadtree segmentation based on the point number threshold and the side length threshold constraint is performed on the spatial point group, and Extract the block side length information that reflects the degree of aggregation of point clusters; according to the correspondence between the quadtree block side length and the bandwidth parameter of the nearest neighbor-kernel density function, calculate the adaptive bandwidth value point by point; The value is substituted into the nearest neighbor-kernel density function, the nearest neighbor-kernel density function value is calculated, and the result is presented in the form of a Heat-map. The invention combines quadtree segmentation with the nearest neighbor method, calculates the bandwidth value point by point, and more objectively expresses the real distribution characteristics of the spatial point group.

Description

technical field [0001] The invention belongs to the technical field of heat map generation, and in particular relates to a heat map generation method and system that considers spatial density differences. Background technique [0002] Heat-map is a visualization method that shows the density or frequency of spatial data with gradient color bands. It uses cold and warm colors to match the density and sparseness in human mental images, which is in line with the laws of human visual cognition and can avoid The capping problem of traditional map symbols is highly readable, and has been widely used in the expression of spatial point patterns, such as the distribution of crime cases, the expression of crowd aggregation, and traffic analysis. [0003] At present, there are many open source data visualization frameworks based on WebGL, such as Deck.gl, Mapbox, and some geographic information system (GIS) software manufacturers such as SuperMap (SuperMap), American Environmental Syst...

Claims


Application Information

Patent Timeline
Patent Type & Authority Patents(China)
IPC IPC(8): G06F16/904G06F16/29G06F16/901G06F16/9537G06F16/9032
CPCG06F16/904G06F16/29G06F16/9027G06F16/9537G06F16/90328
Inventor 成晓强刘仲宇袁昆筱佳郭昌雄吴华意
Owner HUBEI UNIV
Why Eureka
Try Eureka