

Bearing abrasion early warning method and system based on frequency spectrum
An early warning system, bearing technology, applied in complex mathematical operations, instruments, character and pattern recognition, etc., can solve the problem of bearing loss early warning and other problems
- Summary
- Abstract
- Description
- Claims
- Application Information
AI Technical Summary
Problems solved by technology
Method used
Image

Examples
Embodiment 1
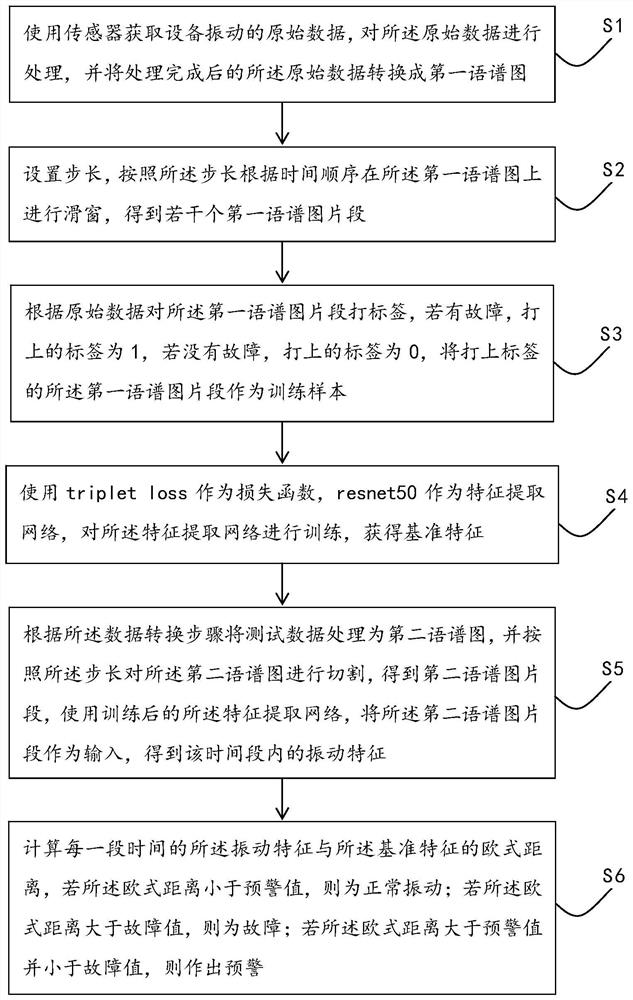
[0074] refer to figure 1 as shown, figure 1 It is a schematic diagram of the steps of a spectrum-based bearing wear early warning method provided by the present invention. Such as figure 1 As shown, this embodiment discloses a specific implementation of a spectrum-based bearing wear early warning method (hereinafter referred to as "method").
[0075] The vibration caused by the bearing is called bearing pitch, and all rolling bearings produce pitch to a certain degree, the more severely worn the bearing, the higher the degree of pitch of the bearing. Therefore, the remaining vibration signal obtained by removing the low-frequency vibration component can be used to judge the degree of bearing wear.
[0076] Specifically, the method disclosed in this embodiment mainly includes the following steps:
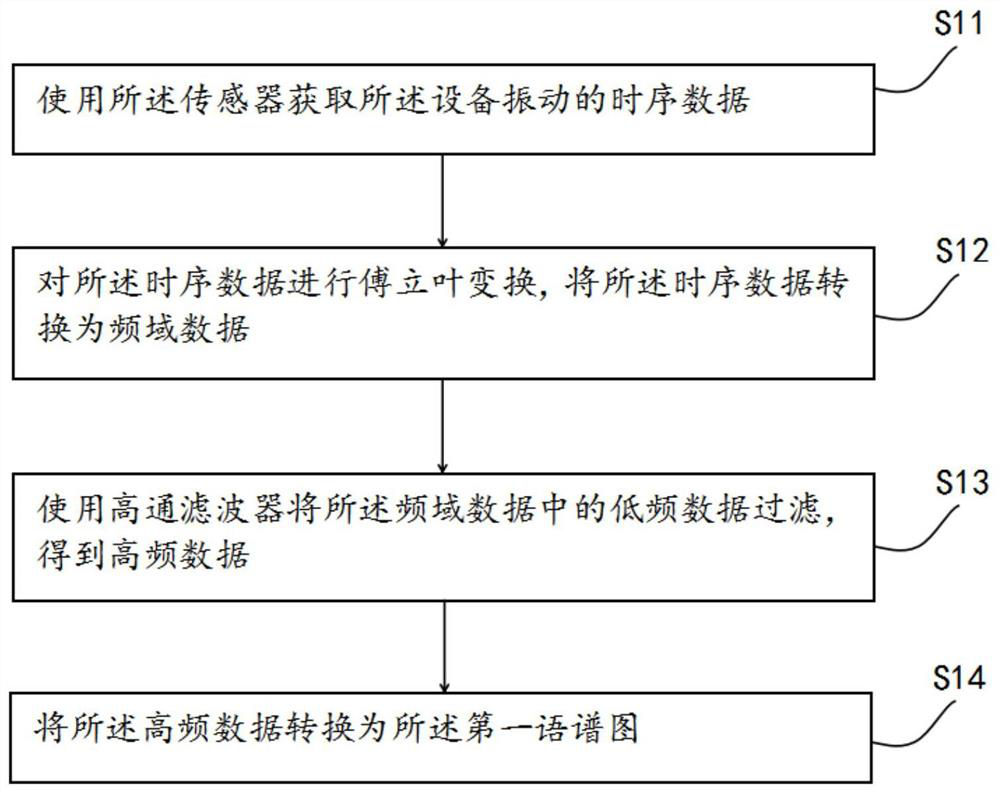
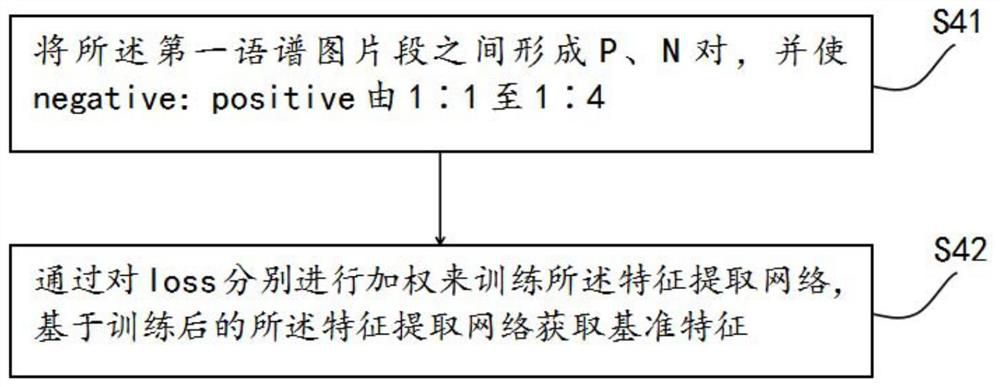
[0077] refer to figure 2 , performing step S1: using a sensor to acquire raw data of device vibration, processing the raw data, and converting the processed raw data into a fir...
Embodiment 2
[0135] In combination with the spectrum-based bearing wear early warning method disclosed in Embodiment 1, this embodiment discloses a specific implementation example of a spectrum-based bearing wear early warning system (hereinafter referred to as "system").
[0136] refer to Figure 10 As shown, the system includes:
[0137] Data conversion module 1: using a sensor to acquire raw data of device vibration, processing the raw data, and converting the processed raw data into a first spectrogram;
[0138] Spectrum image segment acquisition module 2: set the step size, and perform a sliding window on the first spectral image according to the time sequence according to the step size, to obtain several first spectral image segments;
[0139] Training sample acquisition module 3: label the first spectrum picture segment according to the original data, if there is a fault, the label is 1, if there is no fault, the label is 0, and the first language of the label is The spectrogram s...
PUM
 Abstract
Description
Claims
Application Information