
Audio and video quality visualization method and device, equipment, medium and product

An audio and video quality technology, applied in the field of audio and video processing, can solve the problems of not showing the quality of indicators, the single dimension of quantitative indicators, and the inability to describe the distribution of indicators, etc., to achieve the effect of improving the efficiency of evaluation

Active Publication Date: 2022-02-18
GUANGZHOU HUADUO NETWORK TECH
View PDF6 Cites 1 Cited by
  • Summary
  • Abstract
  • Description
  • Claims
  • Application Information

AI Technical Summary

Problems solved by technology

In order to monitor the quality of audio and video streams, a large amount of end-to-end full-link data is generally reported. These data are very complicated and have unclear physical meanings, and these data are affected by region, time, network, number of participants, user equipment, and SDK version. The impact of disturbance factors such as ect. is relatively large, and it is difficult to analyze them effectively.
[0003] At present, the evaluation methods of audio and video quality indicators commonly used in the industry mainly evaluate the quality distribution through the description data such as median and quartile, so as to obtain the results of quality. The evaluation method has a single dimension of quantitative indicators, Poor robustness and other problems, and it is impossible to describe the distribution of indicators at a specific point in time, and cannot show the more realistic quality of indicators

Method used


Image

  • Audio and video quality visualization method and device, equipment, medium and product
  • Audio and video quality visualization method and device, equipment, medium and product
  • Audio and video quality visualization method and device, equipment, medium and product

Examples


Embodiment Construction

[0057] Embodiments of the present application are described in detail below, examples of which are shown in the drawings, wherein the same or similar reference numerals denote the same or similar elements or elements having the same or similar functions throughout. The embodiments described below by referring to the figures are exemplary only for explaining the present application, and are not construed as limiting the present application.

[0058] Those skilled in the art will understand that unless otherwise stated, the singular forms "a", "an", "said" and "the" used herein may also include plural forms. It should be further understood that the word "comprising" used in the specification of the present application refers to the presence of the features, integers, steps, operations, elements and / or components, but does not exclude the presence or addition of one or more other features, Integers, steps, operations, elements, components, and / or groups thereof. It will be under...


PUM


Abstract

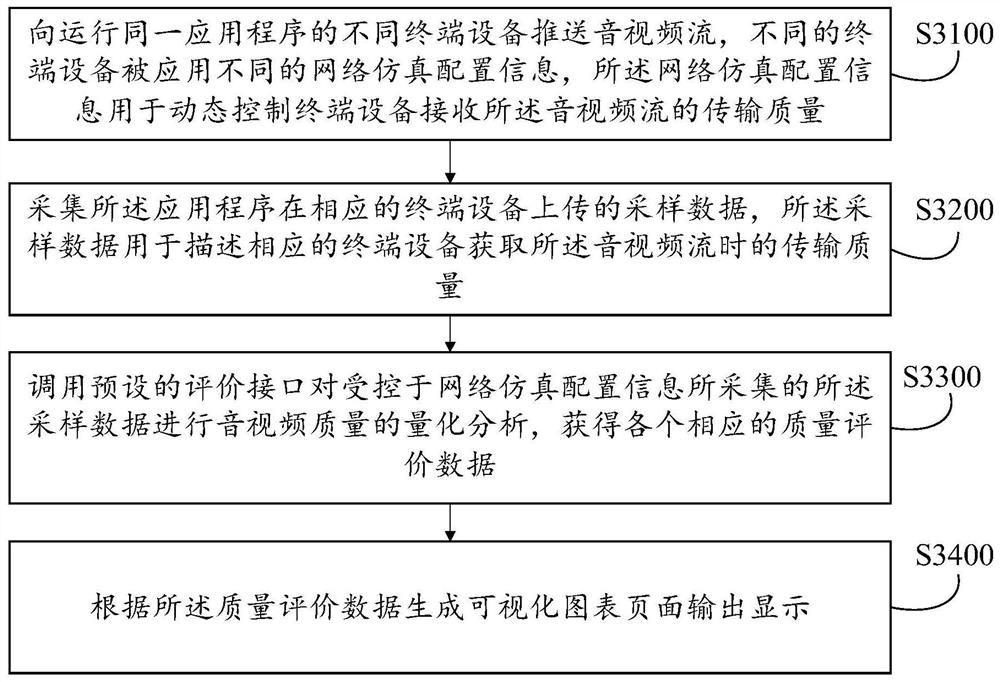
The invention relates to an audio and video processing technology, and discloses an audio and video quality visualization method and device, equipment, a medium and a product, and the method comprises the steps: pushing audio and video streams to different terminal equipment which operates the same application program, and applying different network simulation configuration information to the different terminal equipment, wherein the network simulation configuration information is used for dynamically controlling the transmission quality of the audio and video stream received by the terminal equipment; collecting the sampling data uploaded by the application program on a corresponding terminal device, wherein the sampling data is used for describing the transmission quality when the corresponding terminal device obtains the audio and video stream; calling a preset evaluation interface to carry out audio and video quality quantitative analysis on the sampling data collected by the network simulation configuration information to obtain each piece of corresponding quality evaluation data; generating a visual chart page according to the quality evaluation data, and outputting and displaying the visual chart page. According to the invention, an integrated solution is realized for the quality evaluation of the online transmission quality of the audio and video streams.

Description

technical field [0001] The present application relates to audio and video processing technologies, and in particular to an audio and video quality visualization method and its corresponding device, computer equipment, computer readable storage medium, and computer program product. Background technique [0002] In audio and video applications (such as live broadcast, video conferencing, etc.), it is necessary to pay close attention to the transmission quality of audio and video streams of online users, and quickly adjust the encoding and transmission strategies by monitoring the transmission quality of audio and video streams received by online users. In order to monitor the quality of audio and video streams, a large amount of end-to-end full-link data is generally reported. These data are very complicated and have unclear physical meanings, and these data are affected by region, time, network, number of participants, user equipment, and SDK version. The impact of disturbanc...

Claims


Application Information

Patent Timeline
Patent Type & Authority Applications(China)
IPC IPC(8): H04N21/442H04N21/24H04N17/00
CPCH04N21/442H04N21/2407H04N17/00Y02D10/00
Inventor 林绪虹李凌赵显宁
Owner GUANGZHOU HUADUO NETWORK TECH
Learn More