Supercharge Your Innovation With Domain-Expert AI Agents!

A quantitative remote sensing inversion prediction result evaluation method and system

A technology for remote sensing inversion and prediction results, applied in the field of remote sensing inversion, which can solve problems such as inability to eliminate false abnormal areas, selective calculation of high-value areas, and inconsistencies.

Active Publication Date: 2022-06-21
CENT SOUTH UNIV +1
View PDF5 Cites 0 Cited by
  • Summary
  • Abstract
  • Description
  • Claims
  • Application Information

AI Technical Summary

Problems solved by technology

[0003] In the prior art, there is an index method for evaluating the accuracy of remote sensing quantitative inversion, using R 2 , RMSE, MAE and other evaluation indicators. These indicators are based on discrete samples and are usually used to test the accuracy of the inversion model. However, this method is mainly based on theory to test the model, so false anomalies cannot be eliminated, resulting in better evaluation accuracy. But the actual visualization results are poor
There is also a method for evaluating remote sensing quantitative inversion results. This method directly uses the method of visual inspection to compare the consistency of the location of high-value areas. This method is only suitable for small-area comparisons, and it will consume a lot of manpower for larger preset areas. material resources
In addition, there is another method to calculate the price based on the similarity of pictures. Generally, a method based on the hash algorithm is used to calculate the similarity between pictures. The Consistency and Stability Test of the Abnormal Areas Needed in the Practical Application of Remote Sensing Inversion, That is, the High Value Areas
[0004] To sum up, most of the methods for evaluating the similarity of the accuracy of remote sensing inversion results in the above-mentioned prior art use model evaluation indicators and field verification. The former cannot evaluate the actual inversion effect, and the latter consumes manpower and material resources. Statistical interpolation is a method to visualize the measured data and predicted data and calculate the similarity of pictures. However, the existing similarity calculation method is based on the similarity calculation of the whole image, and it is impossible to selectively calculate high-value areas according to the demand. The accuracy evaluation of remote sensing quantitative inversion has inconsistencies in the spatial distribution of inversion and measured object content, and has subjectivity and limitations

Method used


Image

  • A quantitative remote sensing inversion prediction result evaluation method and system
  • A quantitative remote sensing inversion prediction result evaluation method and system
  • A quantitative remote sensing inversion prediction result evaluation method and system

Examples


Embodiment 1

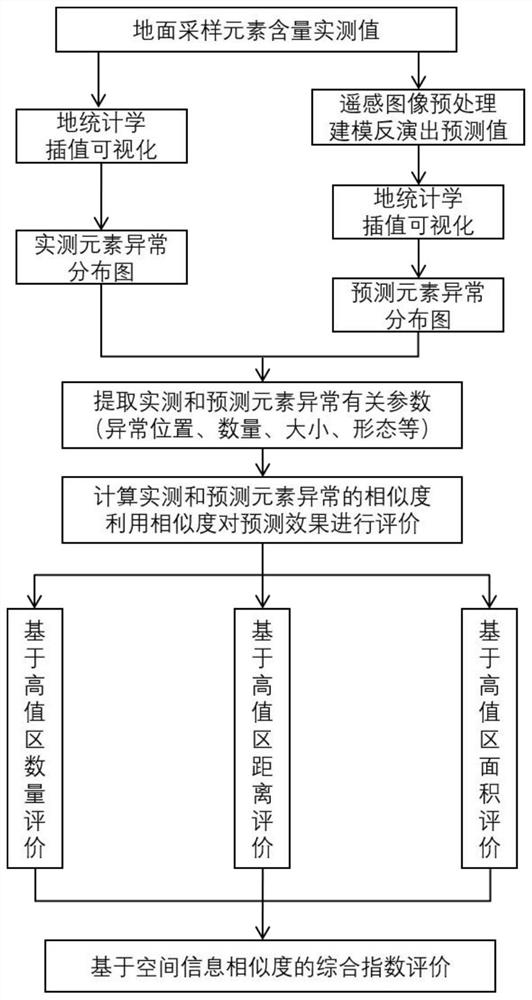
[0039] like figure 1 As shown, an embodiment of the present invention provides a method for evaluating the accuracy of quantitative remote sensing inversion results, including the following steps:

[0040] Obtain the measured data of the target element content in the preset area;

[0041] According to the obtained remote sensing image reflectance of the preset area, the target element content prediction data of the preset area is obtained through the remote sensing inversion model, and the remote sensing inversion model is used to establish the corresponding relationship between the remote sensing image reflectance and the element content of the measured point;

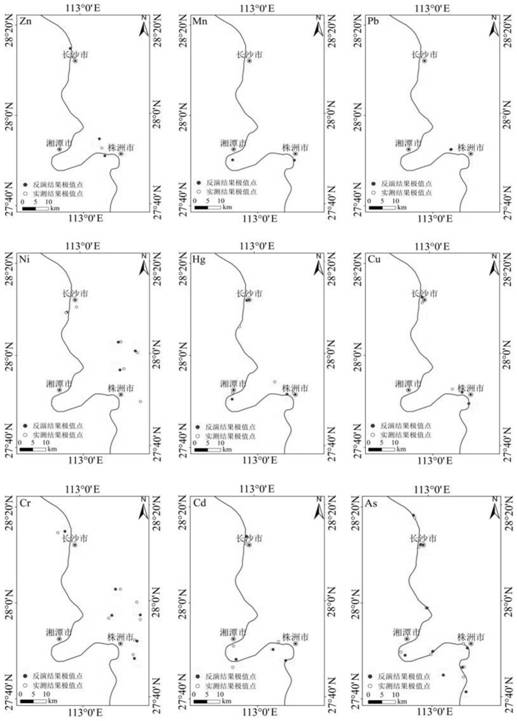
[0042] Using the measured data to interpolate color segmentation (visualization) by the method of geostatistics to obtain the distribution map of the measured element anomalies, using the remote sensing data to obtain the predicted element content through the remote sensing inversion model, and to perform the interpol...

Embodiment approach

[0045] As an embodiment of the present invention, the high-value area of ​​the predicted data is compared with the high-value area of ​​the measured data, the number of high-value areas of the high-value area of ​​the predicted data and the high-value area of ​​the measured data is counted, and the prediction accuracy rate, Predict the error rate and predict the missing rate, and obtain the evaluation accuracy based on the number of high-value areas; obtain the correct rate, error rate, and missing rate according to the following formulas:

[0046]

[0047]

[0048]

[0049] Among them, P Currect is the correct rate, P False is the error rate, P Missing is the missing rate; a c Indicates the number of correctly inverted high-value regions, a f Indicates the number of regions with high values ​​for incorrect inversion, a m Indicates the number of high-value areas that have not been inverted, A m Indicates the number of measured high-value areas of the element; P ...

Embodiment 2

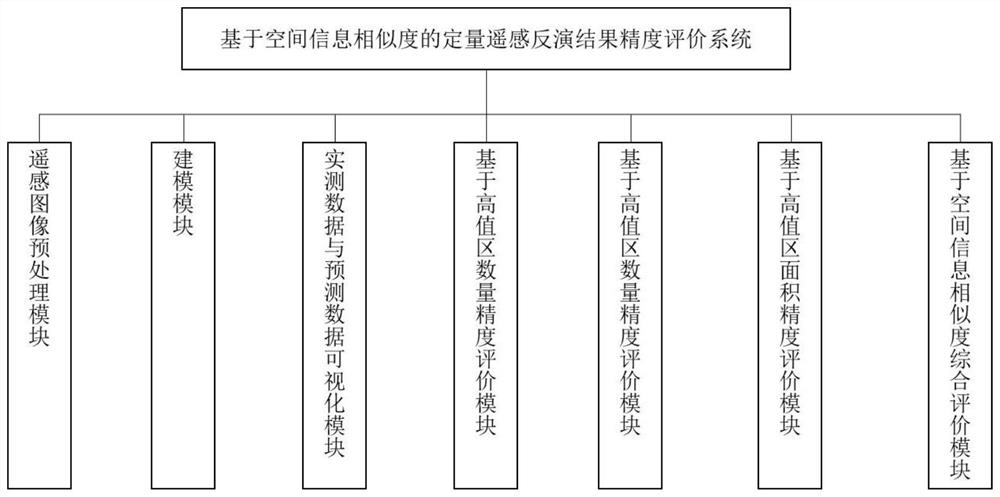
[0060] like figure 2 As shown, the embodiment of the present invention also provides a system for evaluating the accuracy of remote sensing quantitative inversion results, including:

[0061] The acquisition module is used to acquire the measured data of the target element content in the preset area;

[0062] The inversion module is used to obtain the target element content prediction data of the preset area through the remote sensing inversion model according to the obtained remote sensing image reflectivity of the preset area;

[0063] The evaluation module is used to perform comprehensive index evaluation of the similarity of abnormal features on the measured data and predicted data; the comprehensive index evaluation includes: evaluation accuracy based on the number of high-value areas, evaluation accuracy based on the distance of high-value areas, and high-value area-based evaluation accuracy Accuracy of area evaluation.

[0064] As an embodiment of the present inventi...


PUM


Abstract

The invention discloses a method and system for evaluating the accuracy of quantitative remote sensing inversion results, comprising the following steps: obtaining actual measurement data of target element content in a preset area; The predicted data of the target element content in the area is set; the comprehensive index evaluation of the similarity of abnormal characteristics is carried out on the measured data and the predicted data. By adopting the technical solution of the present invention, the inconsistency in spatial distribution of inversion and measured object content in remote sensing quantitative inversion accuracy evaluation is avoided.

Description

technical field [0001] The invention belongs to the technical field of remote sensing inversion, in particular to a method and system for evaluating the accuracy of remote sensing inversion results based on spatial information similarity. Background technique [0002] With the continuous improvement of modeling methods and the improvement of the accuracy of remote sensing data, more and more researches have been conducted on inversion of element content using remote sensing data. . For the evaluation of the results of quantitative remote sensing inversion, the most important thing is its inversion accuracy, stability and consistency, that is, the evaluation of the similarity between the measured value and the predicted value, including the evaluation of the inversion model, the difference between the measured value and the predicted value. Evaluation and visual spatial information evaluation of measured and predicted values ​​in preset areas, etc. [0003] In the prior art...

Claims


Application Information

Patent Timeline
Patent Type & Authority Patents(China)
IPC IPC(8): G06Q10/06G06Q10/04
CPCG06Q10/06393G06Q10/04G06V20/13G06V10/60G06V10/82G06V10/56G06V10/761G06V10/7715G06V10/98G06T7/0002G06T2207/30181G06T2207/10032G06T7/73G06V10/25G06V10/776
Inventor 成功邓小青班玉莹罗丹黄慧坤王子萱朱战军李嘉璇王冬军
Owner CENT SOUTH UNIV
Features
  • R&D
  • Intellectual Property
  • Life Sciences
  • Materials
  • Tech Scout
  • Unparalleled Data Quality
  • Higher Quality Content
  • 60% Fewer Hallucinations
Learn More