Method for looking up optinum threshold from image separation

An optimal threshold, image segmentation technology, applied in image analysis, image enhancement, image data processing and other directions, can solve problems such as time increase and inability to calculate images

Inactive Publication Date: 2004-10-27
PANTECH CO LTD
View PDF0 Cites 11 Cited by
  • Summary
  • Abstract
  • Description
  • Claims
  • Application Information

AI Technical Summary

Problems solved by technology

However, the entire processing time of the traditional method increases proportionally with the resolution of the image and the number of entropy values ​​that need to be calculated.
Moreover, in the case of an image with multiple thresholds, the conditions under which image segmentation is complete cannot be calculated by traditional methods

Method used


Image

  • Method for looking up optinum threshold from image separation
  • Method for looking up optinum threshold from image separation
  • Method for looking up optinum threshold from image separation

Examples


Embodiment Construction

[0015] Other objects and aspects of the present invention will become apparent through further explanation of the embodiments described below with reference to the accompanying drawings.

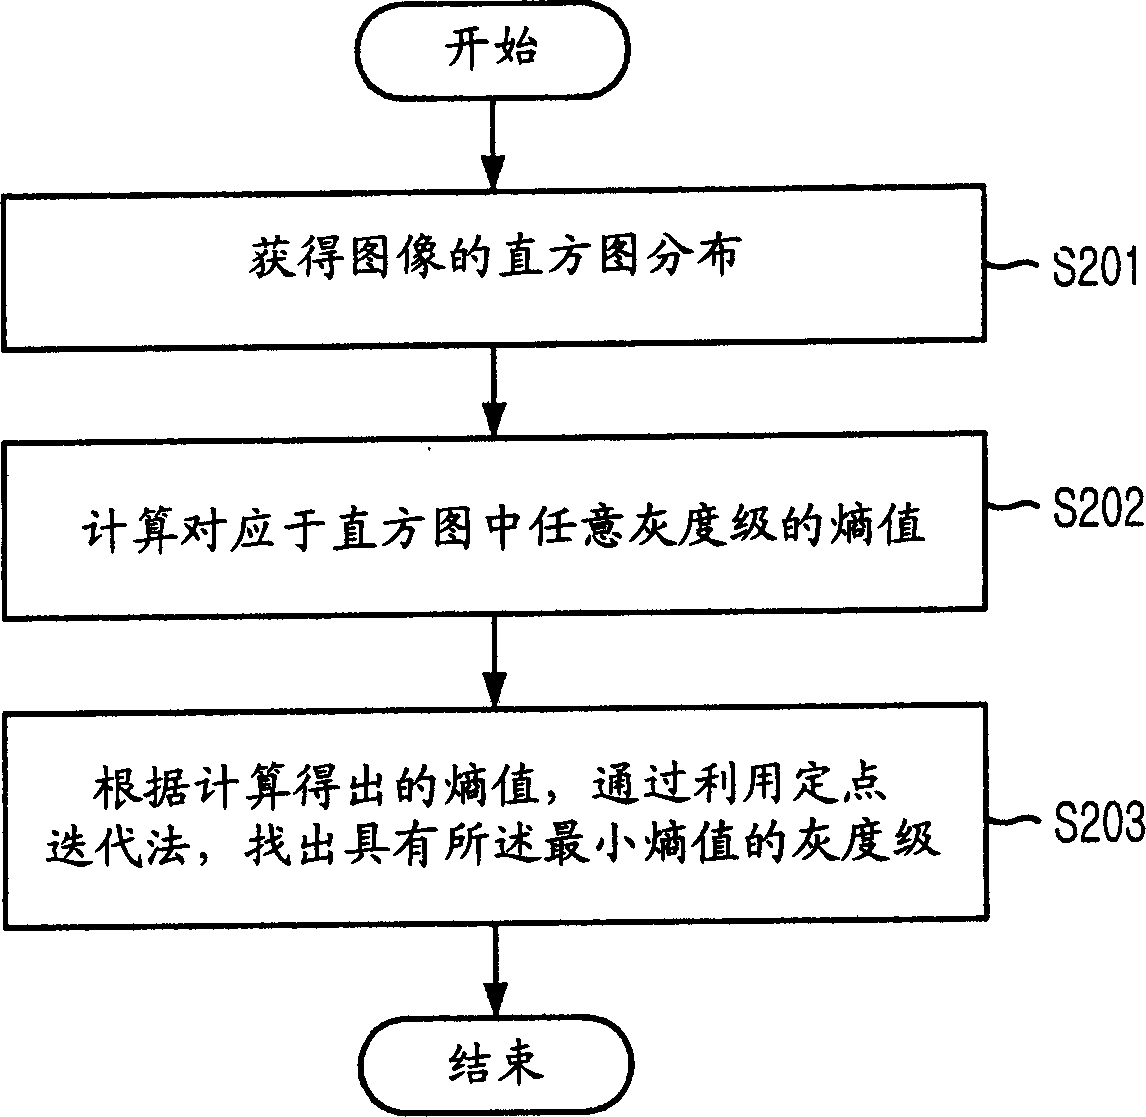
[0016] figure 2 is a flowchart for explaining a method of finding an optimal threshold for image segmentation according to a preferred embodiment of the present invention.

[0017] refer to figure 2 , in step 201 the histogram distribution of the image is obtained. In step S202, the entropy of the gray level is calculated. After the entropy value is calculated in step S202, a gray level with minimum entropy is obtained in step S203 by using the fixed point iteration (fixed point iteration; FPI) according to the calculated entropy value.

[0018] In step S202, the entropy of the gray level is calculated by measuring the fuzzy entropy of the corresponding gray level. In the following, the calculation of fuzzy entropy is explained in detail.

[0019] If an image I of size M×N has L gray le...


PUM


Abstract

A method for finding the optimal threshold for image segmentation in image recognition is disclosed. The method includes the steps of: a) gaining histogram distribution of an image; b) computing entropy values corresponding to gray levels in the histogram; and c) gaining a minimum entropy value corresponding to the gray level as the threshold value by using a fixed point iteration FPI based on the computed entropy values. The invention is capable of finding out an optimal threshold in a short time by applying a fast analytical approach method based on an FPI(Fixed Point Iteration) method together with a division termination condition for an image having multi-threshold through analysis for an entropy feature of the image.

Description

technical field [0001] The invention relates to a method for finding out the optimal threshold for image segmentation, in particular to a method for finding out the optimal threshold for image segmentation in the process of image recognition. Background technique [0002] In general, in image recognition technology, the process of finding the optimal threshold for image segmentation is a fundamental and important process. In order to distinguish an object from the background of an image, a recognition process is necessary. [0003] According to the bimodal histogram distribution area line, it is easy to find the optimal threshold value, in the above case, the optimal threshold value is located at the lowest point of the histogram distribution curve. There are also many ways to find the optimal threshold. [0004] The first method is a stochastic method for finding the optimal threshold. That is, it is assumed that the histogram distribution of the image is of bimodal type...

Claims


Application Information

Patent Timeline
Patent Type & Authority Applications(China)
IPC IPC(8): G06T5/00G06V10/28
CPCG06T7/0081G06K9/38G06T2207/20148G06T7/11G06T7/136G06V10/28
Inventor 申龙湜
Owner PANTECH CO LTD
Why Eureka
Try Eureka