Statistical quality control of medical laboratory results

a technology of laboratory results and statistical quality control, applied in laboratory analysis data, health care informatics, patient healthcare, etc., can solve problems such as flawed quality control procedures and inefficiencies, system, method and reference ranges that fail to reflect newly-observed variation in the measured values of tested analytes, and improper flagging for re-testing

Active Publication Date: 2019-06-18
QUEST DIAGNOSTICS INVESTMENTS INC
View PDF2 Cites 2 Cited by
  • Summary
  • Abstract
  • Description
  • Claims
  • Application Information

AI Technical Summary

Benefits of technology

[0012]Thus, according to embodiments of the invention, methods of quality control may calculate a grade for a test, or batch of tests, based on the expected distribution of test results for samples in the batch, factoring in these variations. Such expected distribution may be based on expected parametric variations in individual results, results in one or more sub-populations, or both. A method according to an embodiment of the invention may also include transmitting an indication that tests need to be done again on one or more samples, and/or indicating that one or more results may be released based on the grade.
[0013]According to an embodiment of the invention, a computer system for providing a quality control grade comprises one or more processors and one or more computer-readable storage media encoded with instructions that, when executed by at least one of the processors, cause the computer system at least to carry out a method of calculating the quality-control grade. The method comprises retrieving at least one reference range value reflecting at least one time-periodic f

Problems solved by technology

Existing testing systems and methods provide reference ranges for test results, but those systems, methods, and reference ranges fail to reflect newly-observed variation in the measured values of the tested analytes.
Such quality control methodologies therefore result in flawed qu

Method used


Image

  • Statistical quality control of medical laboratory results
  • Statistical quality control of medical laboratory results
  • Statistical quality control of medical laboratory results

Examples


Embodiment Construction

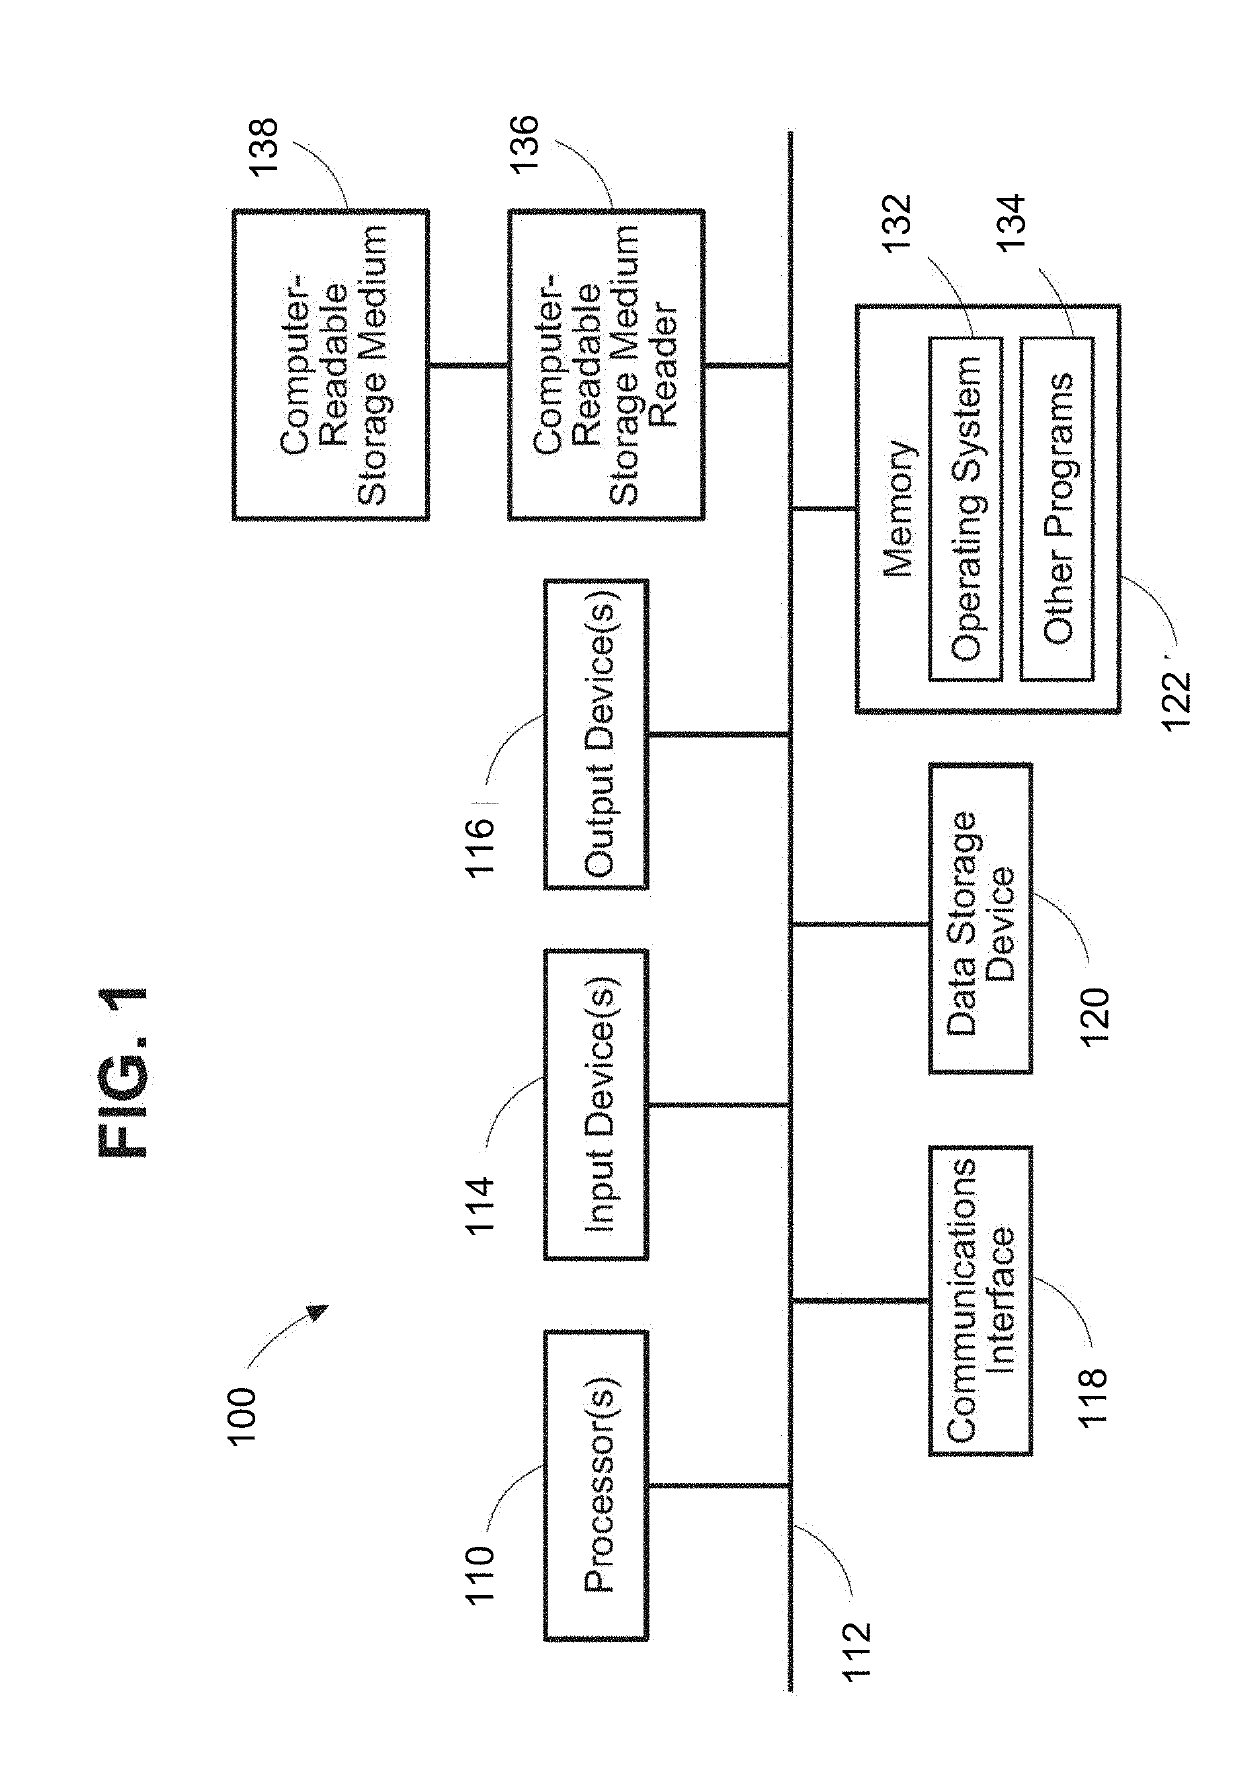
[0020]Embodiments of the invention may be implemented by systems using one or more programmable digital computers. FIG. 1 depicts an example of one such computer system 100, which includes at least one processor 110, such as, e.g., an Intel or Advanced Micro Devices microprocessor, coupled to a communications channel or bus 112. The computer system 100 further includes at least one input device 114 such as, e.g., a keyboard, mouse, touch pad or screen, or other selection or pointing device, at least one output device 116 such as, e.g., an electronic display device, at least one communications interface 118, at least one data storage device 120 such as a magnetic disk or an optical disk, and memory 122 such as ROM and RAM, each coupled to the communications channel 112. The communications interface 118 may be coupled to a network (not depicted) such as the Internet.

[0021]Although the computer system 100 is shown in FIG. 1 to have only a single communications channel 112, a person ski...


PUM


Abstract

Laboratory testing plays a significant and growing role in the delivery of medical services. Fresh analysis of past test results has led to discovery of previously unknown correlations between statistical properties of analyte values and parameters such as age, sex, and region. Observed values in patient populations have also newly been discovered to show both secular and regular periodic variations over time. Embodiments of the invention may use information about these correlations to improve quality control and other statistical analysis of patient samples by applying adjusted reference ranges to quality control methodologies, and providing a quality control grade for patient samples based on the adjusted reference ranges.

Description

CROSS-REFERENCE TO RELATED APPLICATION[0001]This application claims priority of U.S. Provisional Application Ser. No. 61 / 582,293, filed 31 Dec. 2011, which is incorporated by reference herein, including without limitation all appendices thereto.[0002]This application is related to provisional U.S. patent application No. 61 / 254,652, filed 23 Oct. 2009 and titled “Systems and Methods for Quality Assurance in Providing Laboratory Services”, and to U.S. patent application Ser. No. 12 / 911,106, filed 25 Oct. 2010 and titled “Systems and Methods for Quality Assurance in Providing Laboratory Services”, both of which are incorporated fully (including all appendices thereto) herein by reference. This application is also related to provisional U.S. patent application no. 61 / 429,102, filed 31 Dec. 2010 and titled “Delivery of Medical Services Based on Observed Parametric Variation in Analyte Values”, and to U.S. patent application Ser. No. 13 / 341,081, filed 30 Dec. 2010 and titled “Delivery of ...

Claims


Application Information

Patent Timeline
IPC IPC(8): G16H10/00G16H15/00G16H10/40G16H10/60
CPCG06F19/32G16H10/40G16H10/00G16H15/00G16H10/60G16H40/63G16H40/67
Inventor SUFFIN, STEPHEN
Owner QUEST DIAGNOSTICS INVESTMENTS INC
Why Eureka
Try Eureka