
Chart labeling system

a labeling system and chart technology, applied in the field of data processing systems, can solve the problems of confusing the graphically conveying of the difficulty of placing the text in the labels into the different sections, and the confusion of graphically conveying the data represented in the different sections of the circular char

Active Publication Date: 2019-11-19
ADP
View PDF51 Cites 0 Cited by
  • Summary
  • Abstract
  • Description
  • Claims
  • Application Information

AI Technical Summary

Benefits of technology

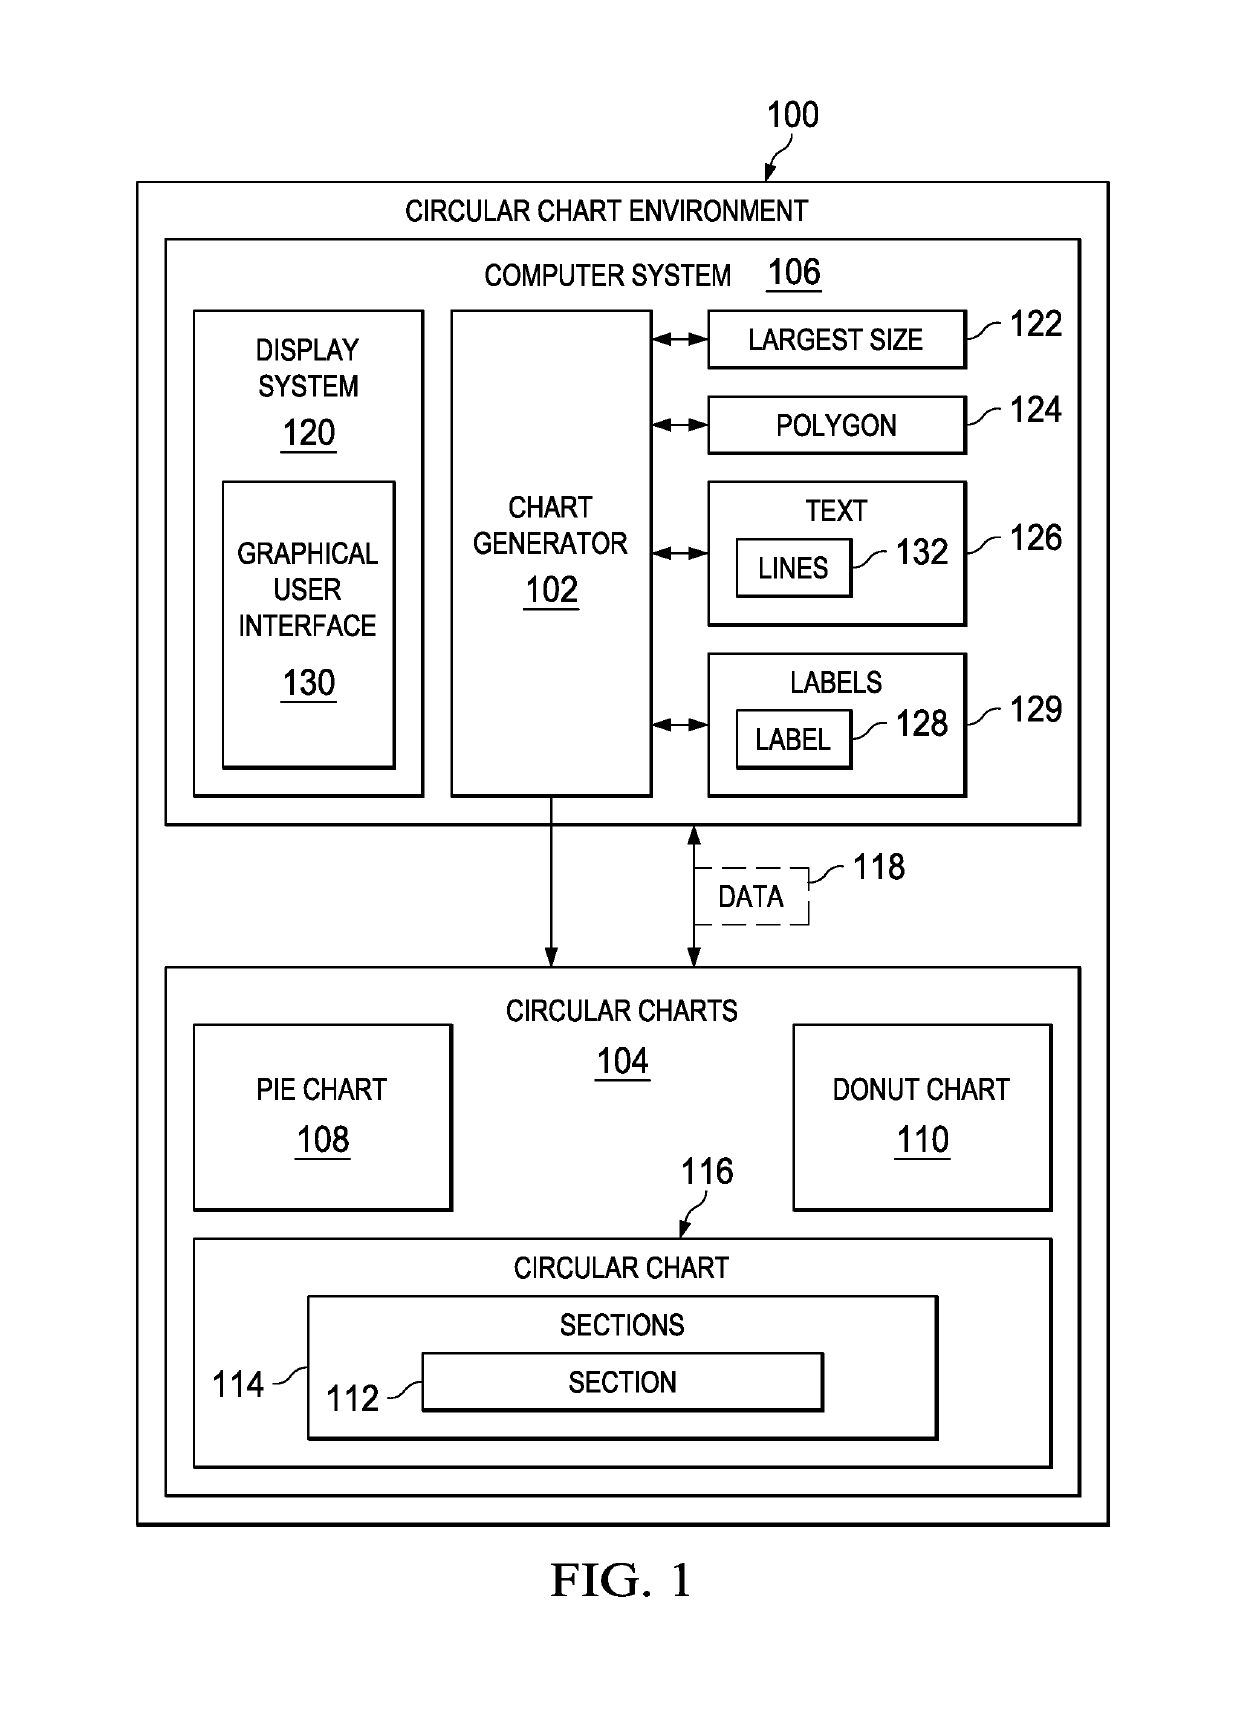
[0011]In one illustrative embodiment, a method for graphically displaying data is presented. A computer system selects a section from a group of sections in a circular chart for the data that is to be graphically displayed on a display system. The computer system identifies a largest size for a polygon that will fit in the section of the circular chart. The computer system also identifies text for the section. Further, the computer system displays the circular chart with the text in the section on a display system when the text fits within the polygon in the section. Graphically displaying the data with the text in the circular chart enables a desired level of comprehension of the data.
[0012]In another illustrative embodiment, a graphical display system comprises a display system and a chart generator in a computer system in communication with the display system. The chart generator selects a section from a group of sections in a circular chart for data that is to be graphically displayed on the display system. The chart generator also identifies a largest size for a polygon that will fit in the section of the circular chart. Further, the chart generator identifies text for the section. Still further, the chart generator displays the circular chart with the text in the section on the display system when the text fits within the polygon in the section. Graphically displaying the data with the text in the circular chart enables a desired level of comprehension of the data.
[0013]In yet another illustrative embodiment, a computer program product comprises a computer readable storage media. The computer program product also comprises a first program code, a second program code, a third program code, and a fourth program code that are stored on the computer readable storage media. The first program code selects a section from a group of sections in a circular chart for data that is to be graphically displayed on a display system. The second program code identifies a largest size for a polygon that will fit in the section of the circular chart. The third program code identifies text for the section. The fourth program code displays the circular chart with the text in the section on the display system when the text fits within the polygon in the section. Graphically displaying the data with the text in the circular chart enables a desired level of comprehension of the data.

Problems solved by technology

Depending on the number of sections, the text for the labels, as well as other factors, may make placing the text in the labels into the different sections more challenging than desired.
Having a line of text in a label from one section cross over into another section may lead to confusion in graphically conveying the data represented in the different sections of the circular chart.
As a result, graphically conveying what each section represents in the circular chart becomes confusing.
Abbreviations, however, may be unclear and lead to confusion in understanding the data being graphically represented by the circular chart.
The legend, however, may be more complex than desired or may not provide the desired aesthetics for the graphical representation for the information.
These types of labels, however, may not provide the desired aesthetics for the graphical representation of the information.
Additionally, the use of labels outside of the sections also may lead to increased difficulty in understanding the chart with the increased clutter of having labels outside of the different sections.

Method used


Image

  • Chart labeling system
  • Chart labeling system
  • Chart labeling system

Examples


Embodiment Construction

[0030]The illustrative embodiments recognize and take into account one or more different considerations. For example, the illustrative embodiments recognize and take into account that currently used techniques for generating labels with text in charts may not be as clear as possible to convey information to a person viewing the chart. The illustrative embodiments recognize and take into account that current techniques for displaying text in circular charts often have an undesirable trade-off between the aesthetics of the chart and conveying the information in a desired manner. For example, the illustrative embodiments recognize and take into account that the use of abbreviations, codes, or other shorthand techniques for labels in a circular chart does not convey information as quickly and clearly as desired. Further, labels placed on the outside of circular charts often do not have a desired level of aesthetics.

[0031]Thus, the illustrative embodiments provide a method and apparatus ...


PUM


Abstract

A method and apparatus for graphically displaying data is presented. A computer system selects a section from a group of sections in a circular chart for the data that is to be graphically displayed on a display system. The computer system identifies a largest size for a polygon that will fit in the section of the circular chart. The computer system also identifies text for the section. Further, the computer system displays the circular chart with the text in the section on a display system when the text fits within the polygon in the section. Graphically displaying the data with the text in the circular chart enables a desired level of comprehension of the data.

Description

BACKGROUND INFORMATION[0001]1. Field[0002]The present disclosure relates generally to data processing systems, and in particular, to graphically displaying data in a graphical user interface. Still more particularly, the present disclosure relates to a method and apparatus for generating labels for charts displayed graphically in a graphical user interface.[0003]2. Background[0004]Information from spreadsheets, databases, and other sources may be displayed graphically in a number of different ways. For example, bar graphs, line graphs, circular charts, and other types of charts or graphs may be used to provide a graphical representation of the information.[0005]Circular charts include pie charts and data charts. These types of circular charts are divided into sections. Each section typically illustrates a numerical proportion to the quantity represented by the section. In particular, the arc length of each section represents the quantity as a proportion relative to other quantities ...

Claims


Application Information

Patent Timeline
Patent Type & Authority Patents(United States)
IPC IPC(8): G06F3/0481G06T11/20
CPCG06T11/206G06F3/0481
Inventor MCELWEE, TIMOTHY JAMESHERMAN, MATTHEW PAUL
Owner ADP
Learn More