Computer Implemented Method and System of Trading Indicators Based on Price and Volume

a technology of trading indicators and computer implementation, applied in the field of market traded instruments, can solve the problems of lack of a method of deriving trading indicators, lack of a plurality of brackets, and inability to combine volume for specific prices, so as to improve line and price-series based understanding and the effect of improving market forces

Inactive Publication Date: 2004-11-11
CHURQUINA EDUARDO ENRIQUE
View PDF4 Cites 140 Cited by
  • Summary
  • Abstract
  • Description
  • Claims
  • Application Information

AI Technical Summary

Benefits of technology

0011] Accordingly, it is a primary object of my invention to provide traders with an analytical decision support tool for getting a better understanding of market forces at work on determined market instrument and let traders identify price trends at the earliest possible time. This tool should be repeatable, mathematical, user configurable, and able to run in real time. A secondary object of my invention is providing traders with a base price-series analysis tool that uses volume to recognize the most important price of each time interval. This tool can be used to build improved line and price-series based studies, much superior to studies built using closing prices for each interval.

Problems solved by technology

It also does not provide means for cumulating volume in a plurality of brackets bigger than the minimum price increment allowed in the exchange, neither methods to adjust those price brackets to the instrument price.
It also lacks the capability of merging together volume for specific prices spanning more than one time period.
Being a display system Li and Chong system does not compare the actual volume of price brackets belonging to different time intervals, nor provide means for varying price brackets, or in essence, does not provide a method of deriving trading indicators from the system invented.
Although a breakthrough in market instrument's activity display, it did not provided a method for generating trading indicators.

Method used


Image

  • Computer Implemented Method and System of Trading Indicators Based on Price and Volume
  • Computer Implemented Method and System of Trading Indicators Based on Price and Volume
  • Computer Implemented Method and System of Trading Indicators Based on Price and Volume

Examples


Embodiment Construction

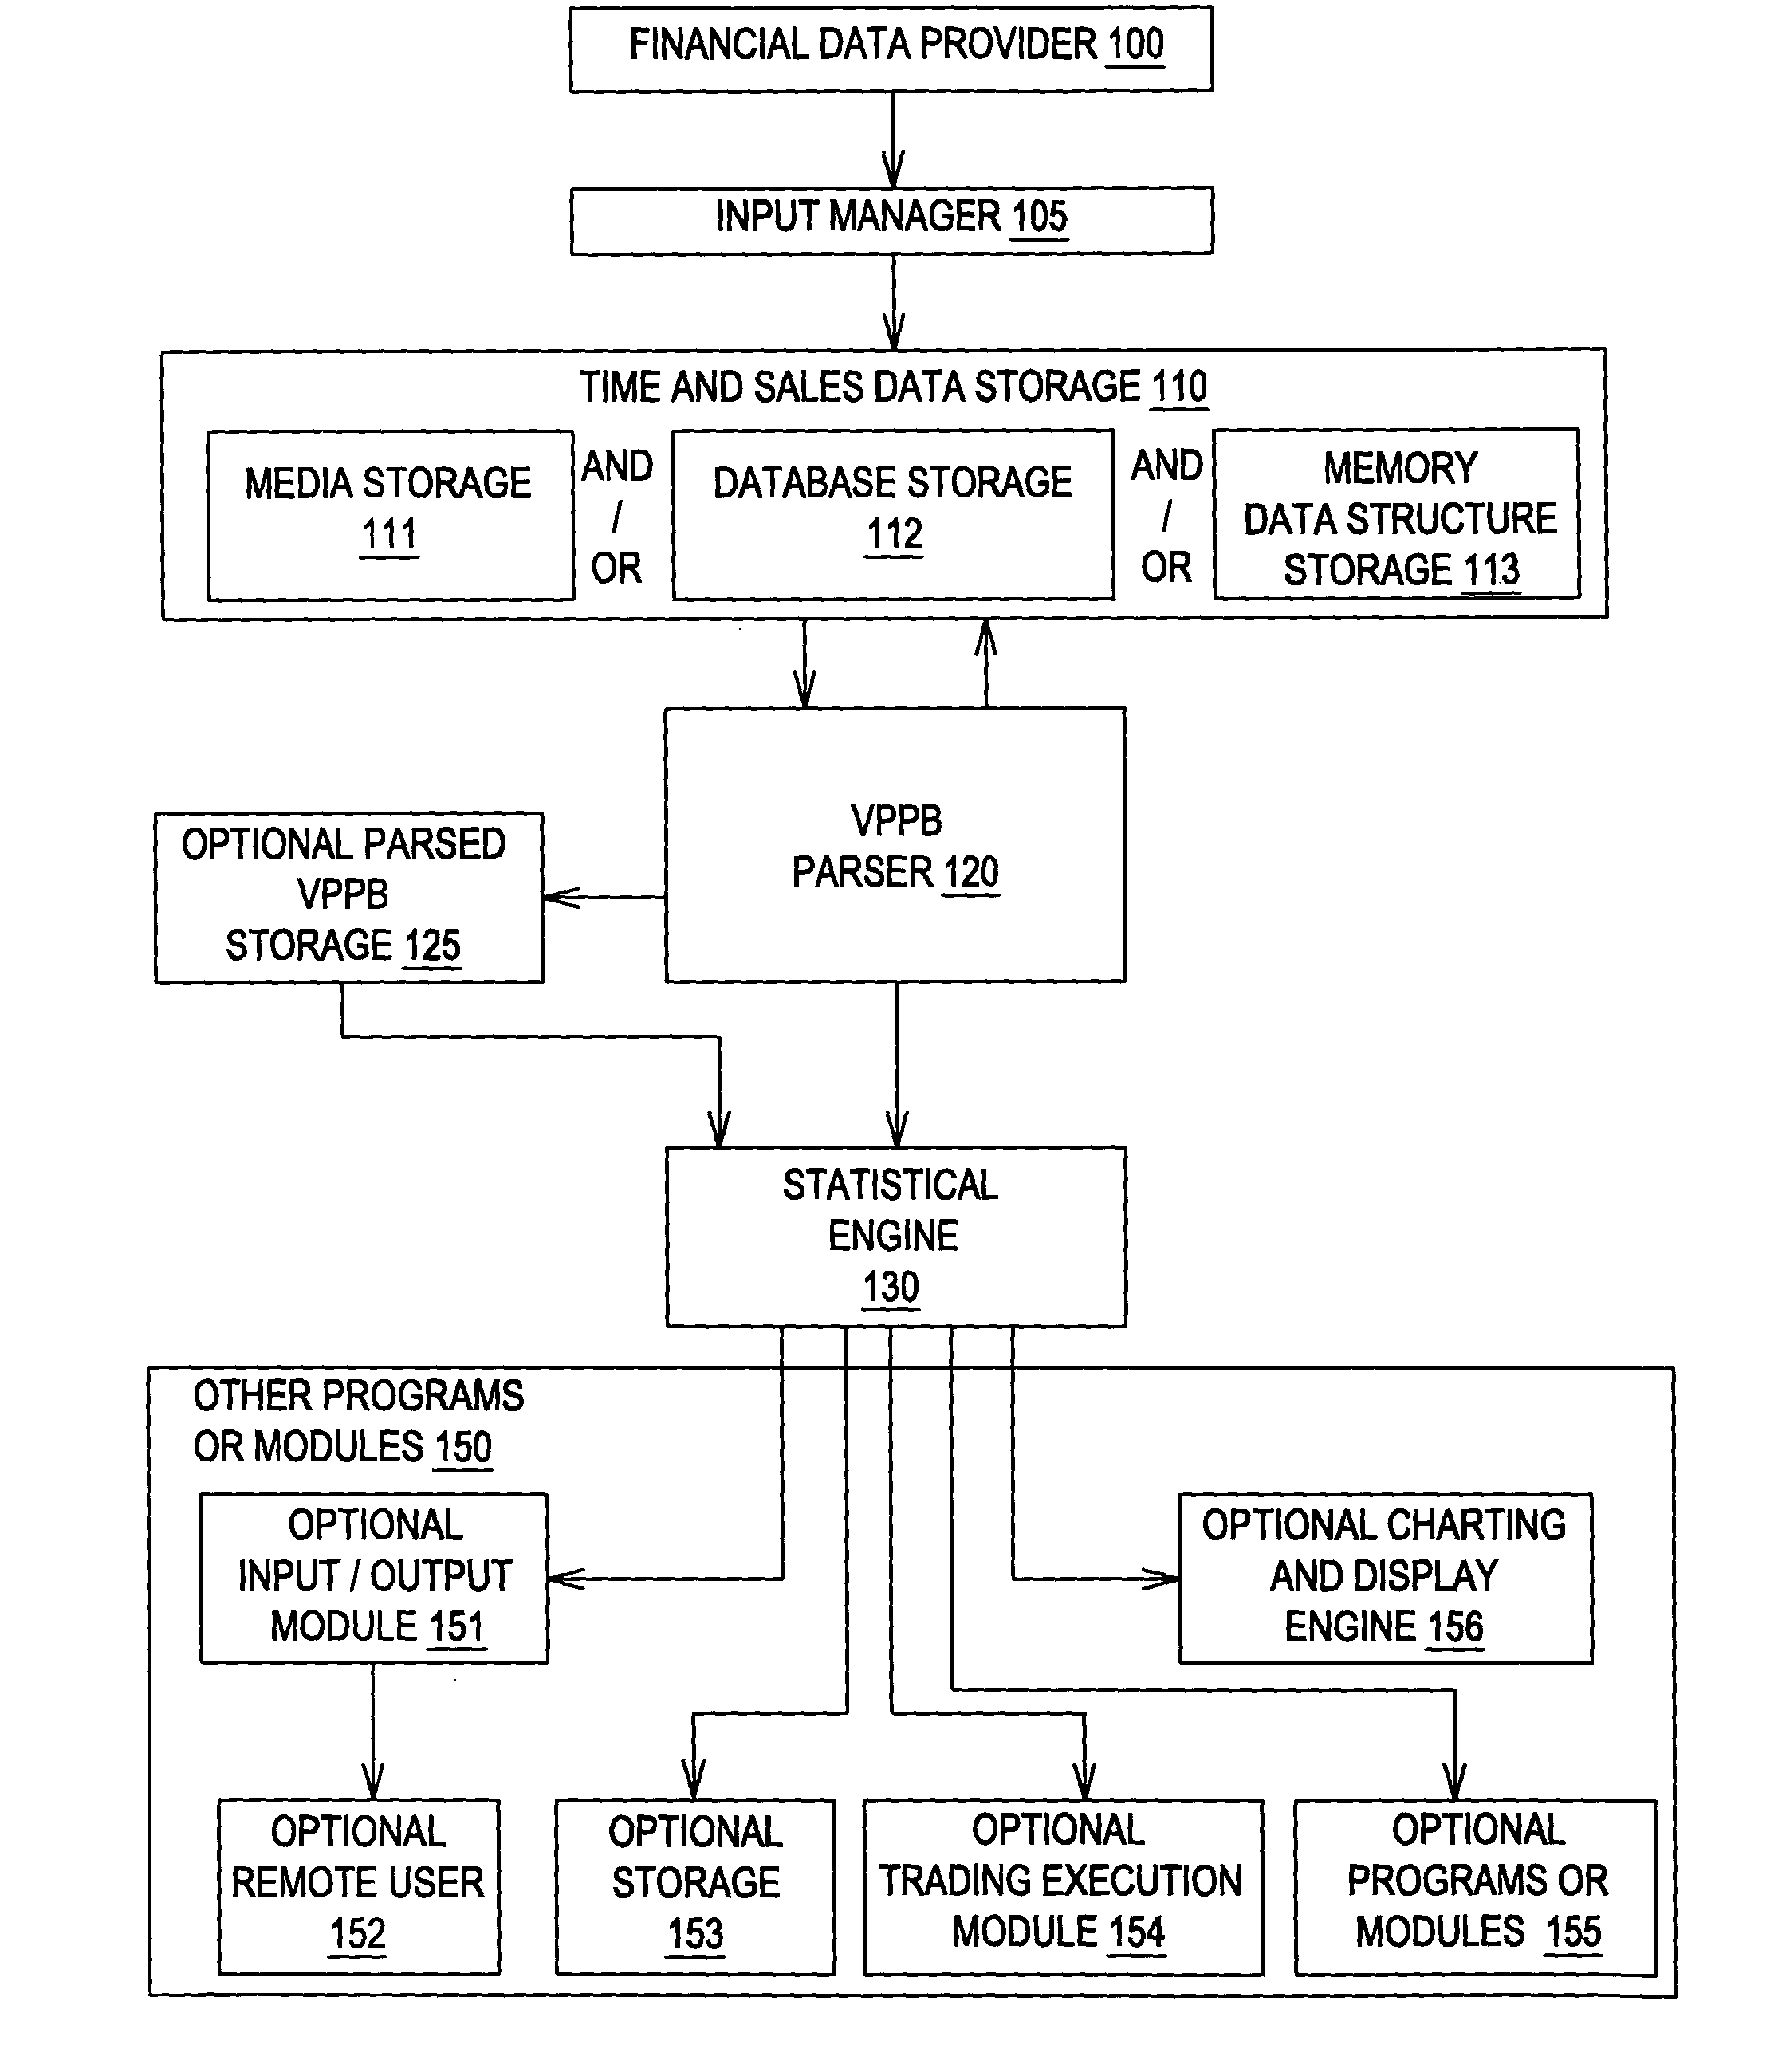
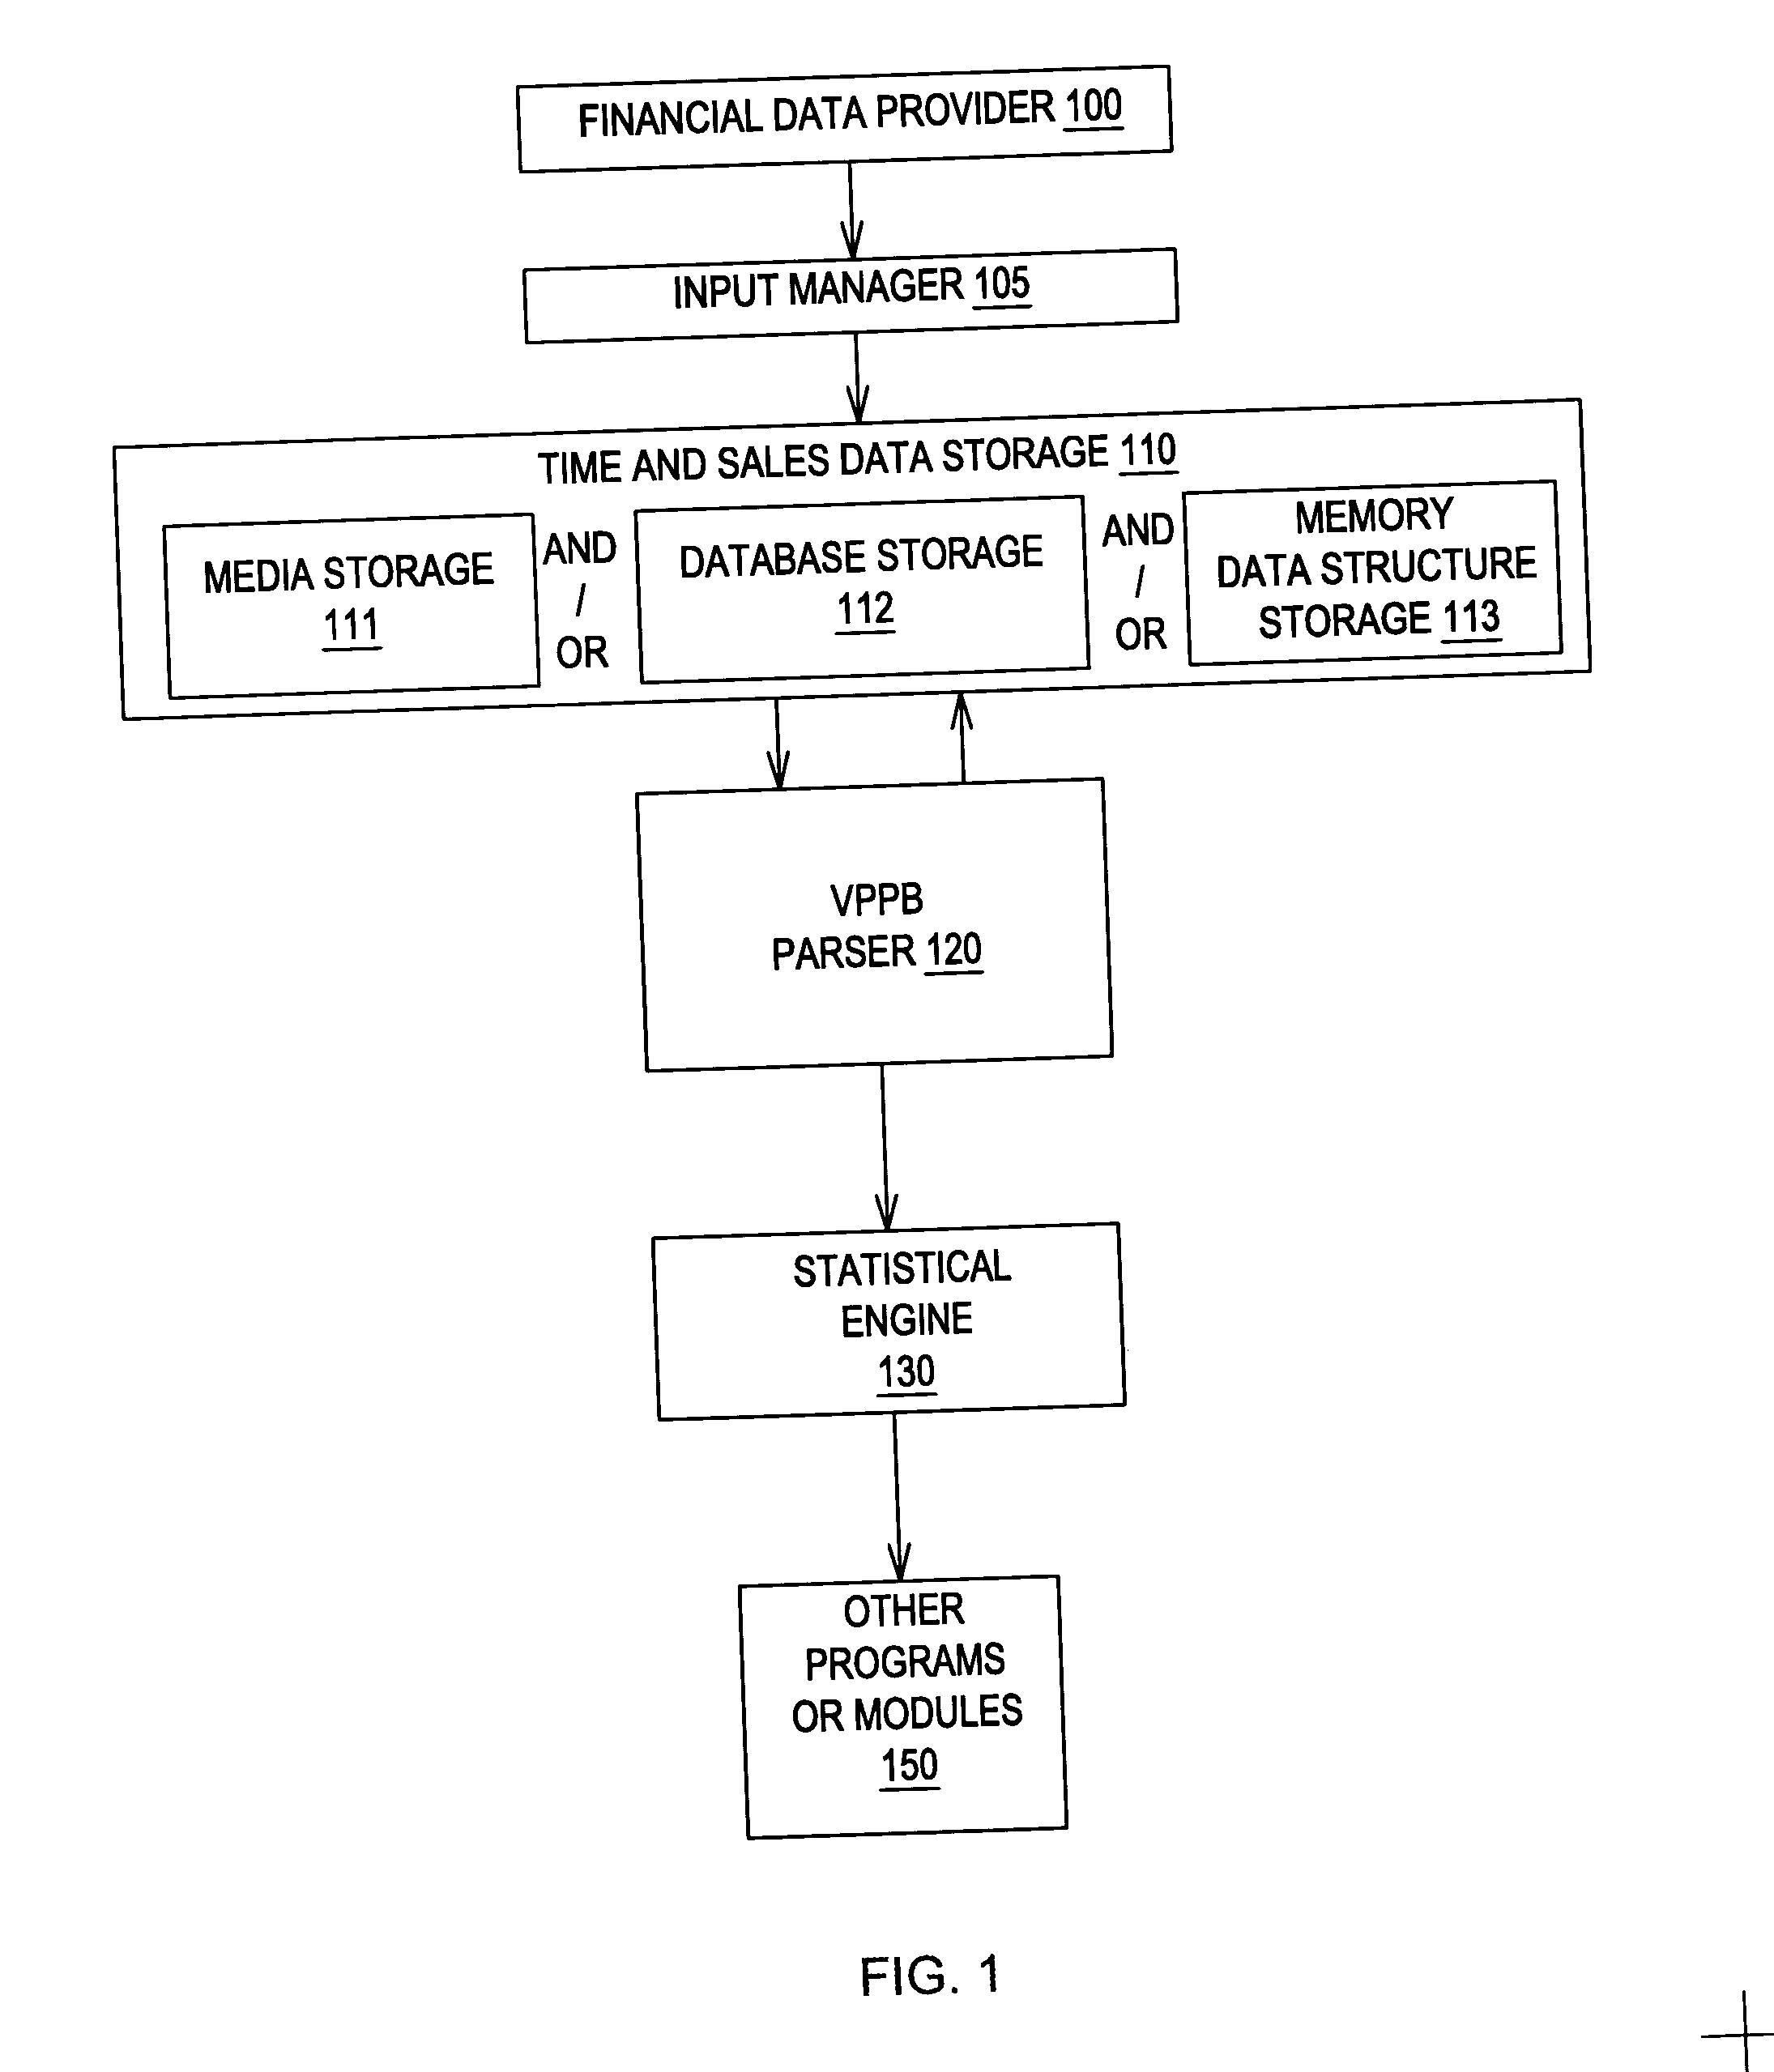
[0060] In a preferred embodiment the method of my invention runs in a computer system receiving market data in real time, and where:

[0061] a) The financial instrument is a stock in a public traded company.

[0062] b) Time intervals are user-selectable through an appropriate user interface, comprising 1, 2, 3, and 5-minute intervals choices.

[0063] c) Price brackets are user-selectable through an appropriate user interface comprising $0.01, $0.02, $0.03, $0.04, and $0.05 brackets choices.

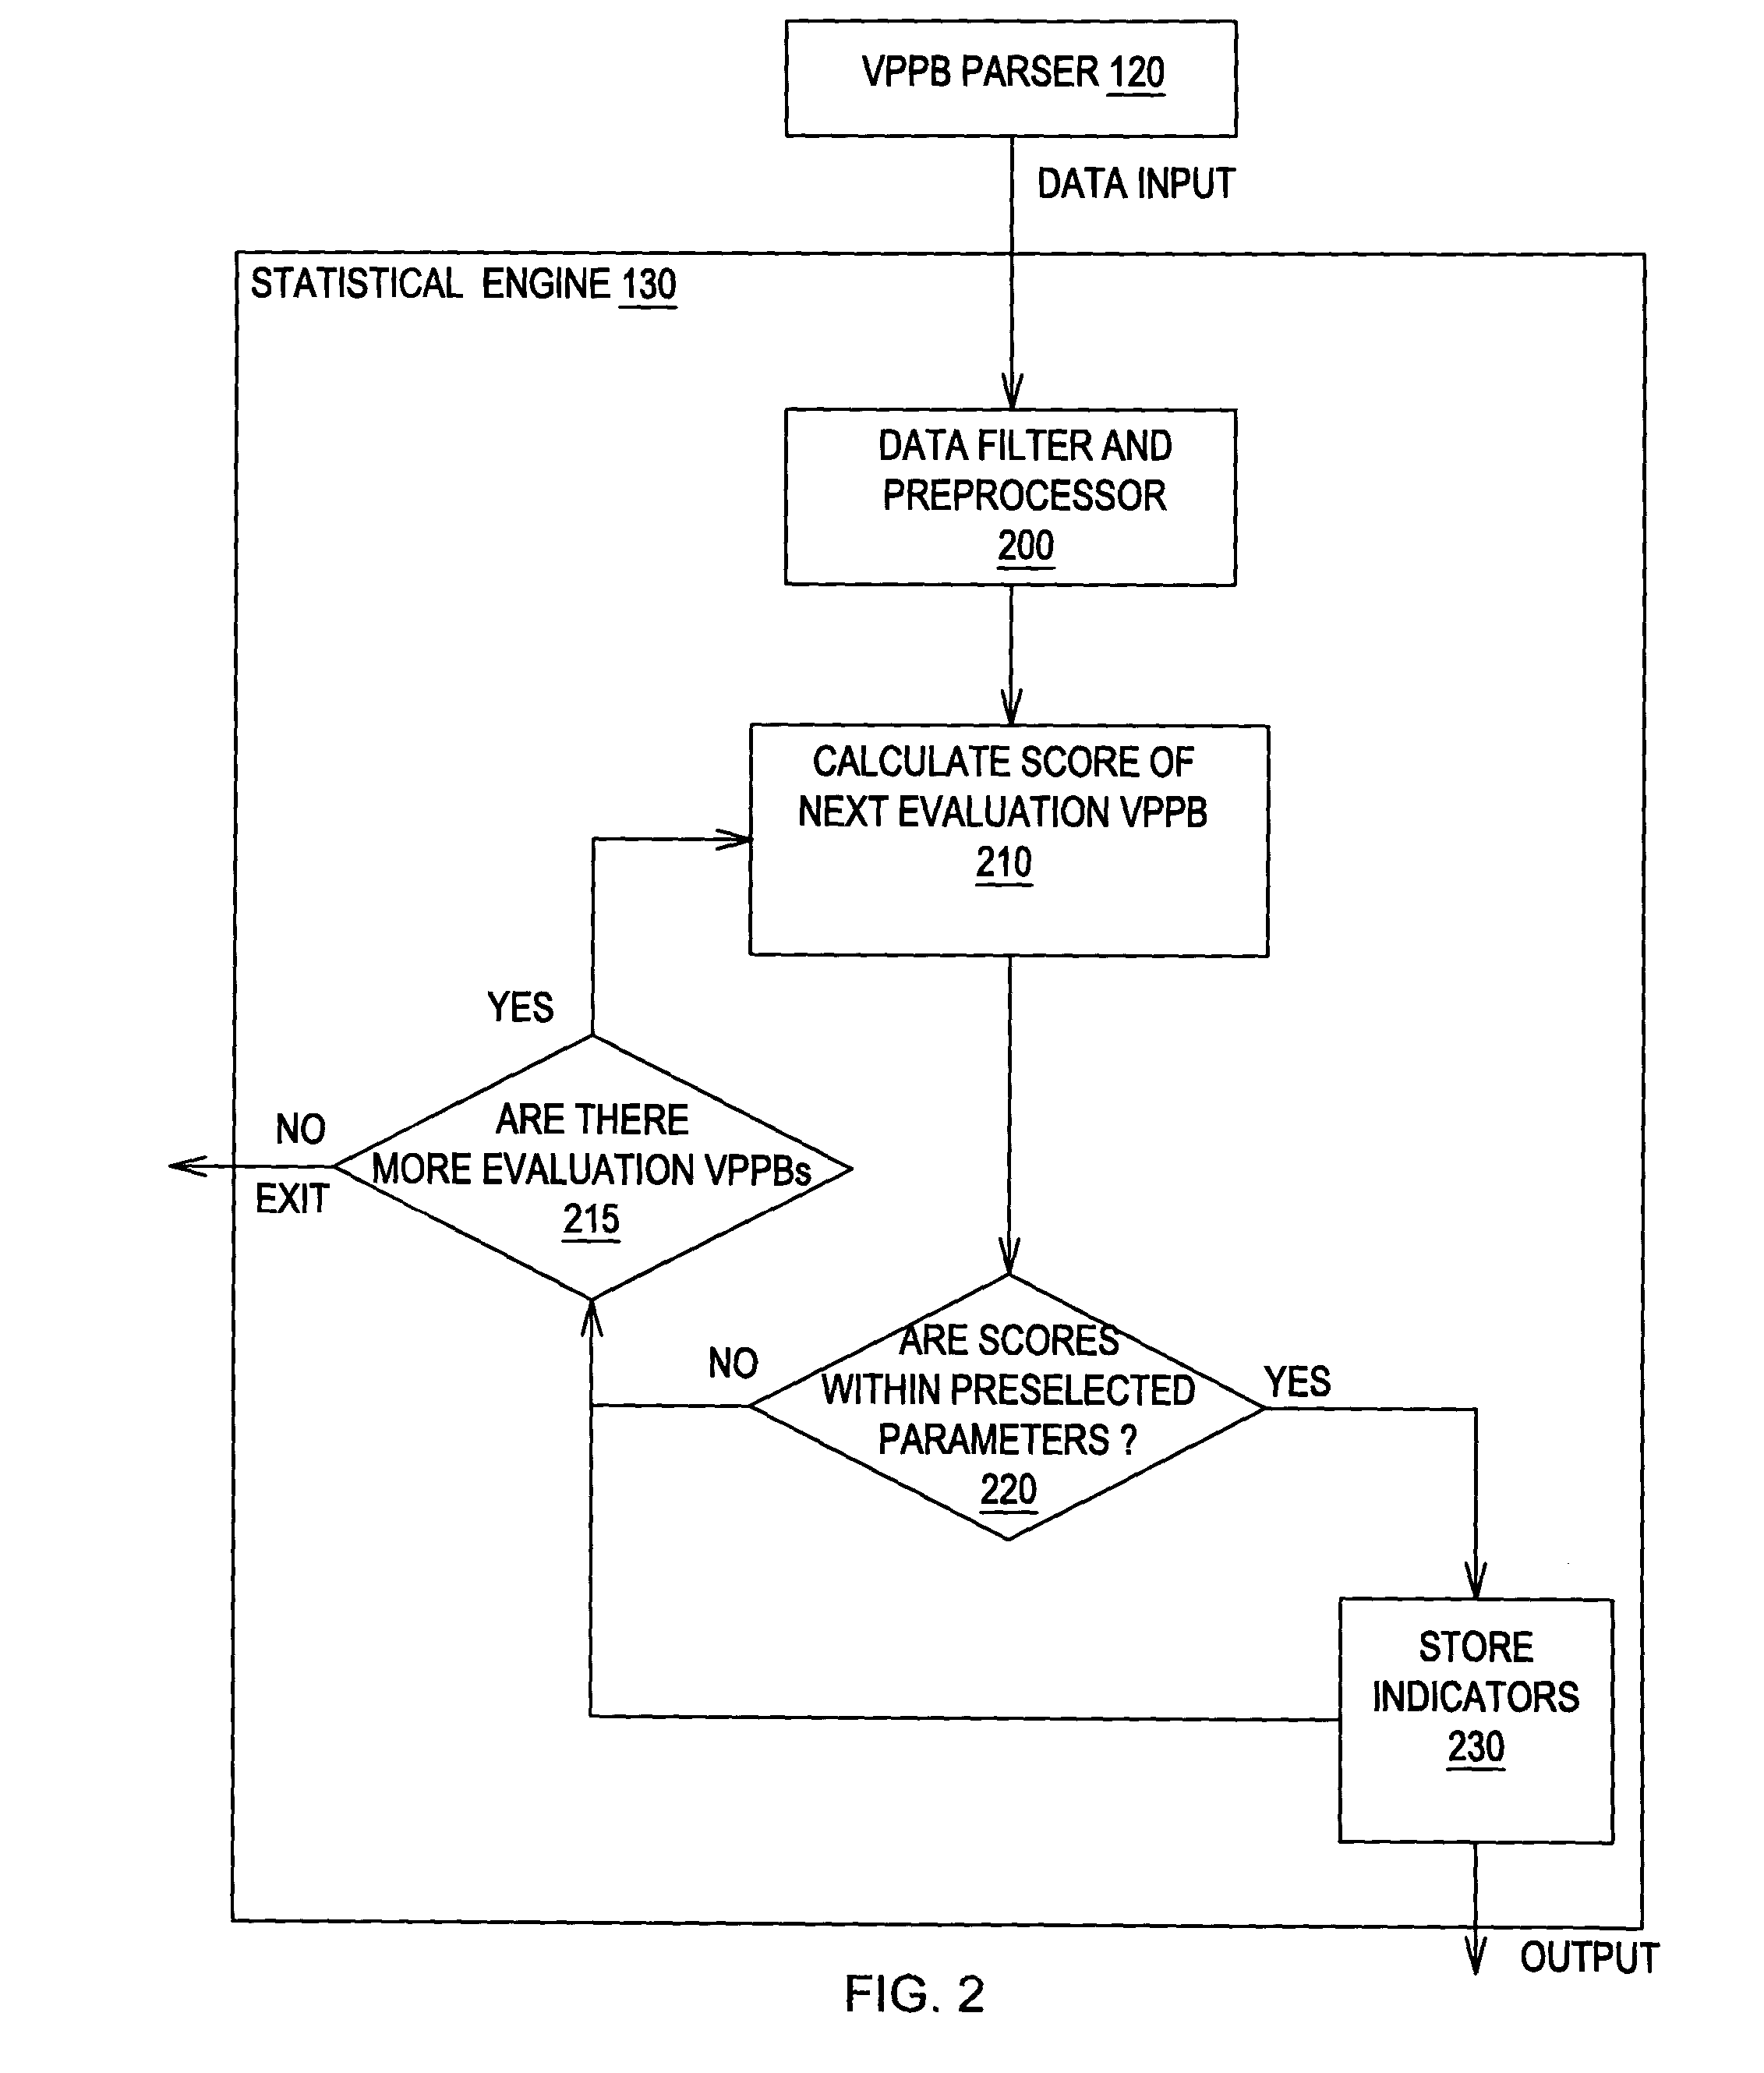
[0064] d) VPPBs are the aggregate volume of all transactions executed during one time interval and executed at prices within one price bracket.

[0065] e) The evaluation time interval is the time interval containing the current time.

[0066] f) The population subset is the subset of the VPPB set filtered to contain only all VPPBs corresponding to the 10 immediately previous time intervals.

[0067] g) The evaluation VPPB is the largest VPPB corresponding to the evaluation time interval.

[0068] h) The score is t...


PUM


Abstract

A method and system for providing trading indicators for selected instruments traded in a market such as stocks, currency contracts, bonds, commodities contracts, options contracts, and futures contracts. The method and system create trading indicators using Time and Sales data as provide by exchanges or financial data providers. The method comprise parsing time, price and volume of individual transactions into a collection of volume per price bracket per time interval quantities, wherein each quantity is an aggregate volume of transactions executed during one of a set of sequential time intervals and executed at prices within one of a set of price brackets. The method generate trading indicators by using mathematical algorithms to score individual volume per price bracket per time interval quantities corresponding to an evaluation time interval against a population of individual volume per price bracket per time interval quantities corresponding to a set of previous time intervals. The system generates trading indicators in real time, without the time lag associated to traditional technical analysis indicators. The method and system can also generate trend indicators based on analysis of volume accumulation, and defines trading indicators based on maximum volume prices.

Description

BACKGROUND OF INVENTION[0001] 1. Field of Invention[0002] This invention relates to market traded instruments such as stocks, currency contracts, bonds, commodities contracts, options contracts, and futures contracts. More particularly the invention relates to a method and system of trading indicators generated by applying mathematical algorithms to a set of aggregate volume of transactions occurred at narrow price brackets and at different time intervals.[0003] 2. Description of Prior Art[0004] My invention defines a computer implemented method and system of trading indicators for market traded instruments such as stocks, currency contracts, bonds, commodities contracts, options contracts, and futures contracts.[0005] My invention relates to a method and system of trading indicators created by applying mathematical algorithms to a collection of aggregate volume of transactions, each member of this collection being an aggregate volume of transactions occurred at narrow price bracket...

Claims


Application Information

Patent Timeline
Patent Type & Authority Applications(United States)
IPC IPC(8): G06F15/00G06F17/18G06Q40/04
CPCG06Q40/04
Inventor CHURQUINA, EDUARDO ENRIQUE
Owner CHURQUINA EDUARDO ENRIQUE
Why Eureka
Try Eureka