Method and internet based software for graphing sport statistics

a sport statistics and internet-based software technology, applied in data processing applications, 2d-image generation, instruments, etc., can solve the problems of not showing the statistical differentials, margins, or comparative sports statistical differentials of multiple sports contestants, and users may not chart statistical differentials, margins, of players or teams versus their opponents over tim

Inactive Publication Date: 2005-01-06
STRATEG E CONSULTING
View PDF25 Cites 69 Cited by
  • Summary
  • Abstract
  • Description
  • Claims
  • Application Information

AI Technical Summary

Benefits of technology

[0005] For example, participants playing in fantasy sports leagues often wish to obtain information as to how players or teams match up with each other by statistical category (e.g., points, rebounds, turnovers, pass defense, weight of the offensive line, etc.). Additionally, participants desire to obtain information relating to how a team has trended over varying time intervals (e.g., an entire season, the past thirty da...

Problems solved by technology

While websites such as these have met with some degree of success in providing software to graph sport data, there are still some inherent drawbacks.
In particular, none of these sites display comparative sports statistical differentials, or margins, of m...

Method used


Image

  • Method and internet based software for graphing sport statistics
  • Method and internet based software for graphing sport statistics
  • Method and internet based software for graphing sport statistics

Examples


Embodiment Construction

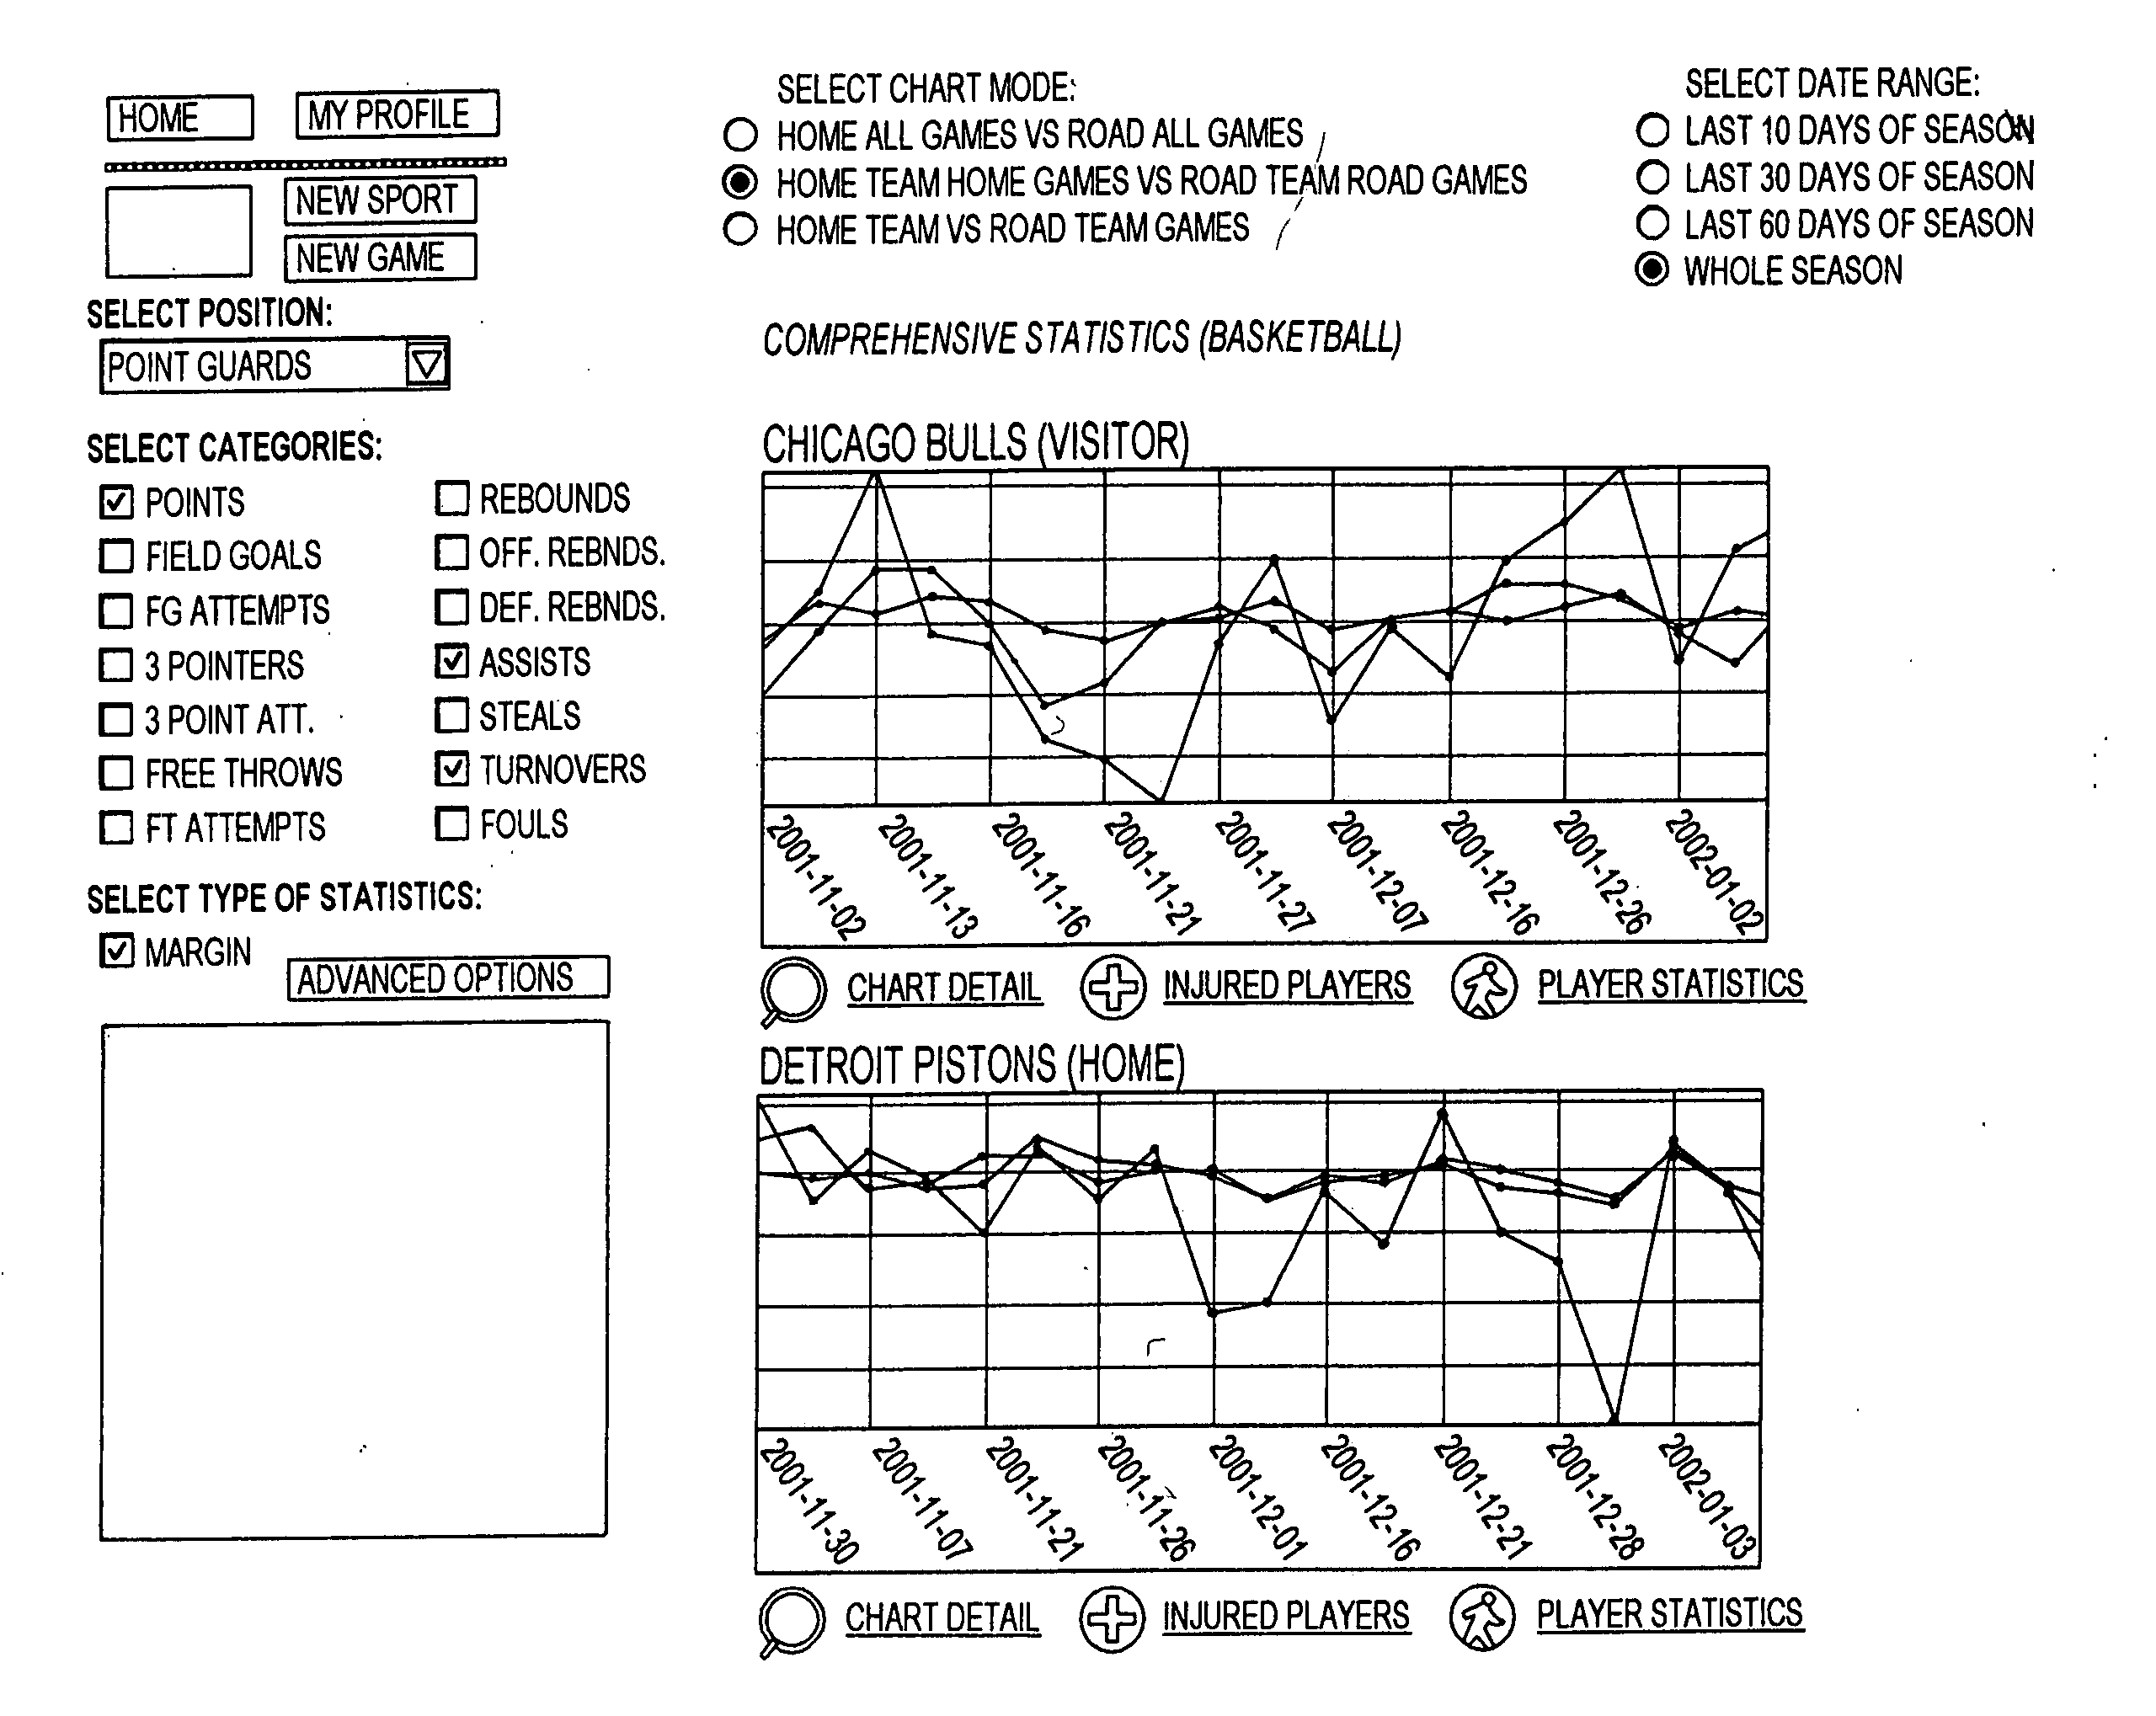
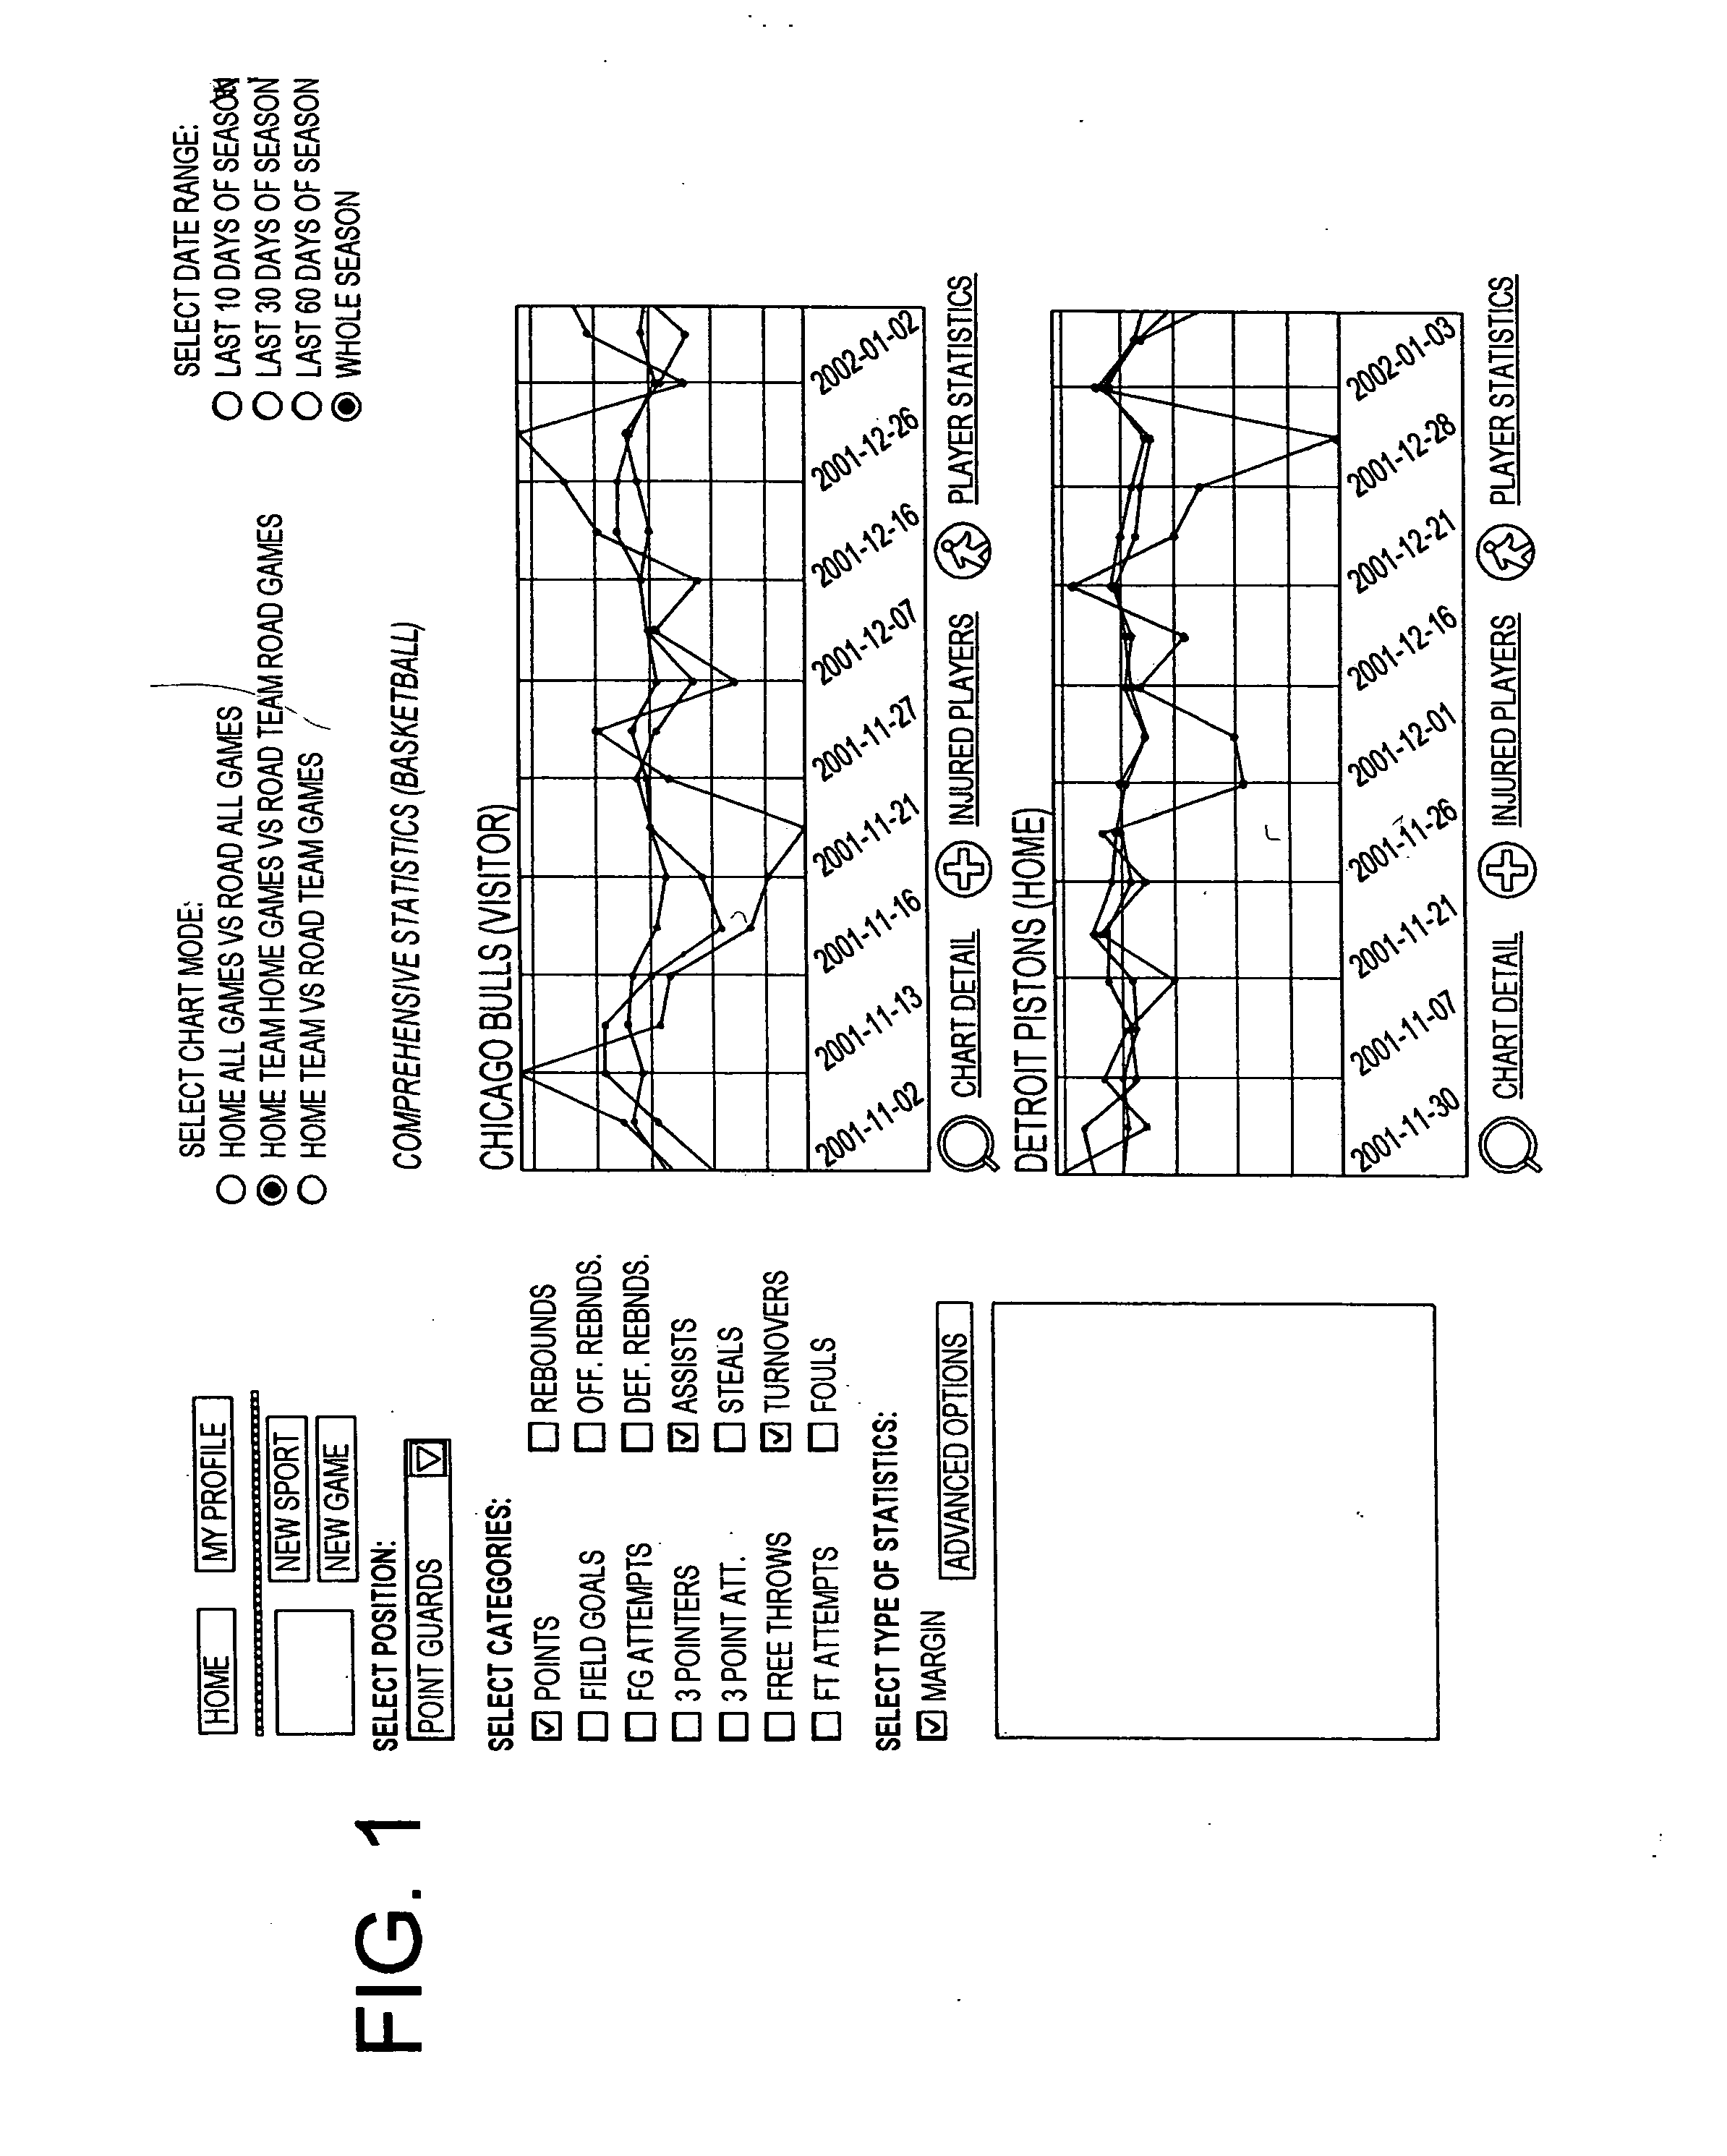
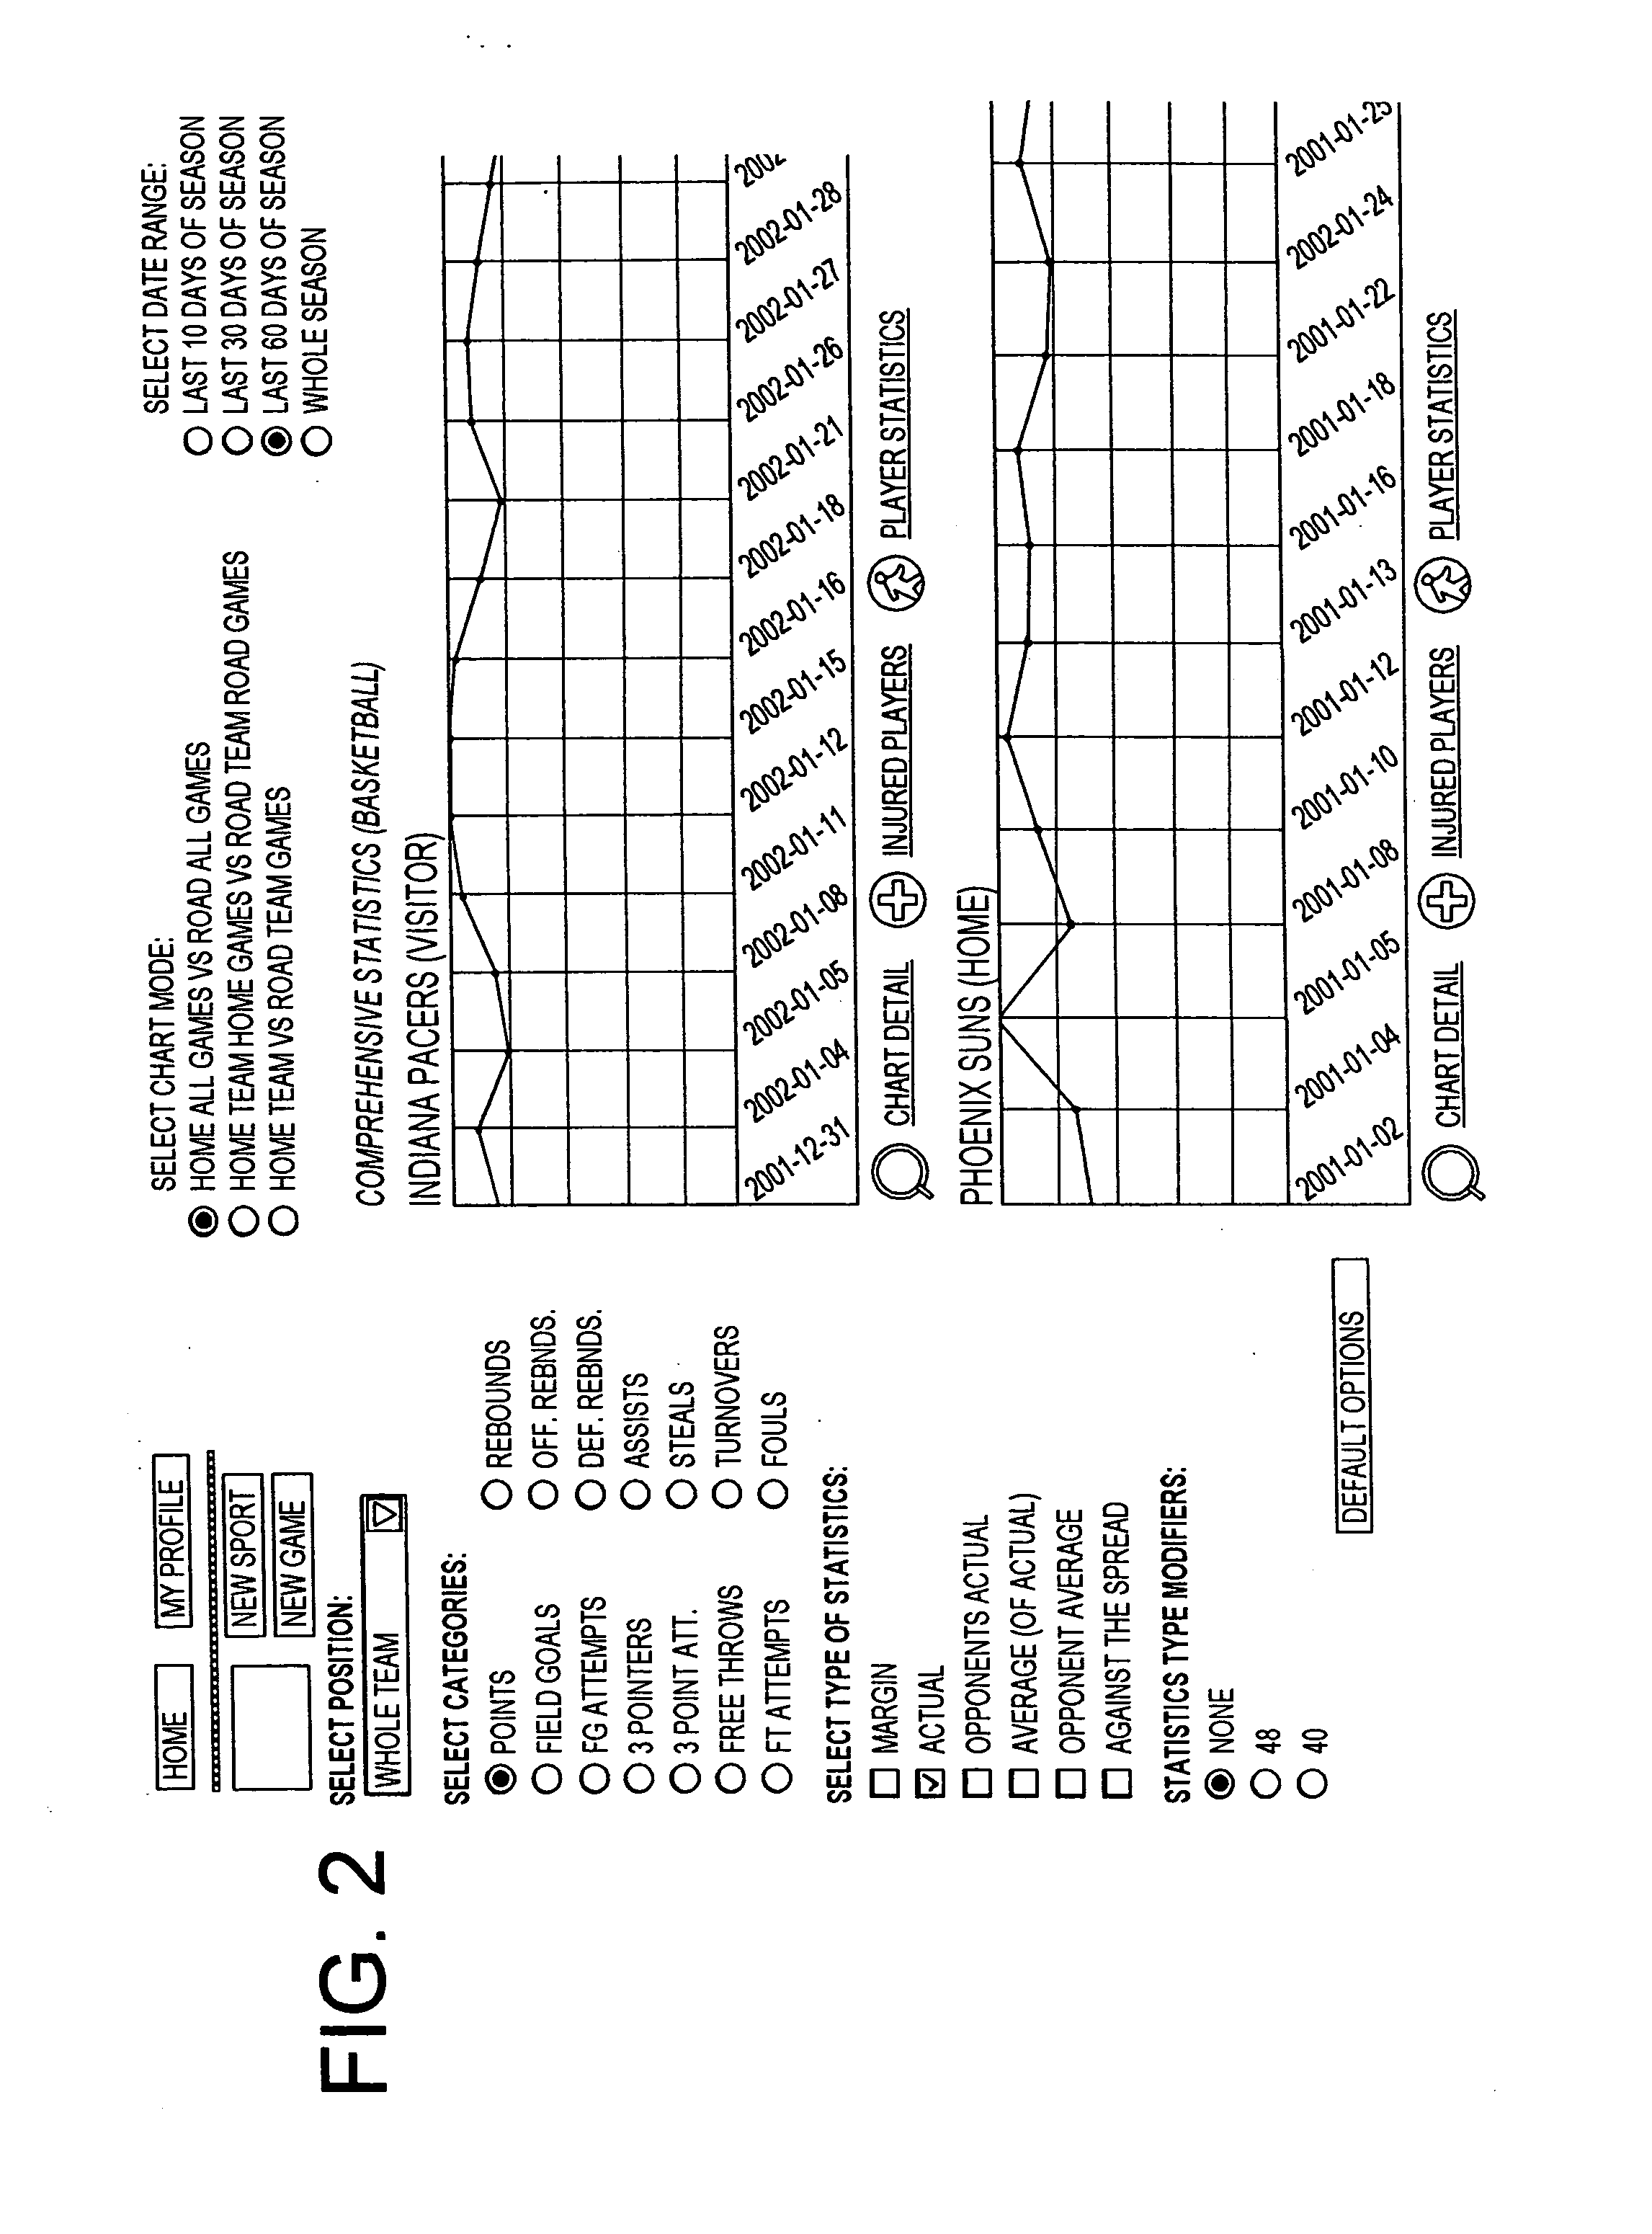
[0013] While this invention is susceptible to embodiment in many different forms, there is shown in the drawings, and will herein be described in detail, a preferred embodiment of the invention with the understanding that the present disclosure is to be considered as an exemplification of the principles of the invention and is not intended to limit the broad aspect of the invention to the embodiment illustrated.

[0014] The present invention relates to an Internet-based software having a network interface, typically an Internet website, that functions as a platform for analyzing and displaying a graphical representation of statistical sports data. The website provides services to users desiring to access comparative statistical data of individual and team athletic performances. Such users can include participants in community “fantasy” sports competitions or those interested in evaluating odds for purposes of engaging in legal wagering. The software is also useful for administrators,...


PUM


Abstract

A system and method for graphing sport statistics is disclosed. The method comprises the steps of: accessing a database storing sport data; receiving an input transmission of at least one sport entity identifier, wherein the sport entity identifier corresponds to either a player or a team; receiving an input transmission of at least one time interval; receiving an input transmission of at least one desired sport statistic and a plurality of sport data corresponding to the at least one sport entity and time interval identifier from the database; generating a graphical user interface image of a graph chart; and, plotting the transmitted sport data at a point corresponding to a correlative magnitude and point in time on the graphical user interface image; and, generating a graphical representation of the at least one desired sport statistic over the at least one time interval and corresponding to the at least one sport entity identifier.

Description

RELATED APPLICATIONS [0001] This application claims the benefit of U.S. Provisional Application No. 60 / 361,145, filed Mar. 1, 2002.TECHNICAL FIELD [0002] The invention relates to a system and method for graphing sport statistics. More particularly, the invention is directed to an Internet based system and method for graphing statistical differentials, or margins, between sports players and / or teams and their respective opponents over time. BACKGROUND OF THE INVENTION [0003] The growth of the Internet has fueled the development of a variety of Internet-based forums in which to obtain sport statistics, and provide shared access to such sport statistics to communities of Internet users. These include web pages that can be downloaded and displayed concurrently by many different Internet users, as well as a wide variety of interactive, Internet-based statistic gathering systems. [0004] Sports enthusiasts, including participants in Internet community sports, and Internet sports prognostic...

Claims


Application Information

Patent Timeline
IPC IPC(8): G06F3/033G06F3/048G06Q30/00G06T11/20
CPCG06F3/0481G06T11/206G06Q30/02
Inventor SHANNON, MICHAEL P.
Owner STRATEG E CONSULTING
Why Eureka
Try Eureka