Computer display system for dynamically modifying stacked area line graphs to change the order or presence of a set of stacked areas in the graph respectively representative of the proportions contributed to a total by each of a set of time dependent variables

a computer display system and stacked area technology, applied in computing, instruments, drawing from basic elements, etc., can solve the problems of not having an effective system or method for manipulating individual contributing elements as represented by layers or areas in stacks, and achieve the effect of facilitating presentation and manipulation, and being particularly effectiv

Active Publication Date: 2005-06-09
IBM CORP
View PDF7 Cites 87 Cited by
  • Summary
  • Abstract
  • Description
  • Claims
  • Application Information

AI Technical Summary

Benefits of technology

[0006] The present invention provides a user friendly display interface that facilitates the presentation and manipulation of a computer displayed stacked area line graph. Accordingly, the broadest aspect of this invention provides a computer implemented user interactive system, method and computer program for graphically displaying the proportion of a total value of a time dependent variable contributed by each of a set of elements. The invention is applicable in a graph environment comprising the steps of displaying the proportion contributed by each element as an area within an ordered set of areas under a line representative of the total value of said time dependent variable. In the invention, the user is enabled to interactively select one area in the set of areas and perform one of the following operations: hiding the selected area, displaying the selected area or reordering the position of the selected area within said ordered set responsive to said user selection. This implementation is

Problems solved by technology

Along with this benefit comes the problem of how to present the great number and variety of available elements to the interactive operator or user in display interfaces that are relatively easy to use.
While such systems in which the set of elements each contribute to th

Method used


Image

  • Computer display system for dynamically modifying stacked area line graphs to change the order or presence of a set of stacked areas in the graph respectively representative of the proportions contributed to a total by each of a set of time dependent variables
  • Computer display system for dynamically modifying stacked area line graphs to change the order or presence of a set of stacked areas in the graph respectively representative of the proportions contributed to a total by each of a set of time dependent variables
  • Computer display system for dynamically modifying stacked area line graphs to change the order or presence of a set of stacked areas in the graph respectively representative of the proportions contributed to a total by each of a set of time dependent variables

Examples


Embodiment Construction

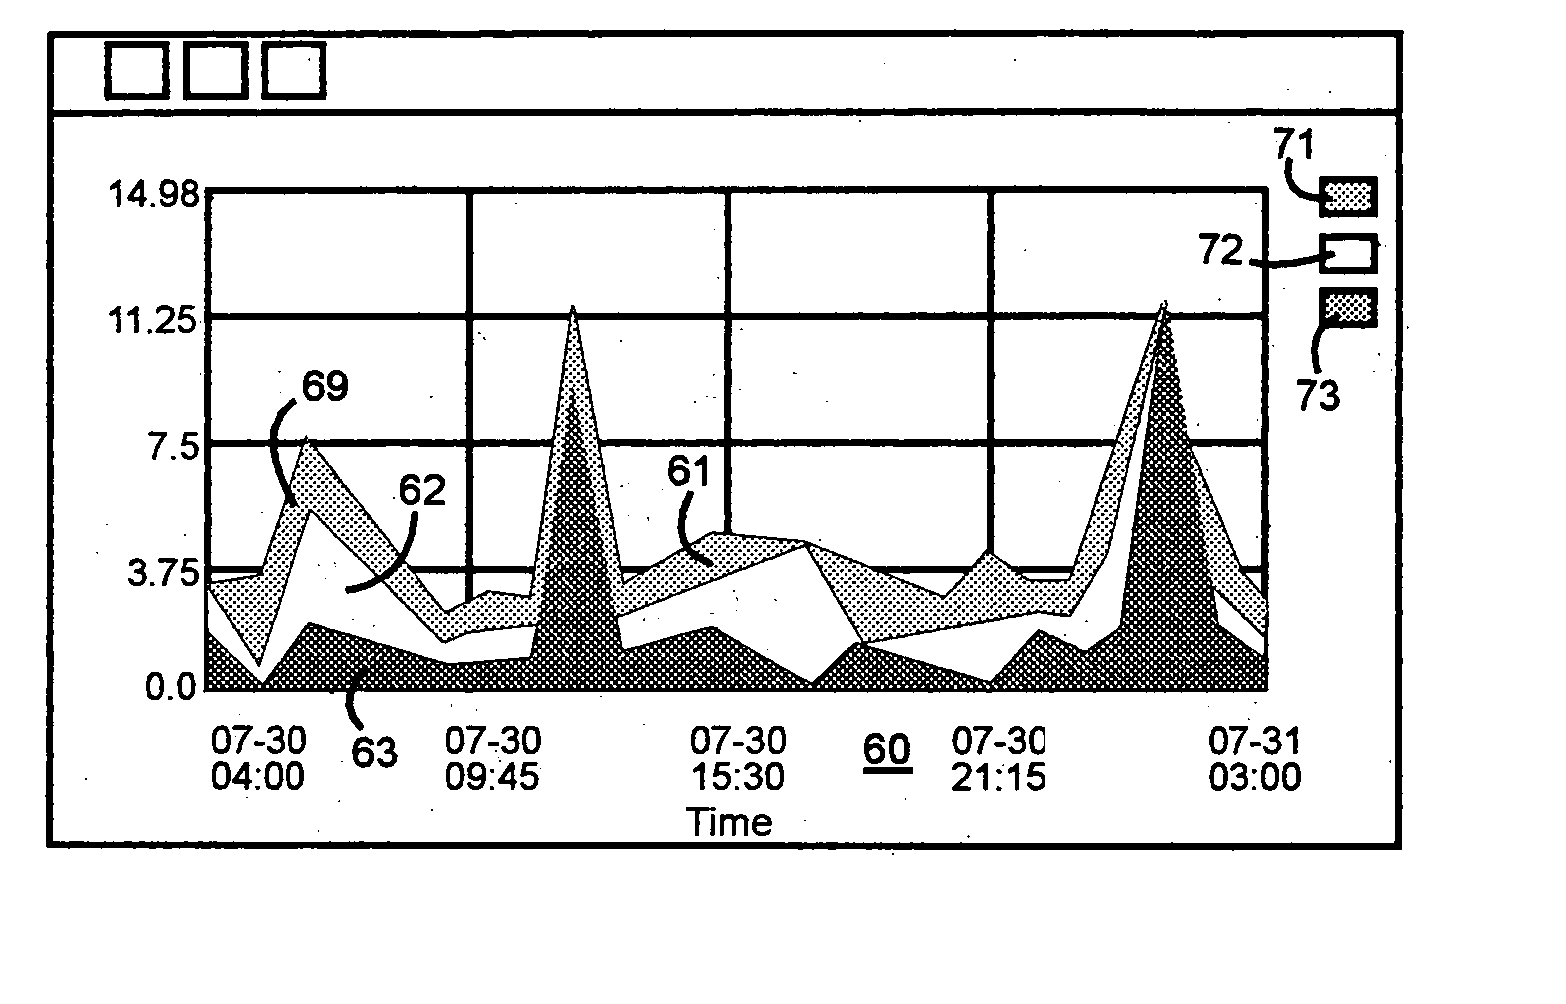
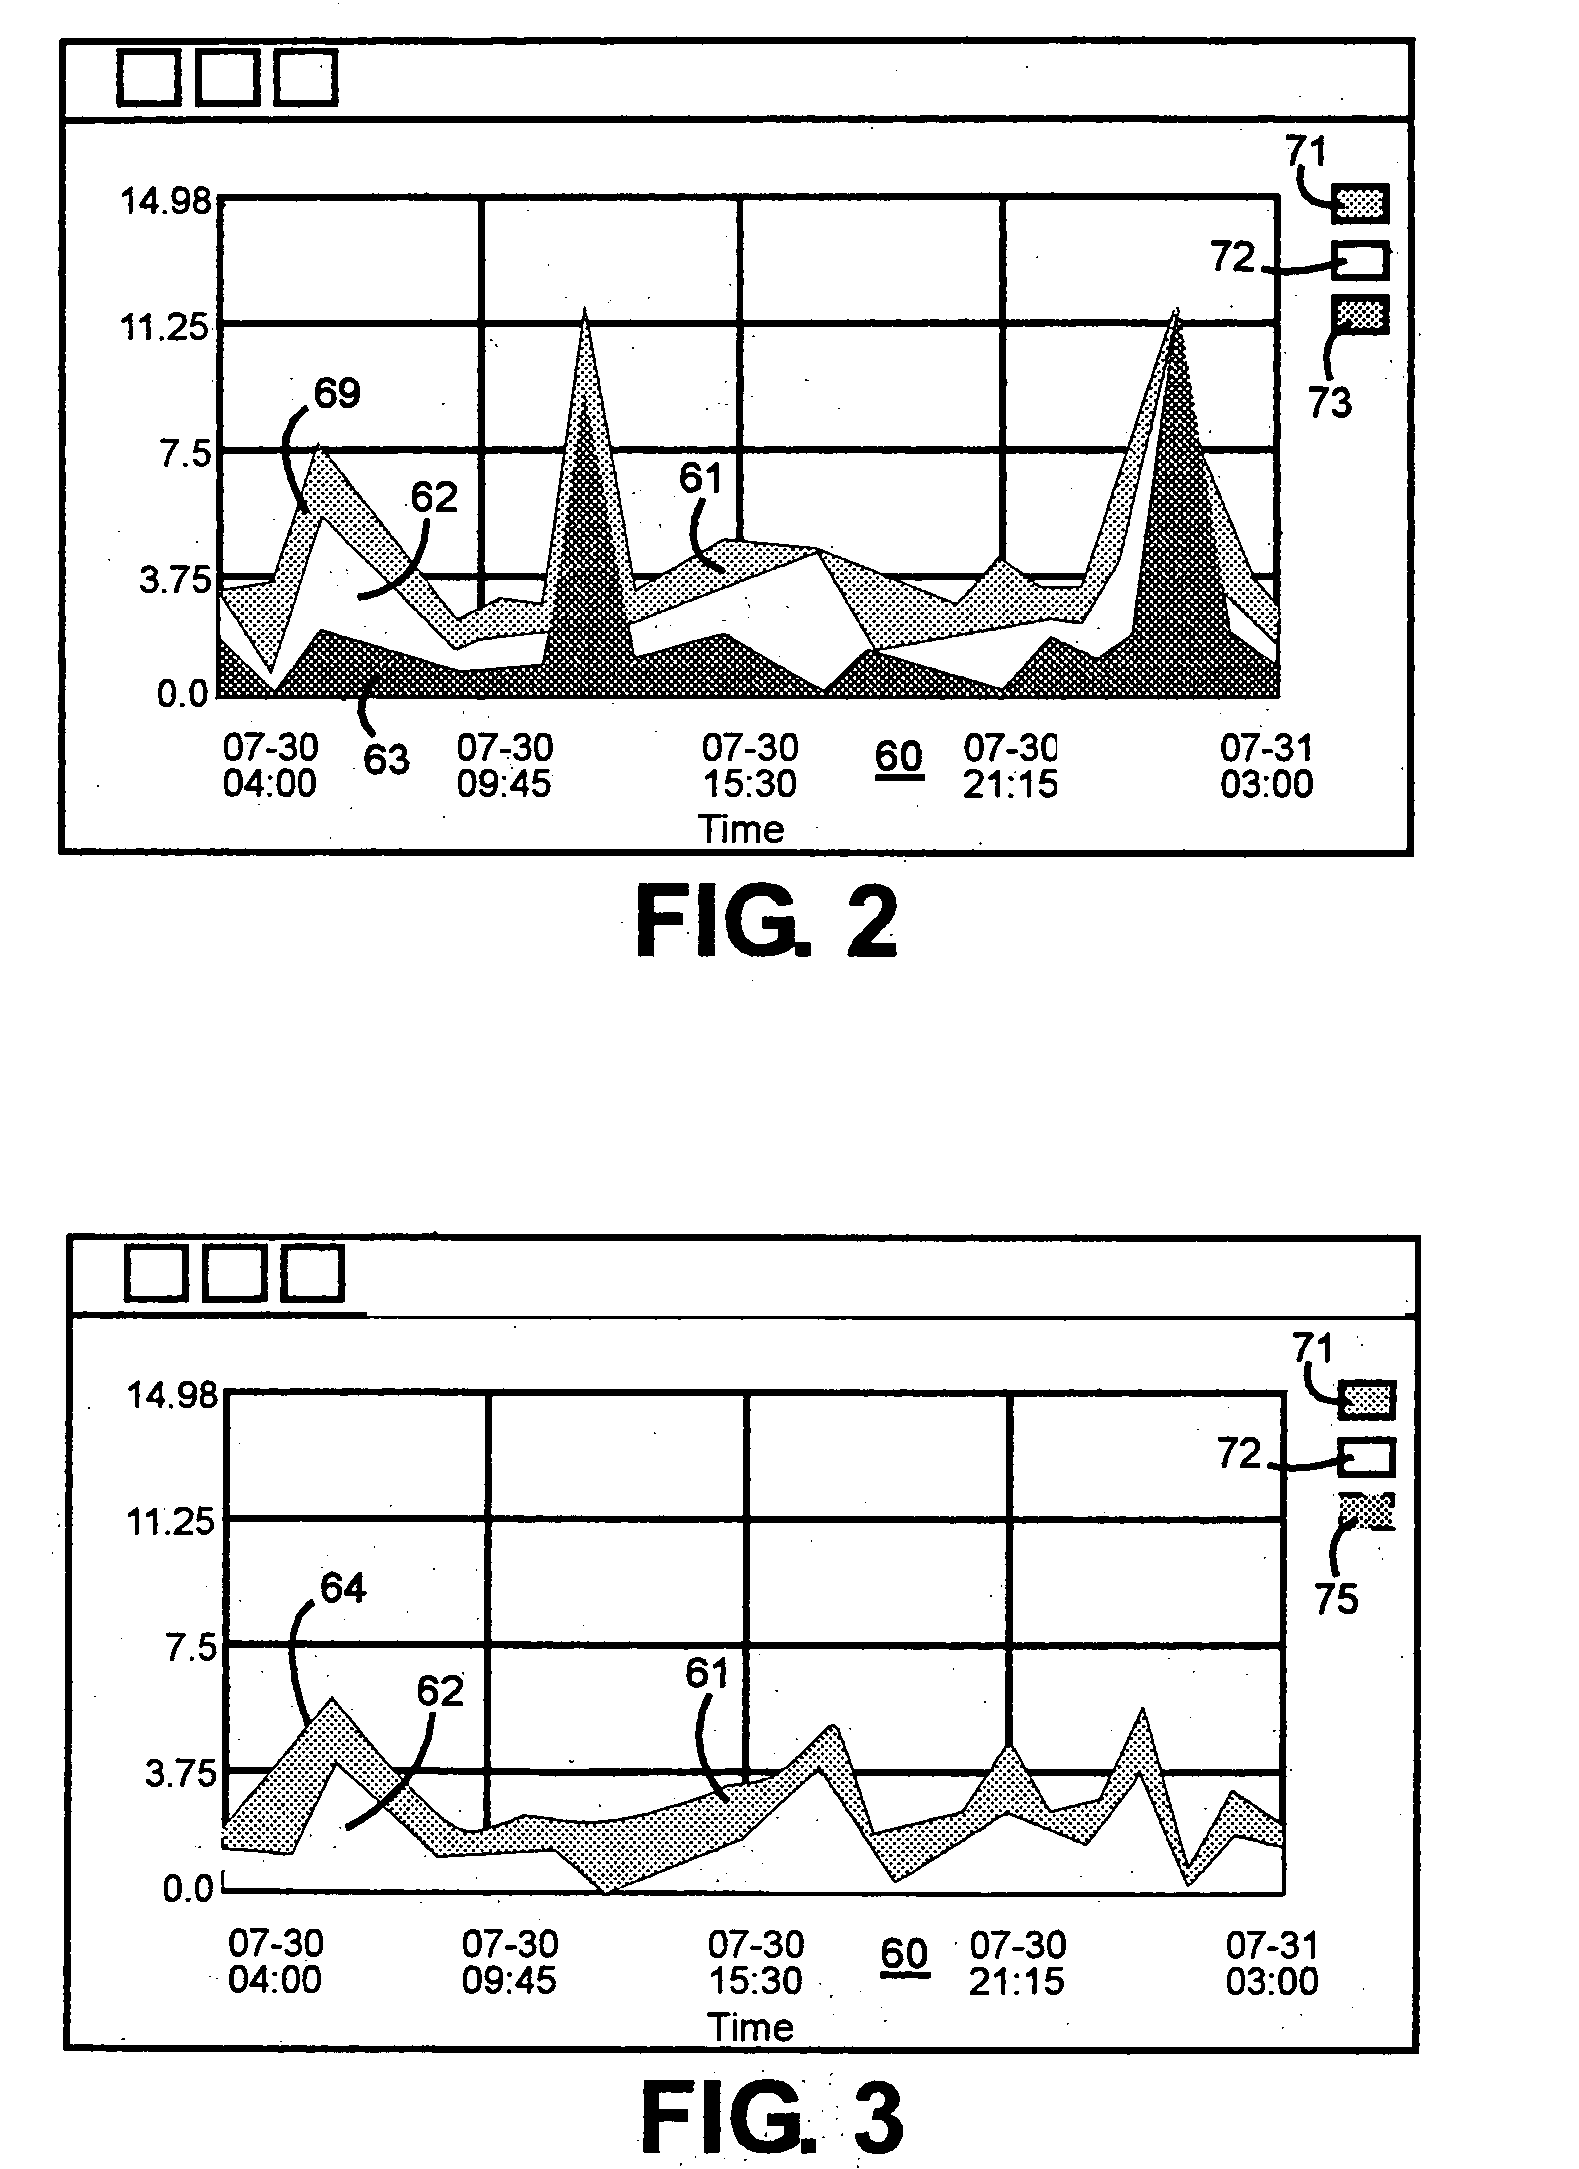
[0015] Referring to FIG. 1, a typical data processing computer controlled display is shown that may function as a basic computer controlled Web receiving terminal used in implementing the present invention for displaying and manipulating stacked area line graphs. A central processing unit (CPU) 10, such as one of the PC microprocessors or workstations, e.g. RISC System / 6000™ series available from International Business Machines Corporation (IBM), or Dell PC microprocessors, is provided and interconnected to various other components by system bus 12. An operating system 41 runs on CPU 10, provides control and is used to coordinate the function of the various components of FIG. 1. Operating system 41 may be one of the commercially available operating systems, such as IBM's AIX 6000™ operating system or Microsoft's WindowsXP™ or Windows2000™, as well as UNIX and other IBM AIX operating systems. Application programs 40, controlled by the system, are moved into and out of the main memory...


PUM


Abstract

Graphically displaying the proportion of a total value of a time dependent variable contributed by each of a set of elements. Applicable in a graph environment comprising the steps of displaying the proportion contributed by each element as an area within an ordered set of areas under a line representative of the total value of said time dependent variable. The user is enabled to interactively select one area in the set of areas and perform one of the following operations: hiding the selected area, displaying the selected area or reordering the position of the selected area within said ordered set responsive to said user selection. This implementation is effective in the manipulation of stacked area line graphs by visualizing how the various areas representative of the contributions of the individual elements to the whole time dependent variable affect and coact with the other variables in the set.

Description

TECHNICAL FIELD [0001] The present invention relates to the display of graphs in interactive computer controlled display systems and particularly to the display of stacked area graphs. BACKGROUND OF RELATED ART [0002] Computers and their application programs are used in all aspects of business, industry and academic endeavors. In recent years, there has been a technological revolution driven by the convergence of the data processing industry with the consumer electronics industry. This advance has been even further accelerated by the extensive consumer and business involvement in the Internet. As a result of these changes, it seems as if virtually all aspects of human productivity in the industrialized world require human / computer interaction. The computer industry has been a force for bringing about great increases in business and industrial productivity. [0003] In addition, the computer and computer related industries have benefitted from a rapidly increasing availability of data ...

Claims


Application Information

Patent Timeline
IPC IPC(8): G06T11/20
CPCG06T11/206
Inventor TWAIT, JOSHUA GUNNAR
Owner IBM CORP
Why Eureka
Try Eureka