Method for analyzing trade data

a trade data and analysis method technology, applied in the field of information retrieval and analysis systems, can solve the problems of inability to analyze trade data from multiple perspectives quickly, simultaneously, and dynamically, loss of information about price versus volume, time-consuming and difficult, if not impossible, to prepare with existing applications,

Inactive Publication Date: 2005-08-25
MDB ANALYTICS
View PDF14 Cites 55 Cited by
  • Summary
  • Abstract
  • Description
  • Claims
  • Application Information

AI Technical Summary

Problems solved by technology

A shortfall of the prior art analysis software has been the inability to analyze trade data from multiple perspectives quickly, simultaneously, and dynamically.
Information about price versus volume may be lost when analyzing price versus time, and some desirable charts and graphs may be time consuming and difficult, if not impossible, to prepare with existing applications.
The prior art may not permit the user to extract much of the useful information that exists in these data.
Until now, there has been no adequate way to analyze price, statistical trade measures, and other trade data against volume and against time, both simultaneously and dynamically, according to the user's preferences.

Method used


Image

  • Method for analyzing trade data
  • Method for analyzing trade data
  • Method for analyzing trade data

Examples


example 1

12.1 Example 1

[0186] The method describe in the above written description may be used to gain insight into financial market movement and reactions to internal market and external events.

[0187] In one example, a user, or trader, may be a member trader at the Chicago Board of Trade, belonging to the CTI1 trader group, and may want to prepare for trading during the week of Feb. 9th-14th, 2004 on Feb. 6th, 2004. The trader may be interested in 10-year notes future contracts.

[0188] The trader may know that on Feb. 7th and 8th, 2004, G7 will meet in Boca Raton, Fla., to discuss the U.S. dollar weakness and any policy change may have significant volatility implications for U.S. stocks and bonds. The trader also may know that the U.S. treasury will auction $24 billion in 3-year notes on February 10th, $16 billion in 5-year notes on February 11th, and $16 billion in 10th-year notes on Feb. 12th, 2004.

[0189] The trader may want to know the net exposure of the CTI4 trader group, other, non-...

example 2

12.2 Example 2

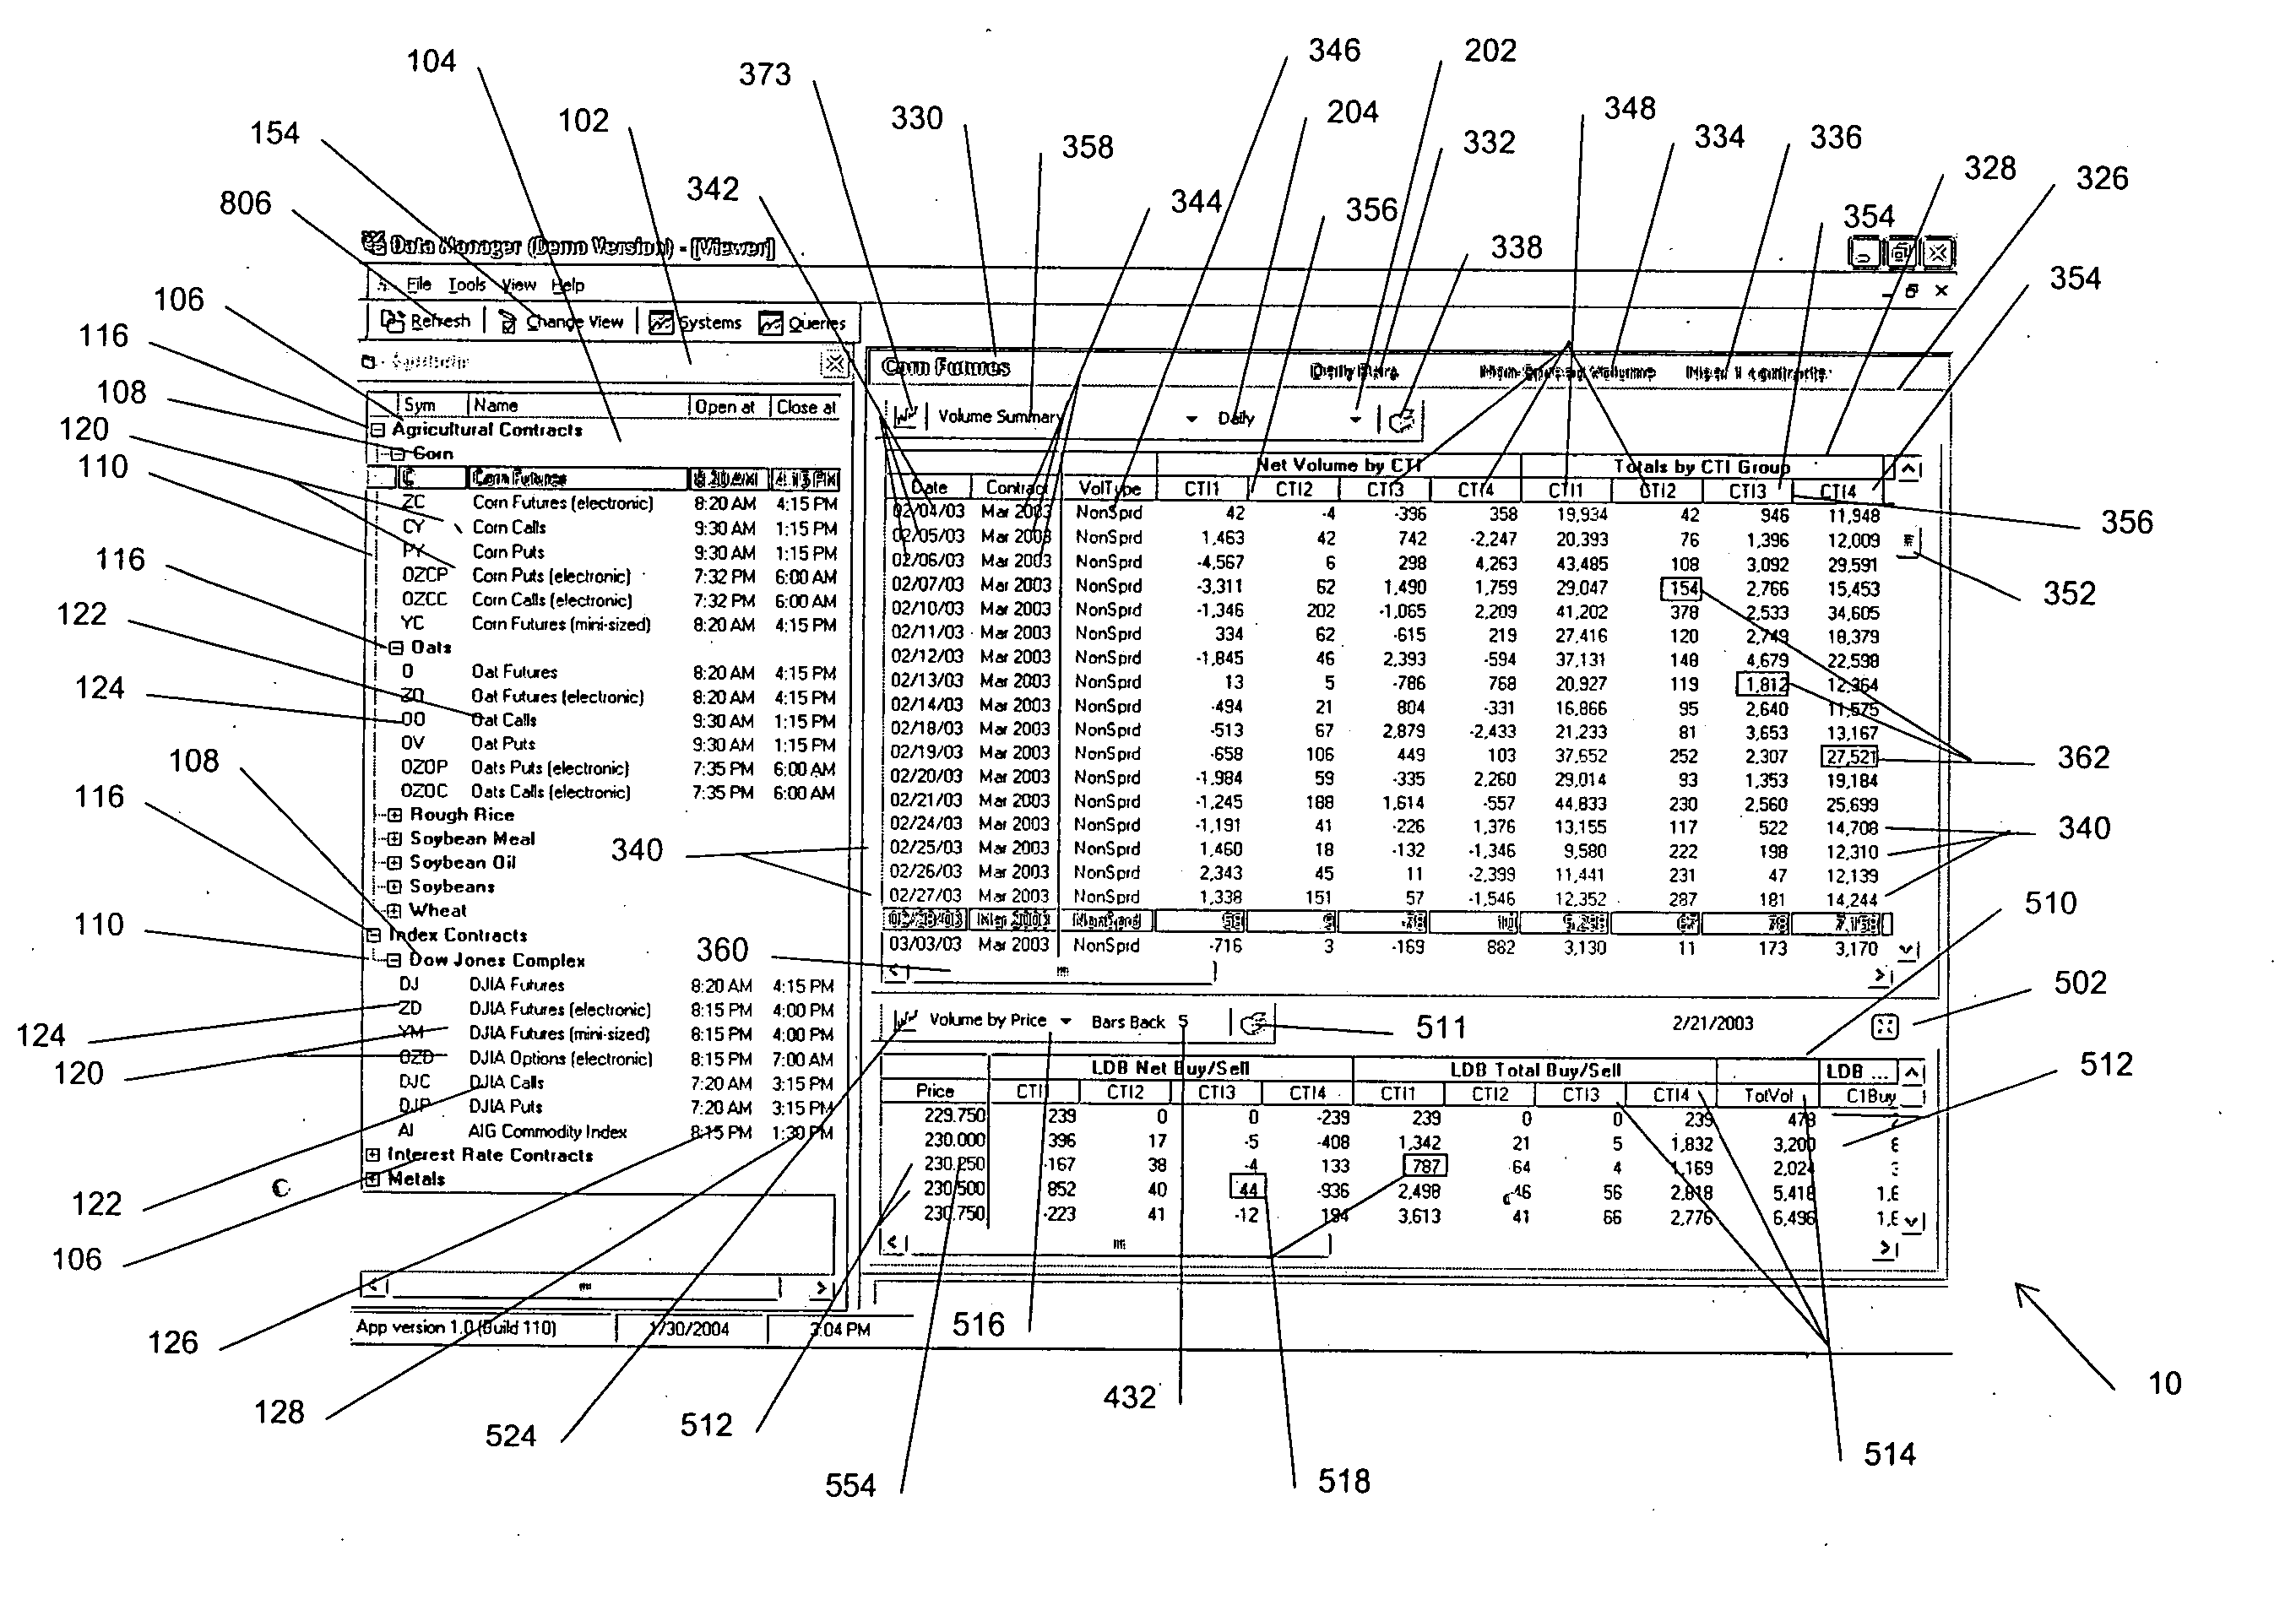
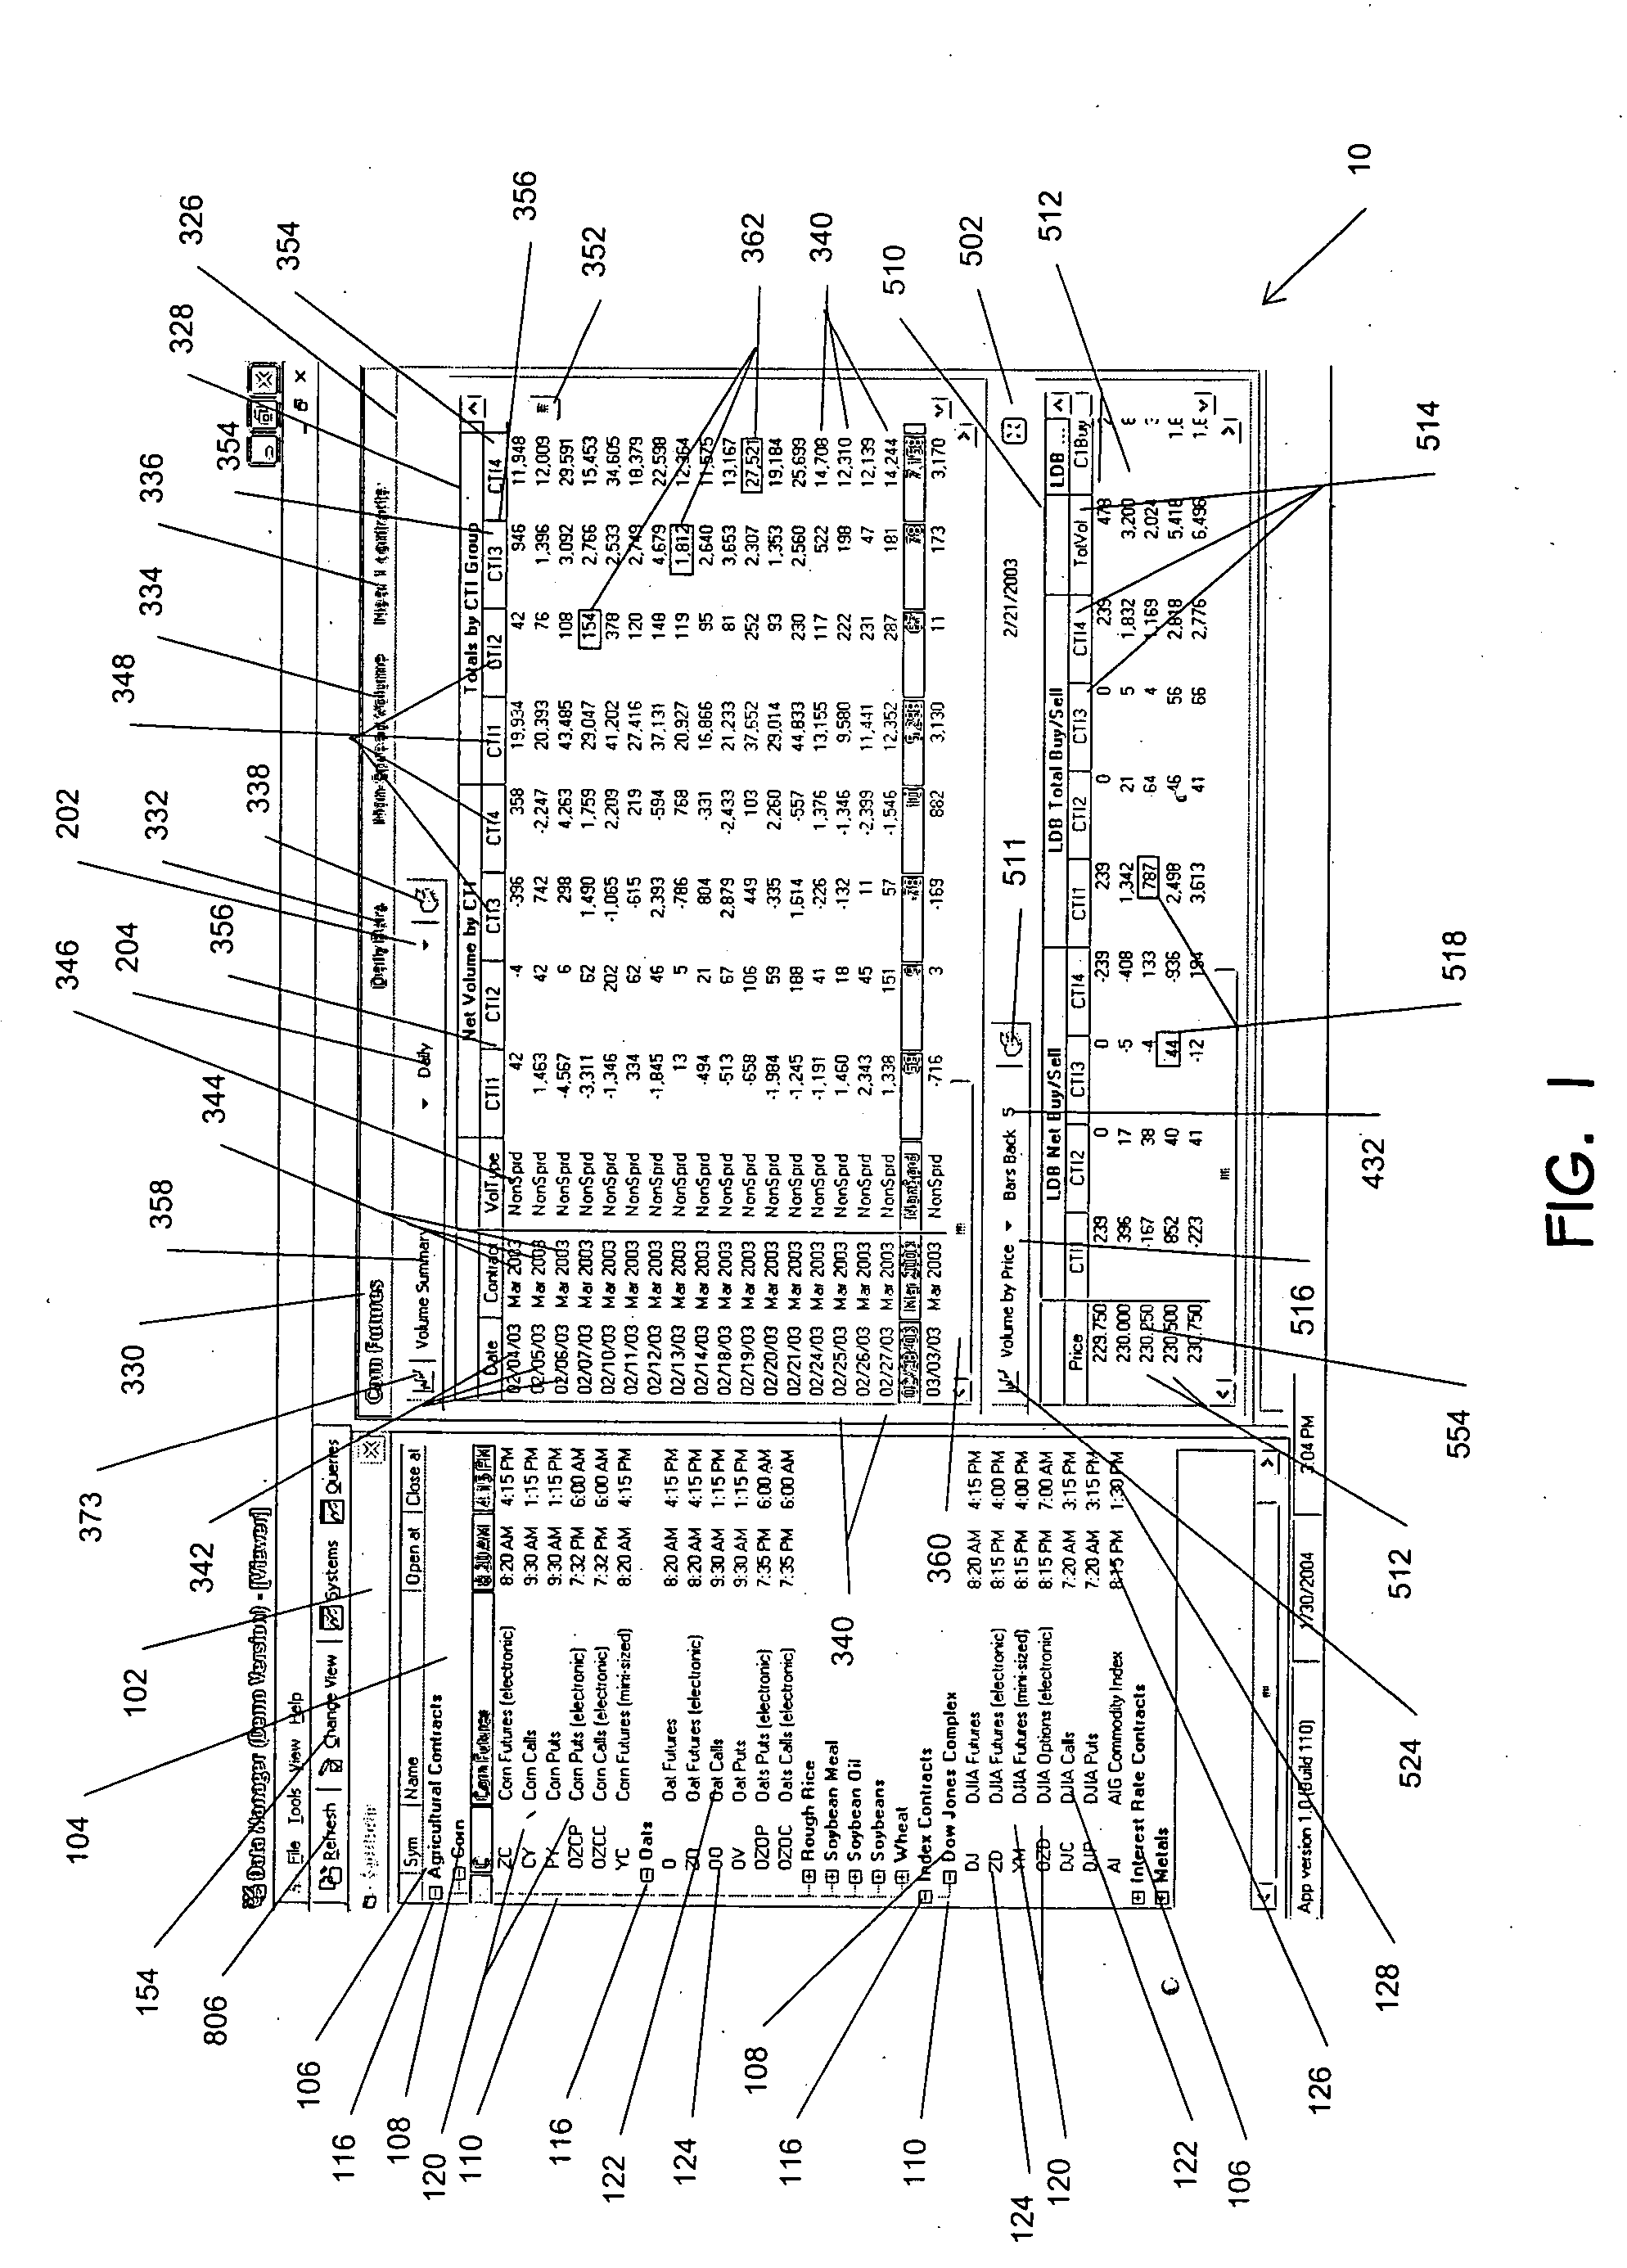
[0194] In another example, the user may select a financial product, e.g., soybean futures, for the past 3 months. The user may plot the price versus time units in the time unit graph 370 (FIG. 5). In the price zone table 510, the user may find that the highest trade volume corresponds to a price zone 554 have a range of $797 to $800. The user may click this price zone 554 and draw a price line 602 on the time unit graph 370 which may highlight trade data corresponding to $797 to $800. The user may find that the price has been oscillating up and down and “bumping” the bottom of the price line 602. Thus, the user may decide that the price for the financial product is hitting an area of resistance between $797 and $800.

13. Remarks

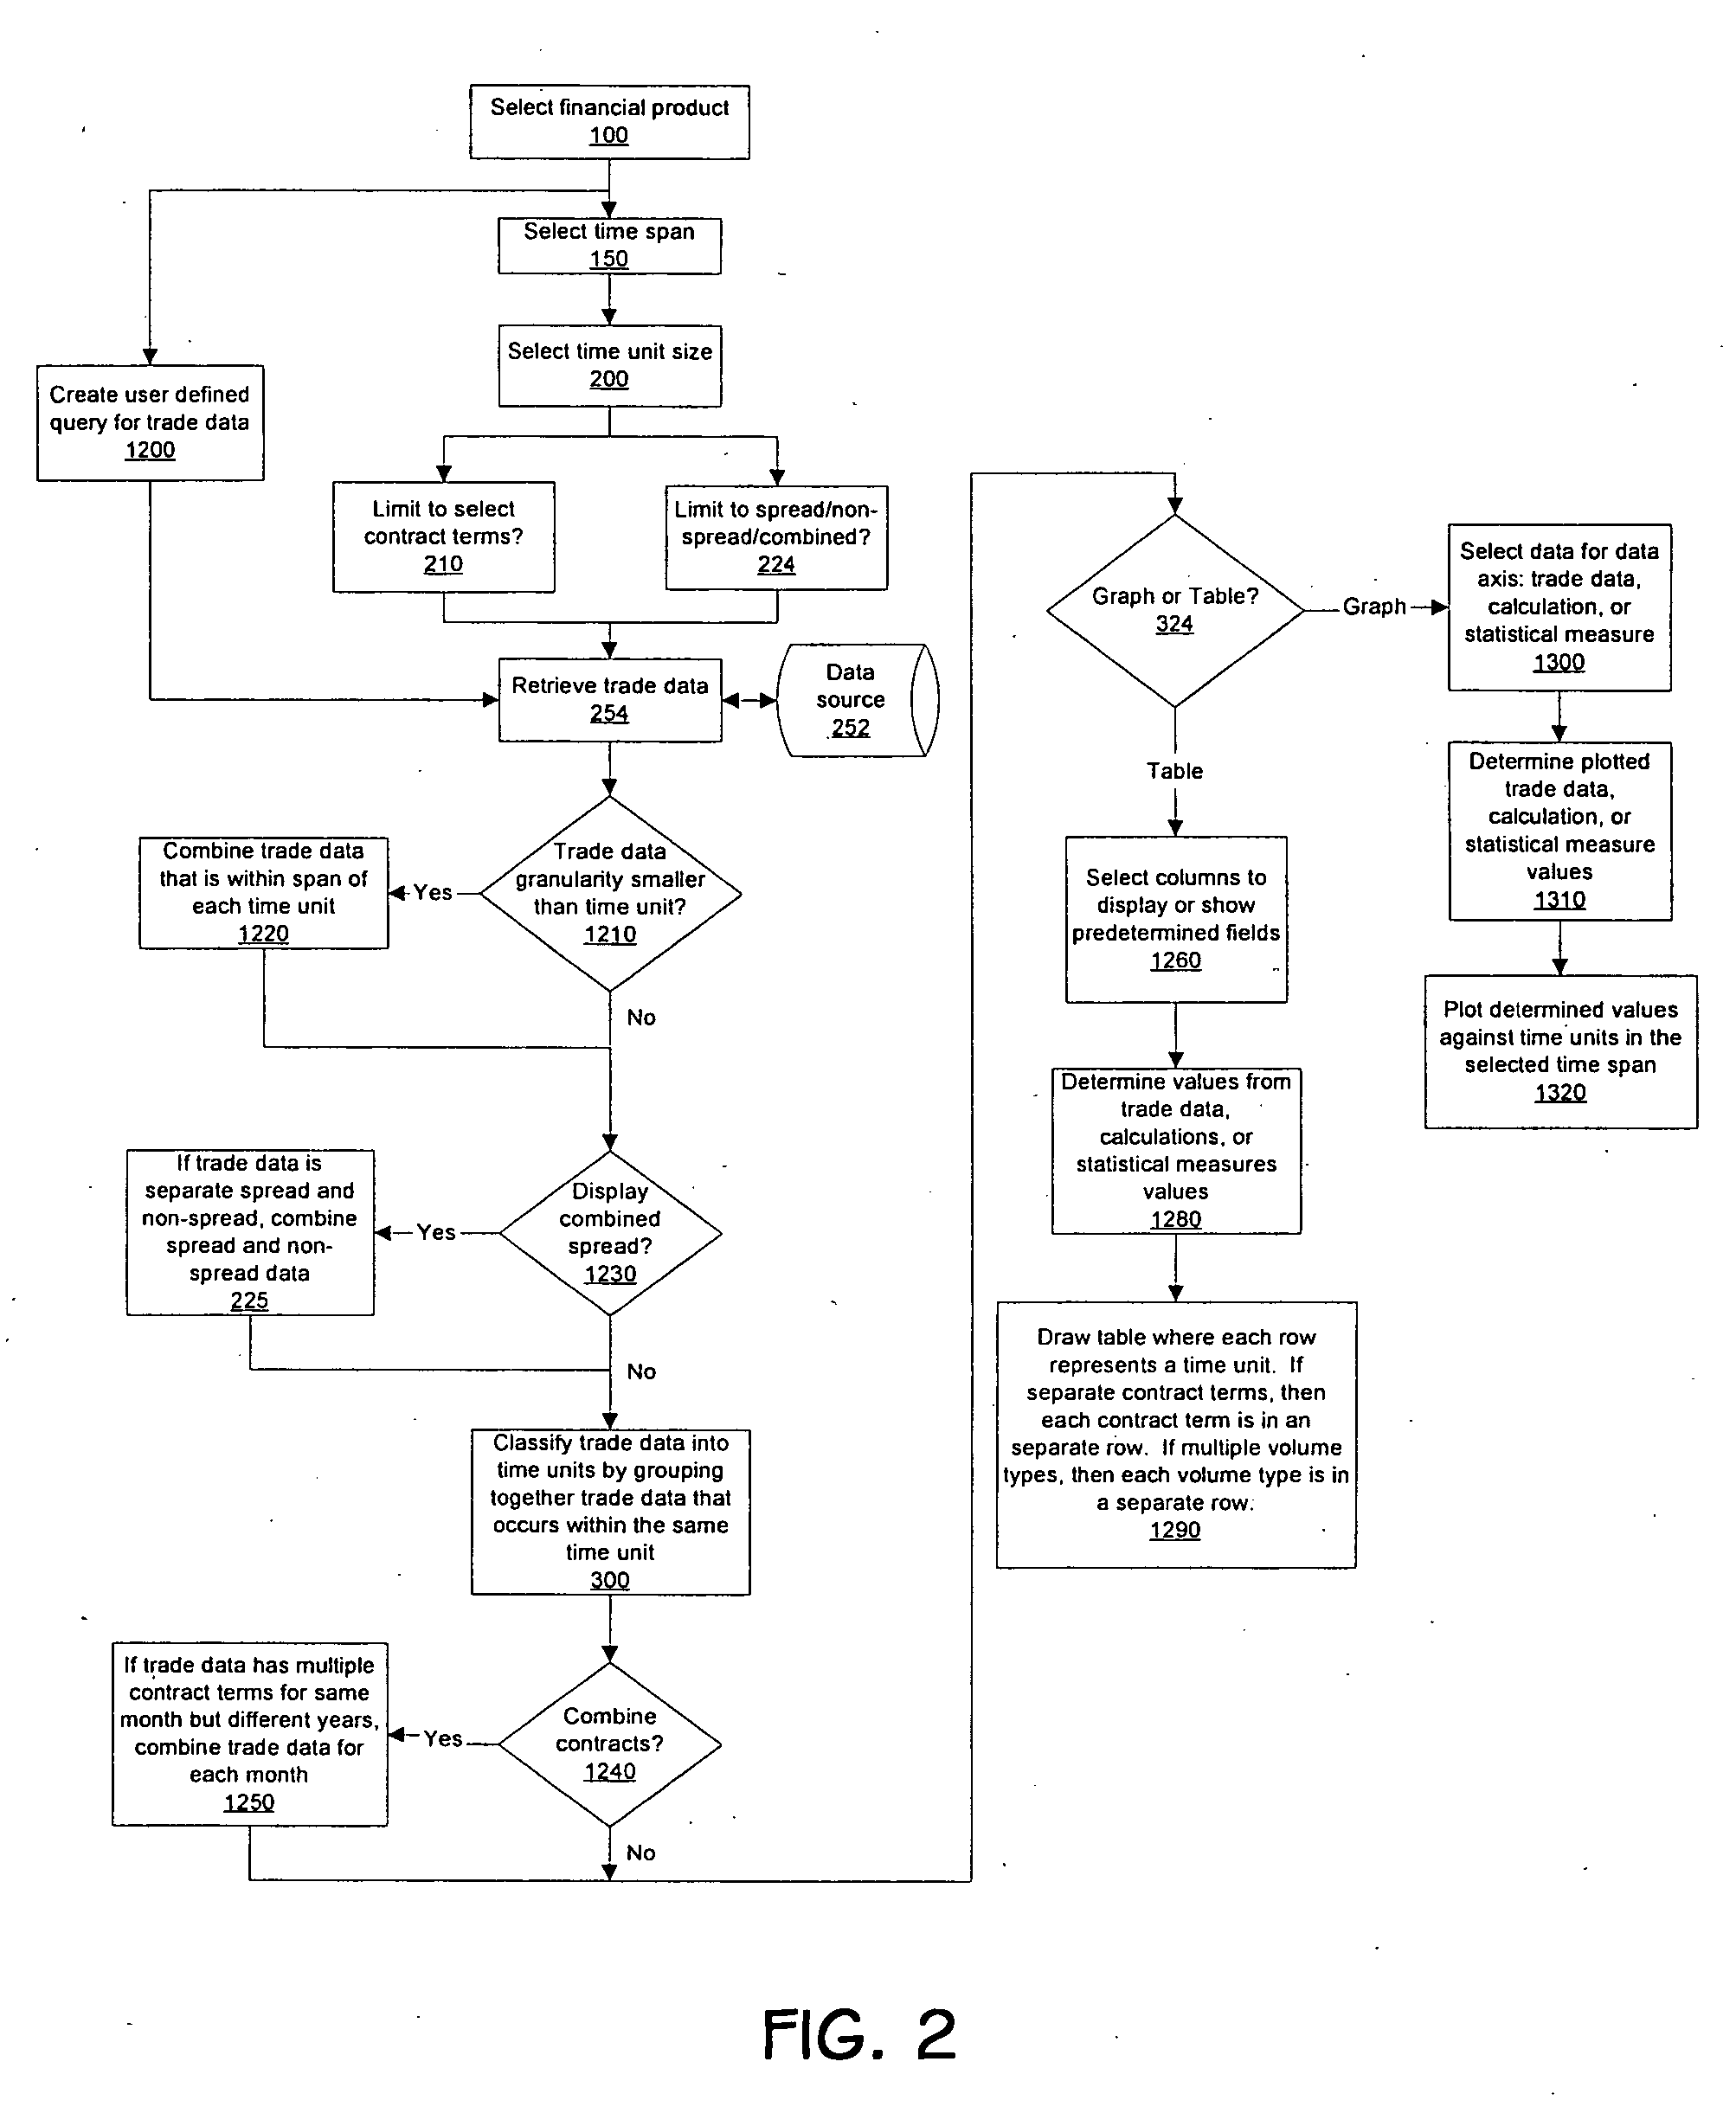
[0195] The figures and written description illustrate a process, method, and form by which a computer application may implement the invention. However, the execution order of the steps may be changed, and the method of user interaction and dis...


PUM


Abstract

A method for analyzing trade data for financial products comprising the steps of selecting at least one financial product from a plurality of financial products; selecting a first time span, wherein the first time span includes a plurality of time units; determining trade data for the first time span for the at least one financial product; displaying the trade data according to the plurality of time units; selecting at least one of the plurality of time units; determining a second time span, wherein the second time span includes at least the selected at least one time unit; determining prices and volumes for the at least one financial product for the second time span; classifying the prices according to a plurality of price zones; and displaying the plurality of price zones and corresponding volumes for the plurality of price zones.

Description

BACKGROUND OF THE INVENTION [0001] 1. Field of the Invention [0002] The present invention relates to information retrieval and analysis systems, and more particularly to systems designed for gathering, organizing, and analyzing trading information related to financial markets and financial products, and still more particularly for analyzing trade data related to the price and trade volume of commodities and over the counter financial products. [0003] 2. Description of the Related Art [0004] Financial institutions have made trade information available for financial products traded at or through those institutions. Examples of financial institutions and information services that may be provided can be found in Bloomberg's July 2003 listing of financial data services, which is incorporated herein by reference. [0005] Commodity and stock information analysis software typically permits one to retrieve historical trade information for a particular financial product, e.g., a stock, commodi...

Claims


Application Information

Patent Timeline
Patent Type & Authority Applications(United States)
IPC IPC(8): G06Q40/00
CPCG06Q40/06G06Q40/04
Inventor BRENNAN, DAVID P.WELDON, WILLIAM R.THORNE, MARK D.
Owner MDB ANALYTICS
Why Eureka
Try Eureka