Similar speaker recognition method and system using nonlinear analysis
- Summary
- Abstract
- Description
- Claims
- Application Information
AI Technical Summary
Benefits of technology
Problems solved by technology
Method used
Image
Examples
embodiment results
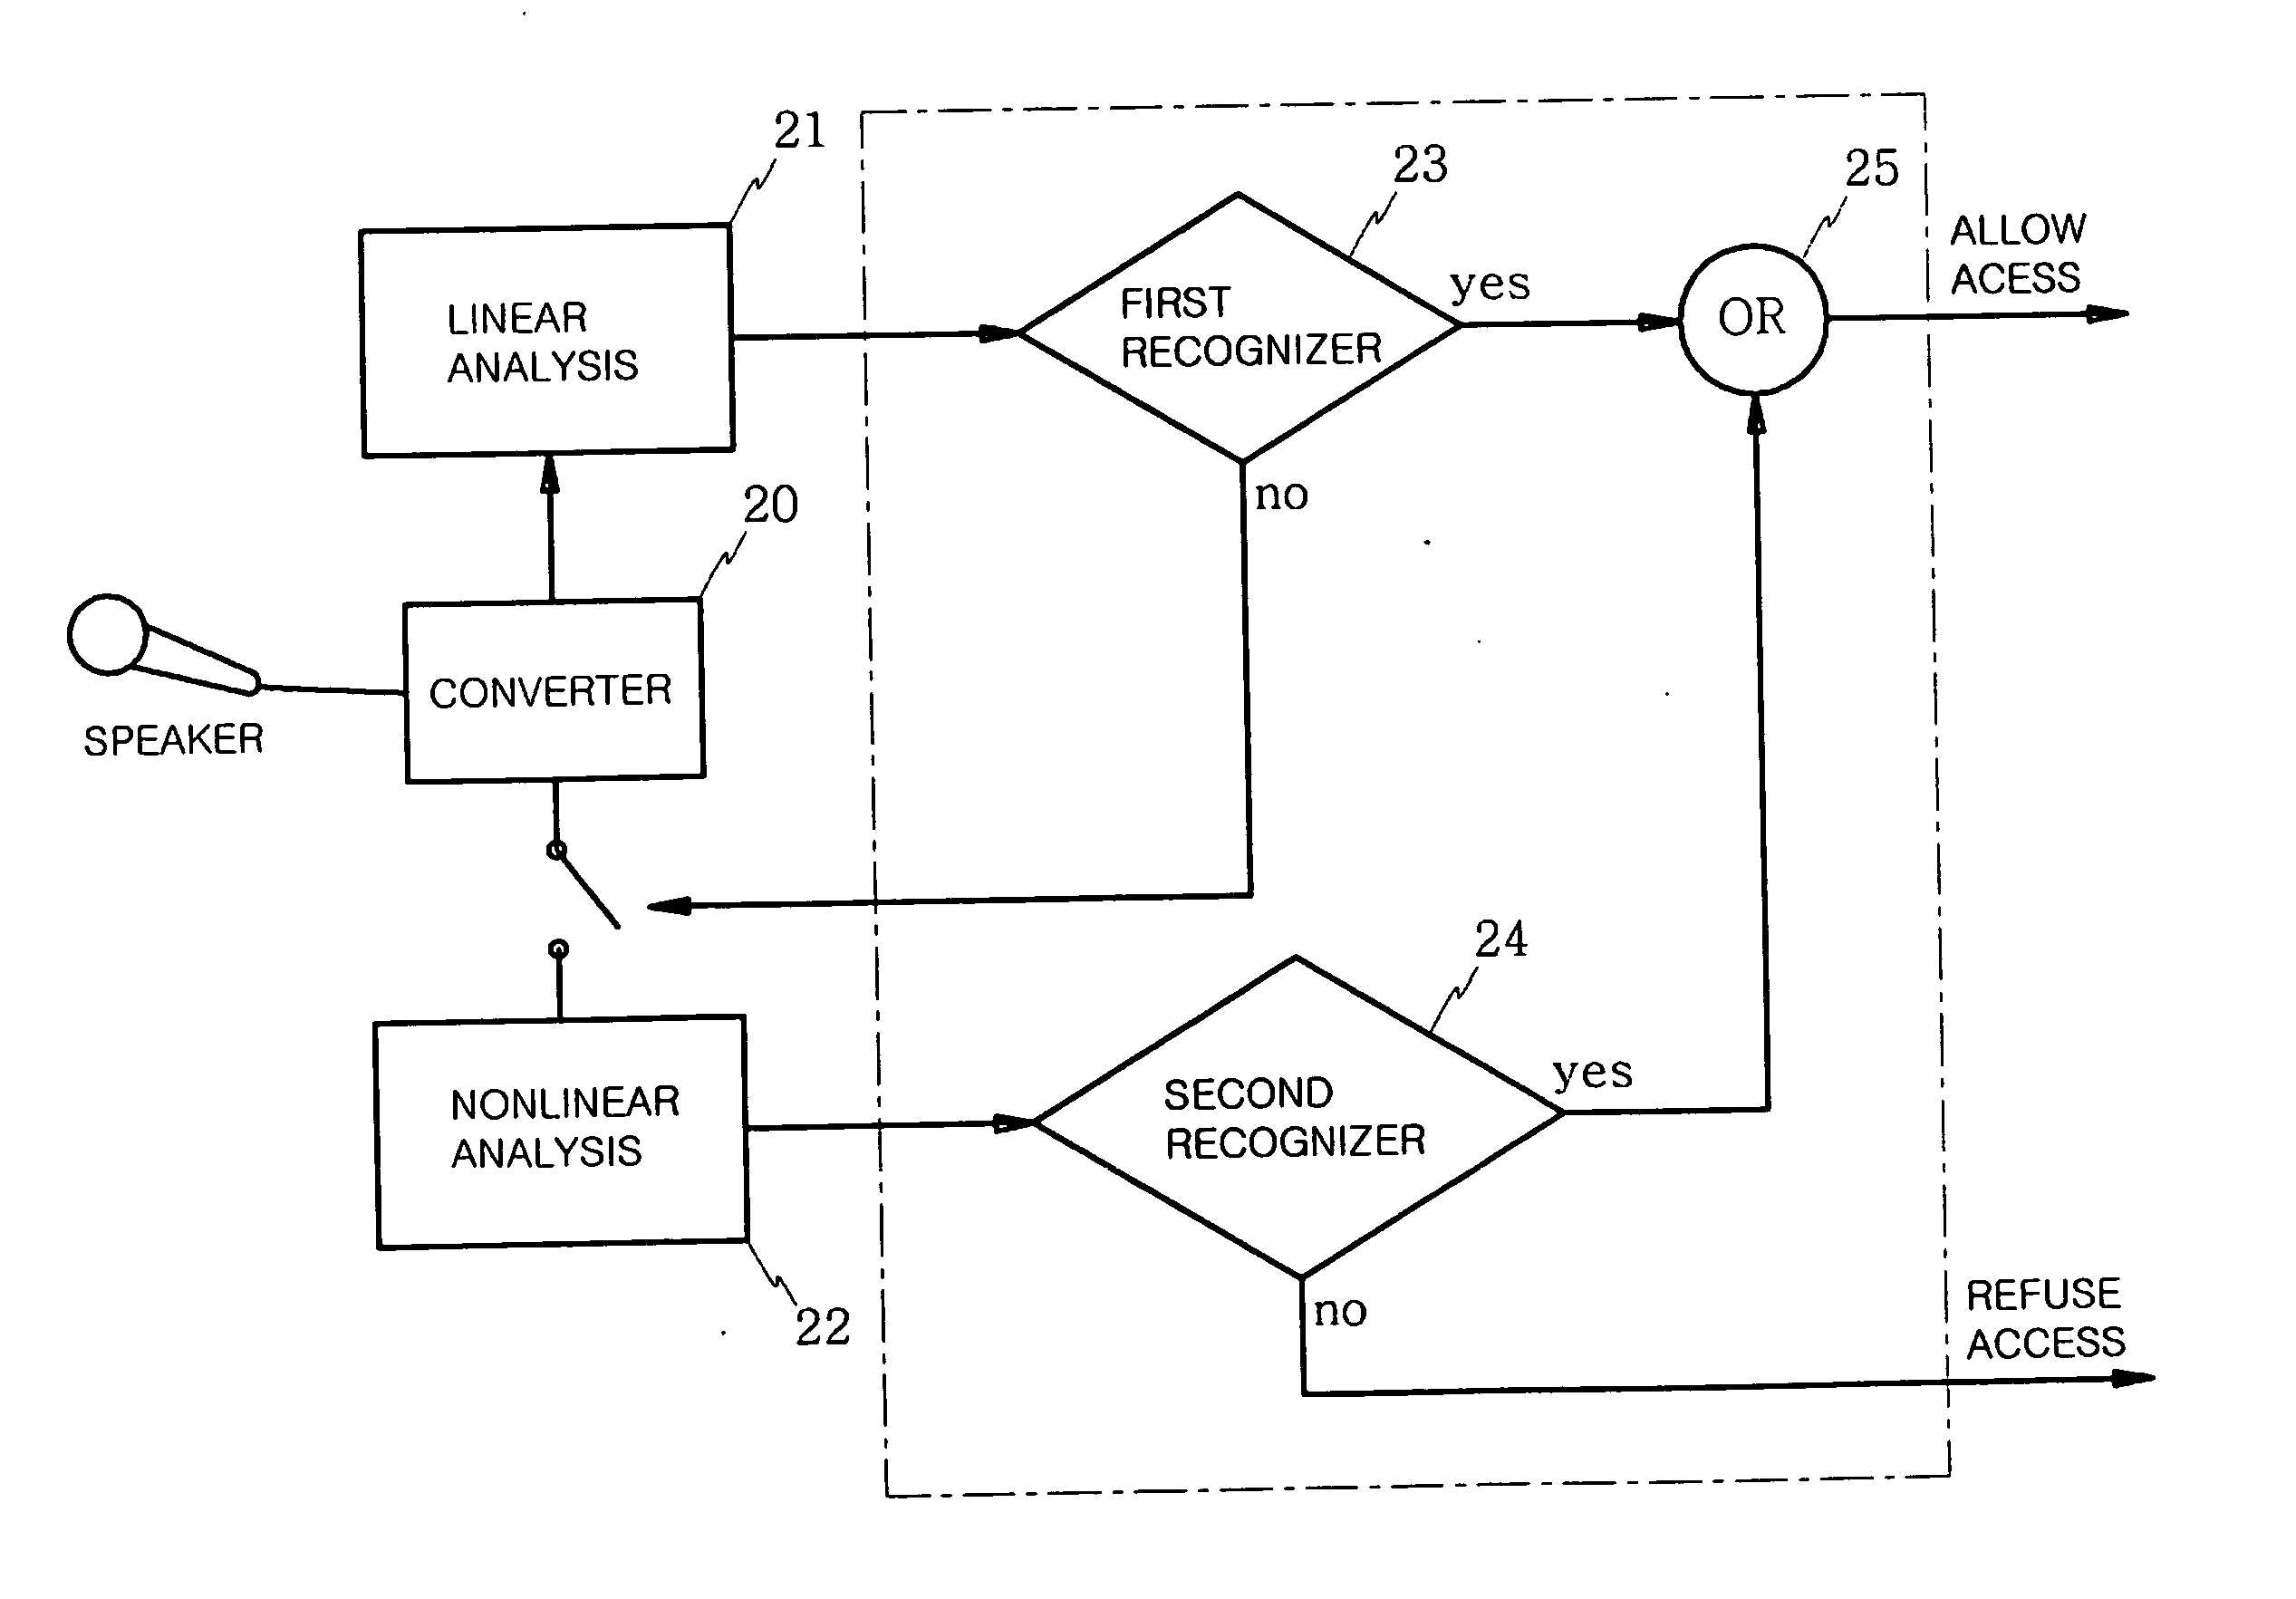
[0059]FIG. 7 is a graph showing recognition rates with respect to speakers having similar sounds. In FIG. 7, a graph (h) shows recognition rates when only the linear features of sounds are used, a graph (g) shows recognition rates when only the nonlinear features of the sounds are used, and a graph (i) shows recognition rates when a combination of the linear and nonlinear features is used. In FIG. 7, X-axis represents the speakers and Y-axis represents speaker recognition rates of the respective speakers.
[0060] It can be seen from FIG. 7 that an average recognition rate (graph (g) of FIG. 7) is less than 40% when the speakers are recognized using only the linear features of their sounds and all the recognition rates (graph (i) of FIG. 7) are increased higher than 60% when the speakers are recognized using the combination of the linear and nonlinear features of their sounds.
[0061] Furthermore, it can be seen that the recognition rates are approximately 0% when only the linear featu...
PUM
 Abstract
Description
Claims
Application Information
 - R&D
- Intellectual Property
- Life Sciences
- Materials
- Tech Scout
- Unparalleled Data Quality
- Higher Quality Content
- 60% Fewer Hallucinations
Browse by: Latest US Patents, China's latest patents, Technical Efficacy Thesaurus, Application Domain, Technology Topic, Popular Technical Reports.
© 2025 PatSnap. All rights reserved.Legal|Privacy policy|Modern Slavery Act Transparency Statement|Sitemap|About US| Contact US: help@patsnap.com


