Method to determine price inflections of securities

a technology of securities and price fluctuations, applied in the field of methods for analysing securities information, can solve the problems of increasing volatility, increasing change and thus volatility, and not relating the size, and achieve good comparison

Inactive Publication Date: 2006-06-01
WILLAIN PASCAL
View PDF20 Cites 46 Cited by
  • Summary
  • Abstract
  • Description
  • Claims
  • Application Information

AI Technical Summary

Benefits of technology

[0010] To be used, the claimed method preferably is applied to historical data that must be available at regular time intervals (TI) (1 minute, 5 minutes, etc.), values of which include Date, Time, Open, High, Low, Close, Volume. Working on aggregate one minute data allows aggregation of all the small transactions that took place during one minute, enabling the comparison of consecutive price / volume changes at one-minute time intervals. It is preferable to leaving the time interval as a constant value because doing so allows a good comparison between large and small volume sizes.

Problems solved by technology

However, the use of trend technical-analysis tools based on minute-by-minute data changes increases volatility.
Indeed, these tools induce market players to react together to changes in trends, generally increasing the change and thus volatility.
Such method is weak, because it does not take the price inflections into consideration or the difference in behaviour depending on the size of the volume involved at each time interval.
One problem of this method is that it does not relate the size of the bid / ask proportion to price inflections.
Therefore, it is not possible to see manipulation from large players for example when small sales are made at the bid to push the price down, while some large buys are made at the ask with as a consequence to push the prices up.
Another important problem of that method is that it is based on real transaction and order data, which are not readily available to retail investor on a free basis.

Method used


Image

  • Method to determine price inflections of securities
  • Method to determine price inflections of securities
  • Method to determine price inflections of securities

Examples


Embodiment Construction

[0022] In order to properly understand the disclosure of the claimed invention, the inventor has described certain terms herein in the following paragraph. While the inventor describes the following terms, the inventor in no way intends to disclaim the ordinary and accustomed meanings of the terms.

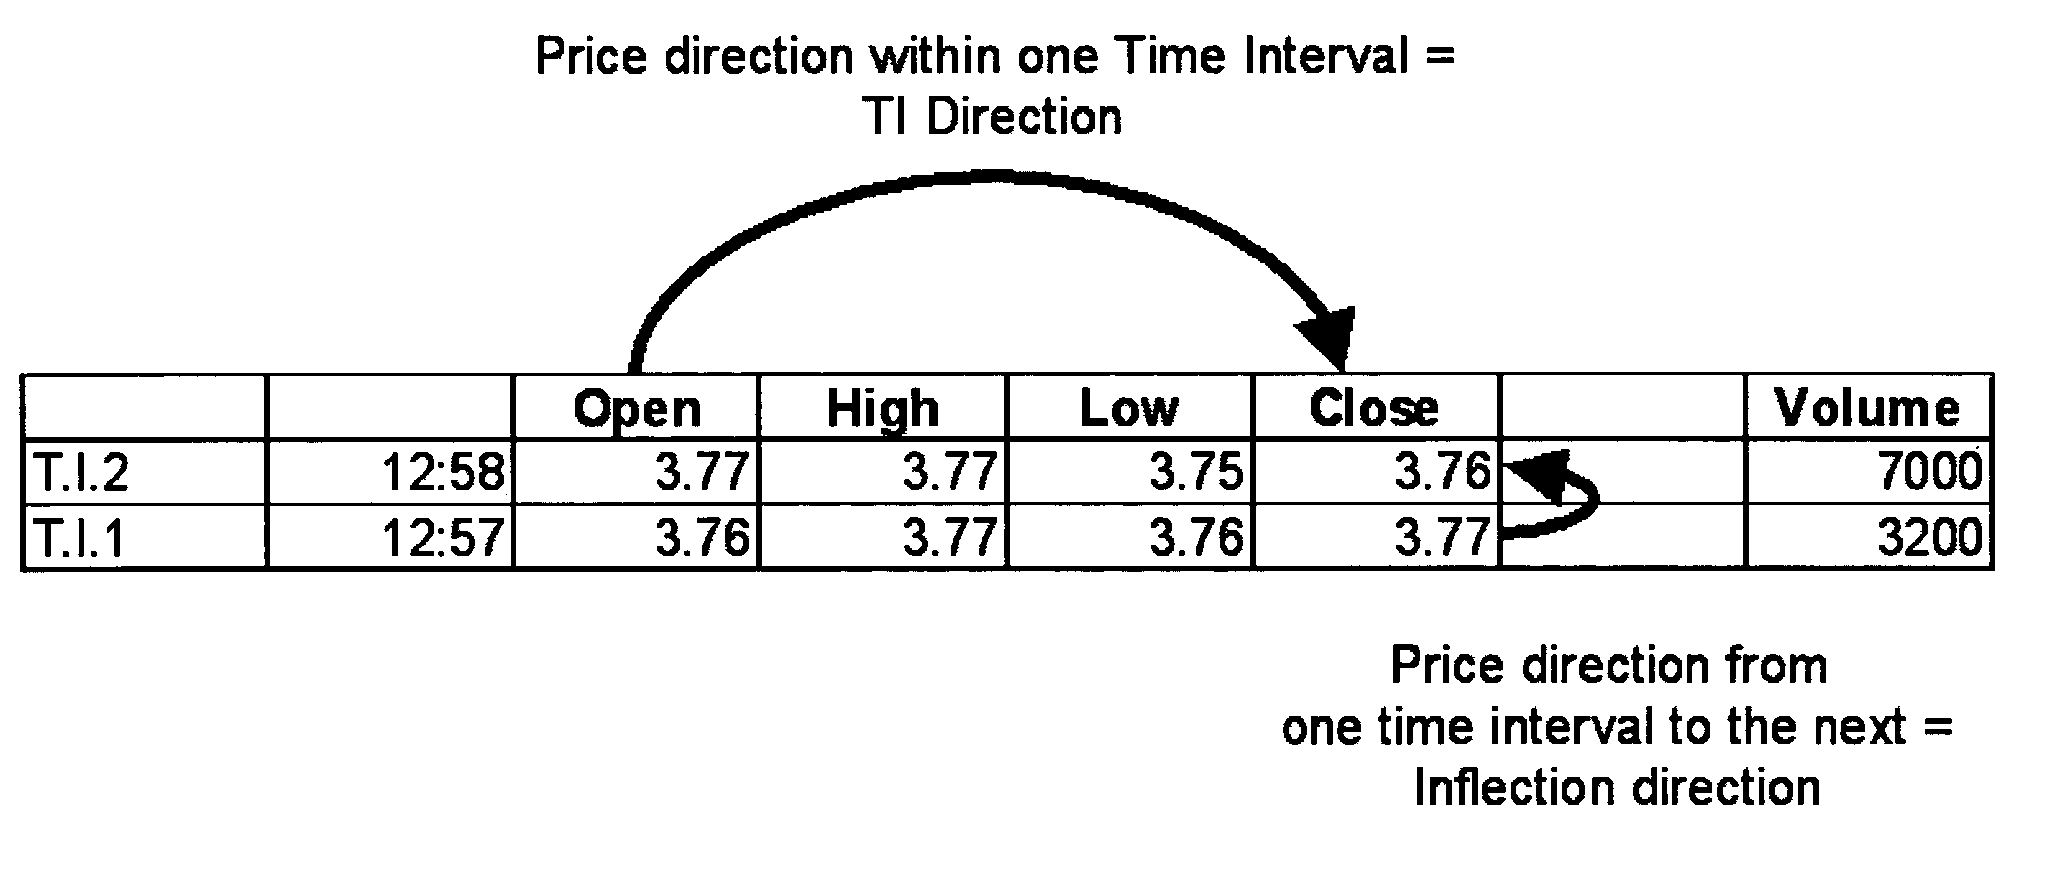
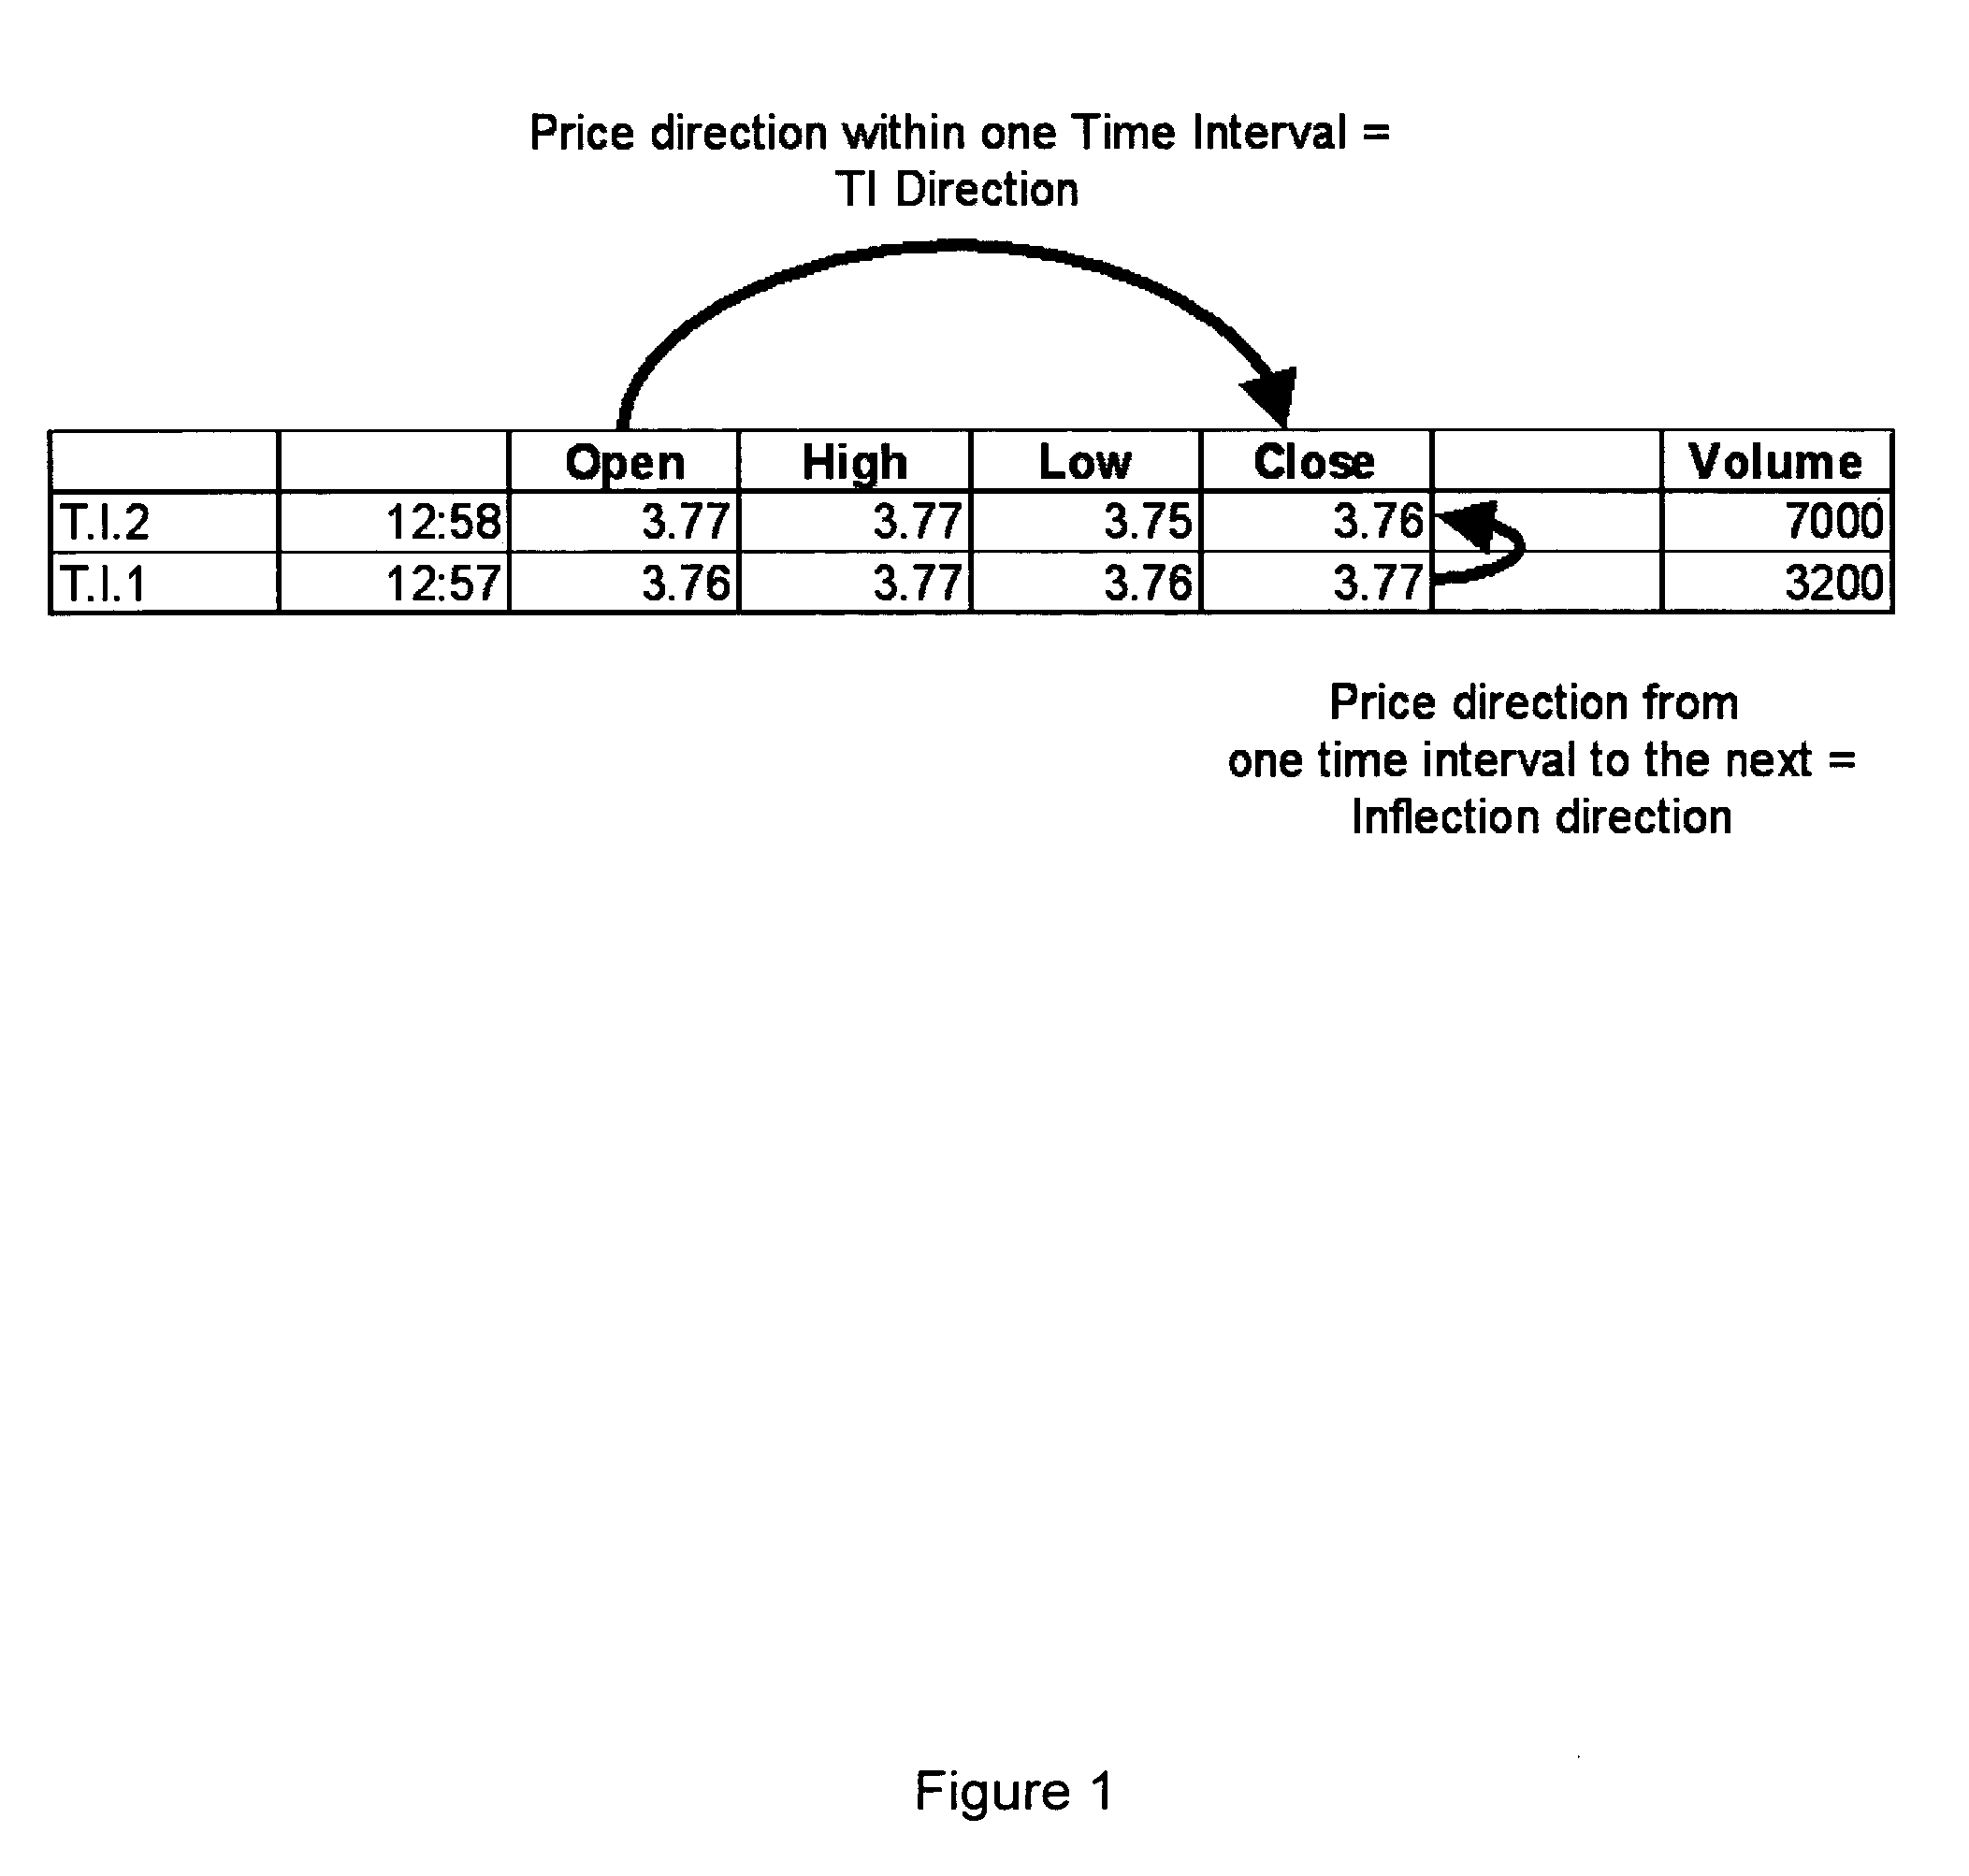
[0023] Time Interval (“TI”) is defined as the smallest time interval that is used in the claim method. Preferably, TI is one minute. Trading Session (“TS”) is defined as a period of time during which trading of a specific stock is not halted or interrupted. Preferably, a trading session is a trading day. Price Interval (“PI”) is defined as the lowest possible stock price change (increase or decrease) that can be monitored from one time interval to the next, during a specific trading session. Preferably, PI is set at US$ 0.01. The Analysis Period (“AP”) is defined as one or more concomitant trading sessions. An Inflection Point (“IP”) related to the price of a security is a small closing p...


PUM


Abstract

The present invention provides a method to detect buying or selling activities of large market players of a given equity, compared to the activity of smaller players. For a set of consecutive trading sessions, the method analyses only trading data (open/high/low/close/volume) aggregated into regular intervals such as one-minute, two-minutes or five-minute trading data. The method considers only time intervals corresponding to price inflections, i.e. for which the closing price was different from the previous time interval. The method further analyses the volume of said time intervals and calculates the effective volume that was responsible for a price inflection. The method then separates the effective trading volumes related to the said time interval into large and small size volumes and plots the evolution of the said volume sizes on a graph. Analysis of trend divergence between large and small size volume flow trends allows detection of the said buying and selling activity by large or small market players.

Description

CLAIM OF PRIORITY [0001] This invention claims the benefit of U.S. Provisional Application No. 60 / 631,948 filed on Nov. 30, 2004.FIELD OF THE INVENTION [0002] This invention relates to methods for analysing securities information, and in particular, to such methods involving the monitoring of stocks on the Internet. BACKGROUND OF THE INVENTION [0003] The dissemination of information through the Internet has made stock trading accessible to any retail investor at low cost. The number of market players who can respond on-line is growing, which results in a better equilibrium between the bid and the ask. However, the use of trend technical-analysis tools based on minute-by-minute data changes increases volatility. Indeed, these tools induce market players to react together to changes in trends, generally increasing the change and thus volatility. A given equity will therefore move between stability and instability. Therefore, there is a need for, and thus the present invention provides...

Claims


Application Information

Patent Timeline
Patent Type & Authority Applications(United States)
IPC IPC(8): G06Q40/00
CPCG06Q40/00G06Q40/04
Inventor WILLAIN, PASCAL
Owner WILLAIN PASCAL
Why Eureka
Try Eureka