Portfolio management system with gradient display features

a management system and feature technology, applied in the field of portfolio management system with gradient display feature, can solve problems such as insignificant changes

Inactive Publication Date: 2007-08-30
GUY CARPENTER
View PDF48 Cites 35 Cited by
  • Summary
  • Abstract
  • Description
  • Claims
  • Application Information

AI Technical Summary

Benefits of technology

[0021]The insurers must be aware that the results of this sensitivity analysis are only valid if the portfolio changes according to the recommended geographic strategies by a small percentage only. Drastic changes to the portfolio exposures can completely change the composition of the RML, and, therefore, may not be a good approximation anymore. The new portfolio would need to be re-analyzed with adjusted RML events.
[0022]In an embodiment, the invention provides a tool that includes a grid level database and a spatial database that develops maps identifying preferential places for insurance growth and loss prevention and also creates a zip code index comparing the attractiveness of writing business in one zip code versus another. The system creates an incremental portfolio that consists of the same-value and same-construction exposures located in the nodes, or pixilated points, of an equally-spaced grid. This portfolio is modeled in a catastrophe model to obtain losses to each location in the grid from each stochastic catastrophe event. For specific events from a insurer's portfolio that fall into the RML, the spatial impact of a the incremental portfolio to the insurer's RML losses can be evaluated using the pre-modeled event losses of the incremental portfolio. By determining tail loss contribution, the spatial pattern will be unique to each particular insurer based on the individual insurer's portfolio, which drives the losses in the RML. Approximation of the changes to losses in the RML occurs because adding incremental exposure may change the composition of events in the RML. But such change is insignificant if the incremental exposure is small compared to the insurer's original portfolio.

Problems solved by technology

Approximation of the changes to losses in the RML occurs because adding incremental exposure may change the composition of events in the RML.
But such change is insignificant if the incremental exposure is small compared to the insurer's original portfolio.

Method used


Image

  • Portfolio management system with gradient display features
  • Portfolio management system with gradient display features
  • Portfolio management system with gradient display features

Examples


Embodiment Construction

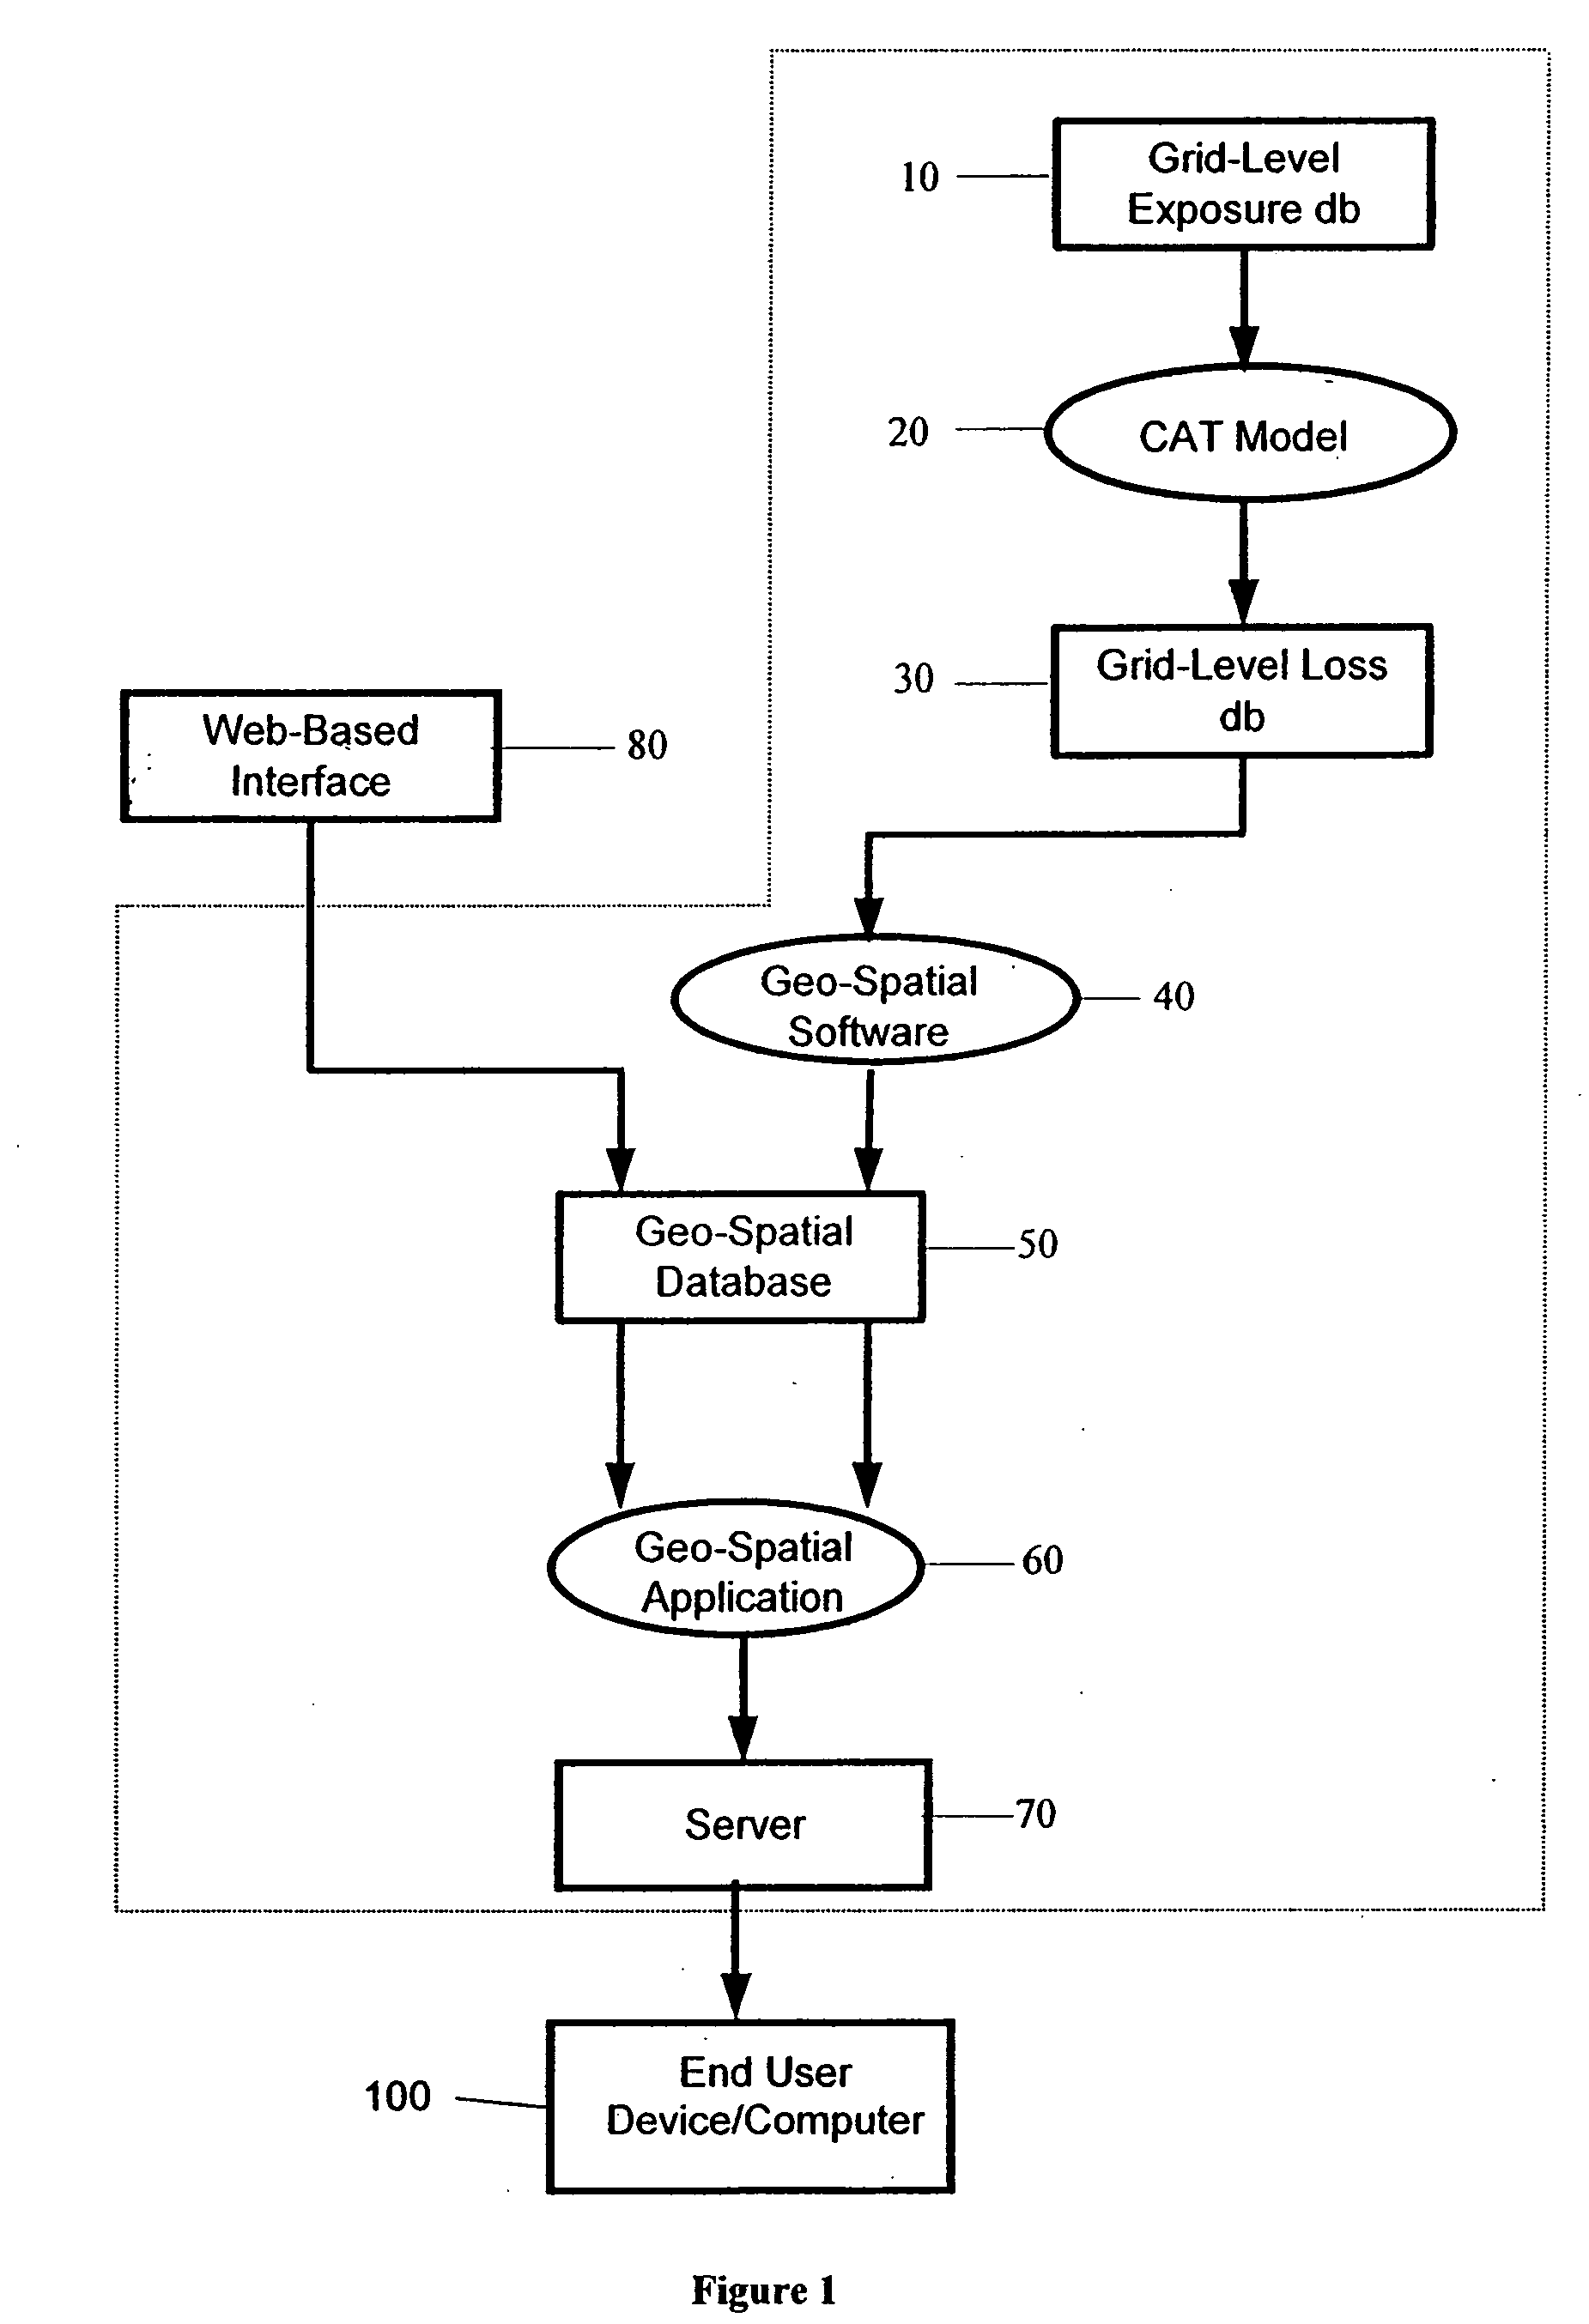
[0038]The present invention provides maps and zip code lists of RML losses that are available for catastrophic events, such as for earthquakes and hurricanes. Technology / tools used may include a processor having a computer readable signal-bearing medium, such medium having circuits, such as hardware including a spatial database (e.g., an Oracle Spatial Database), and geo-spatial software, such as PCI Geomatica, and a geo-spatial application, such as EASI script. The system includes an end user device, such as a computer, personal digital assistant (PDA), cell phone or other electronic device, which can send and receive signals via the internet, including emails and other data files that include RML losses depicted with gradient features.

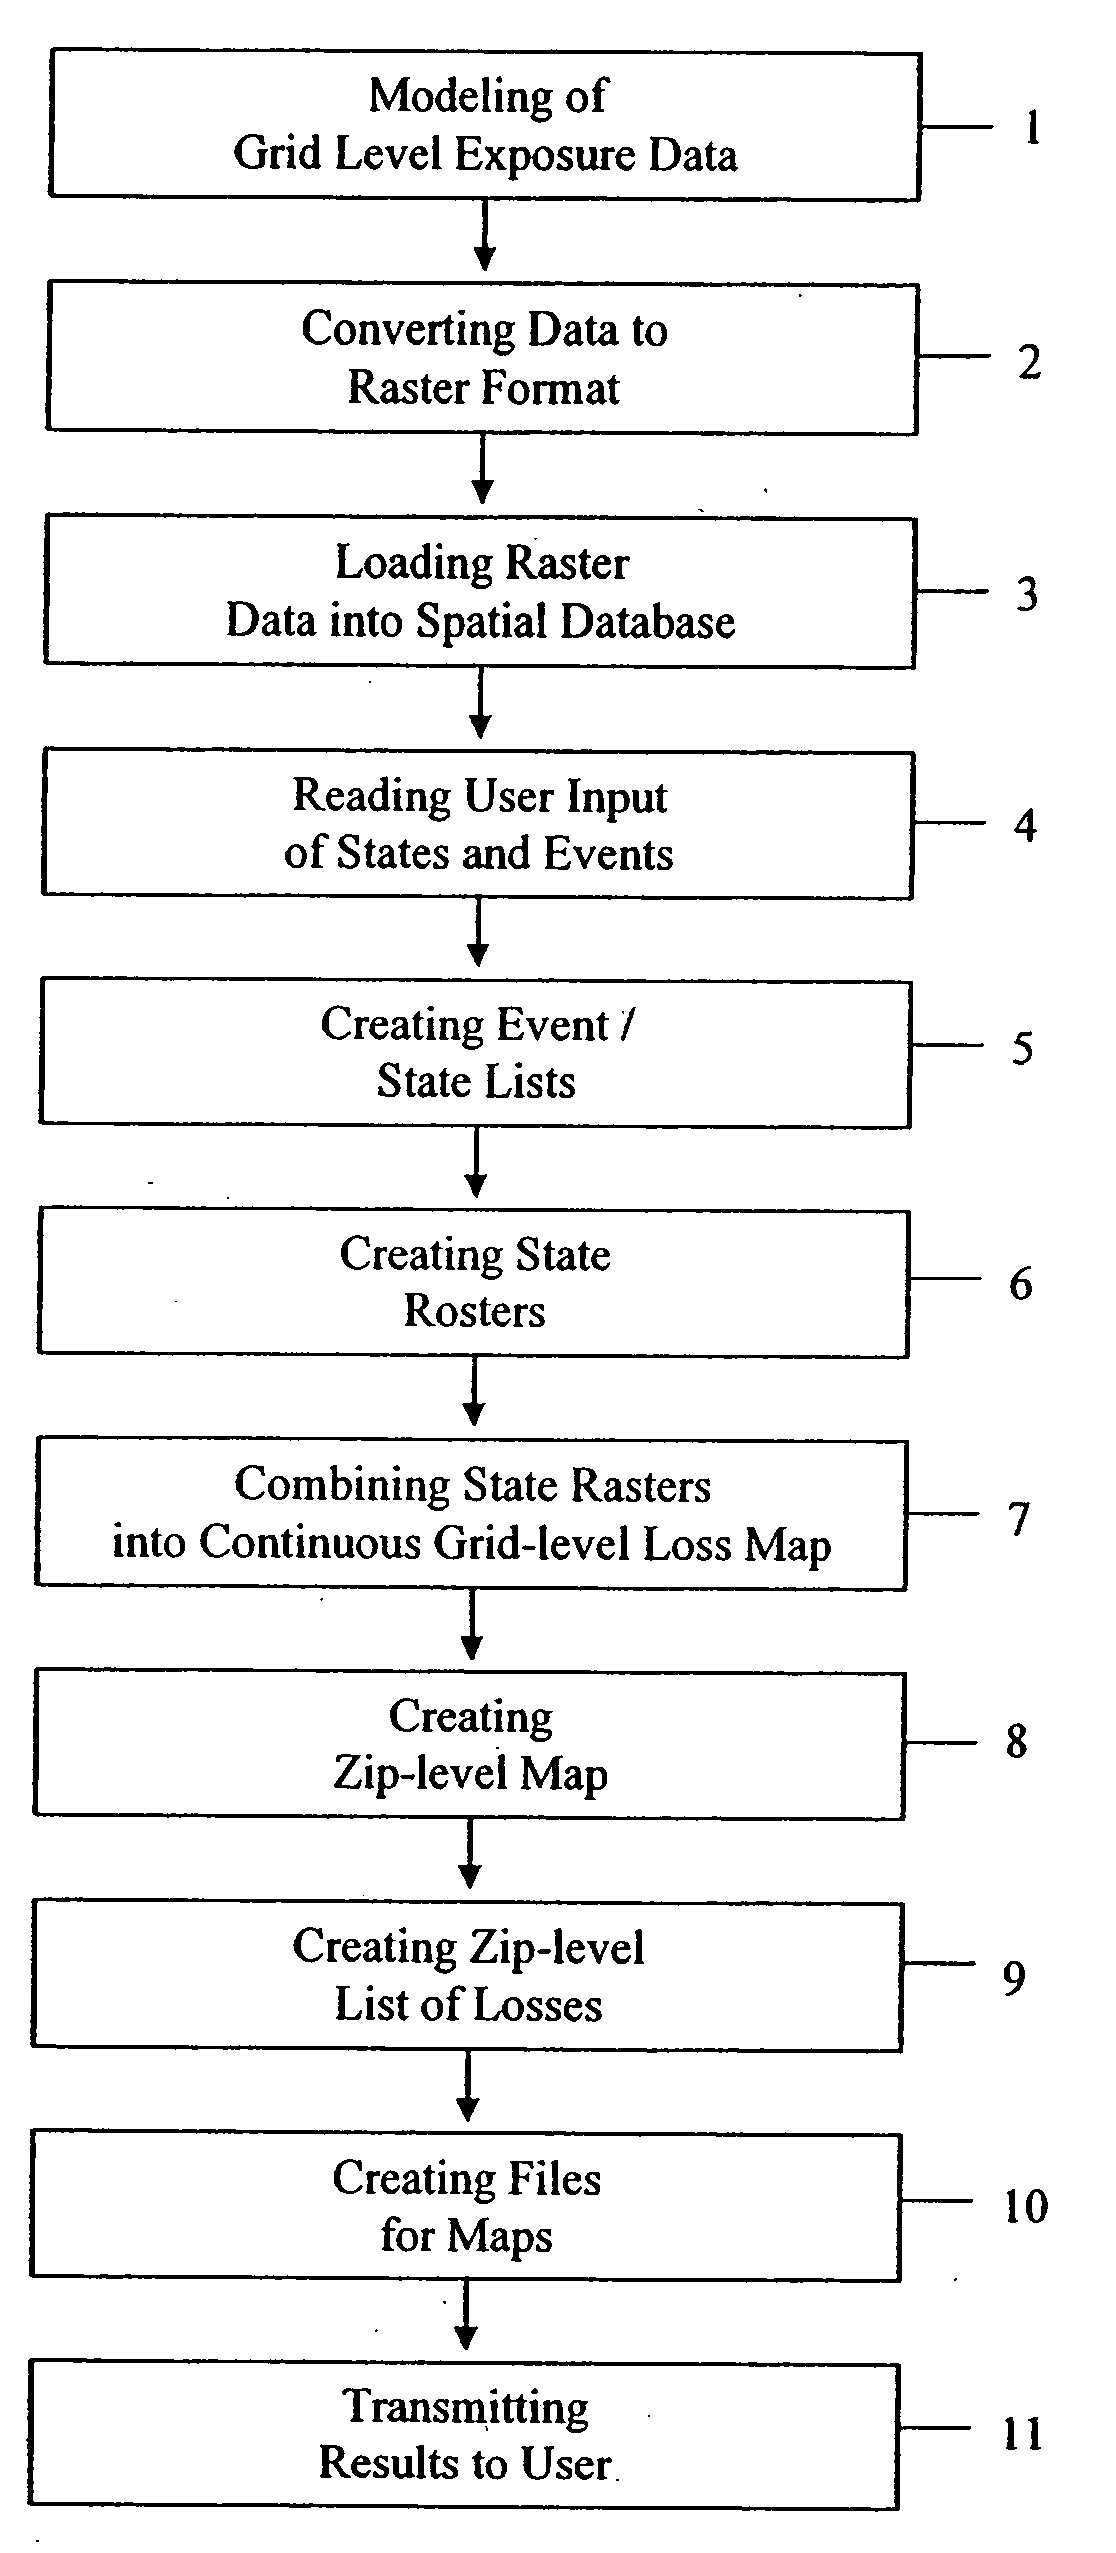
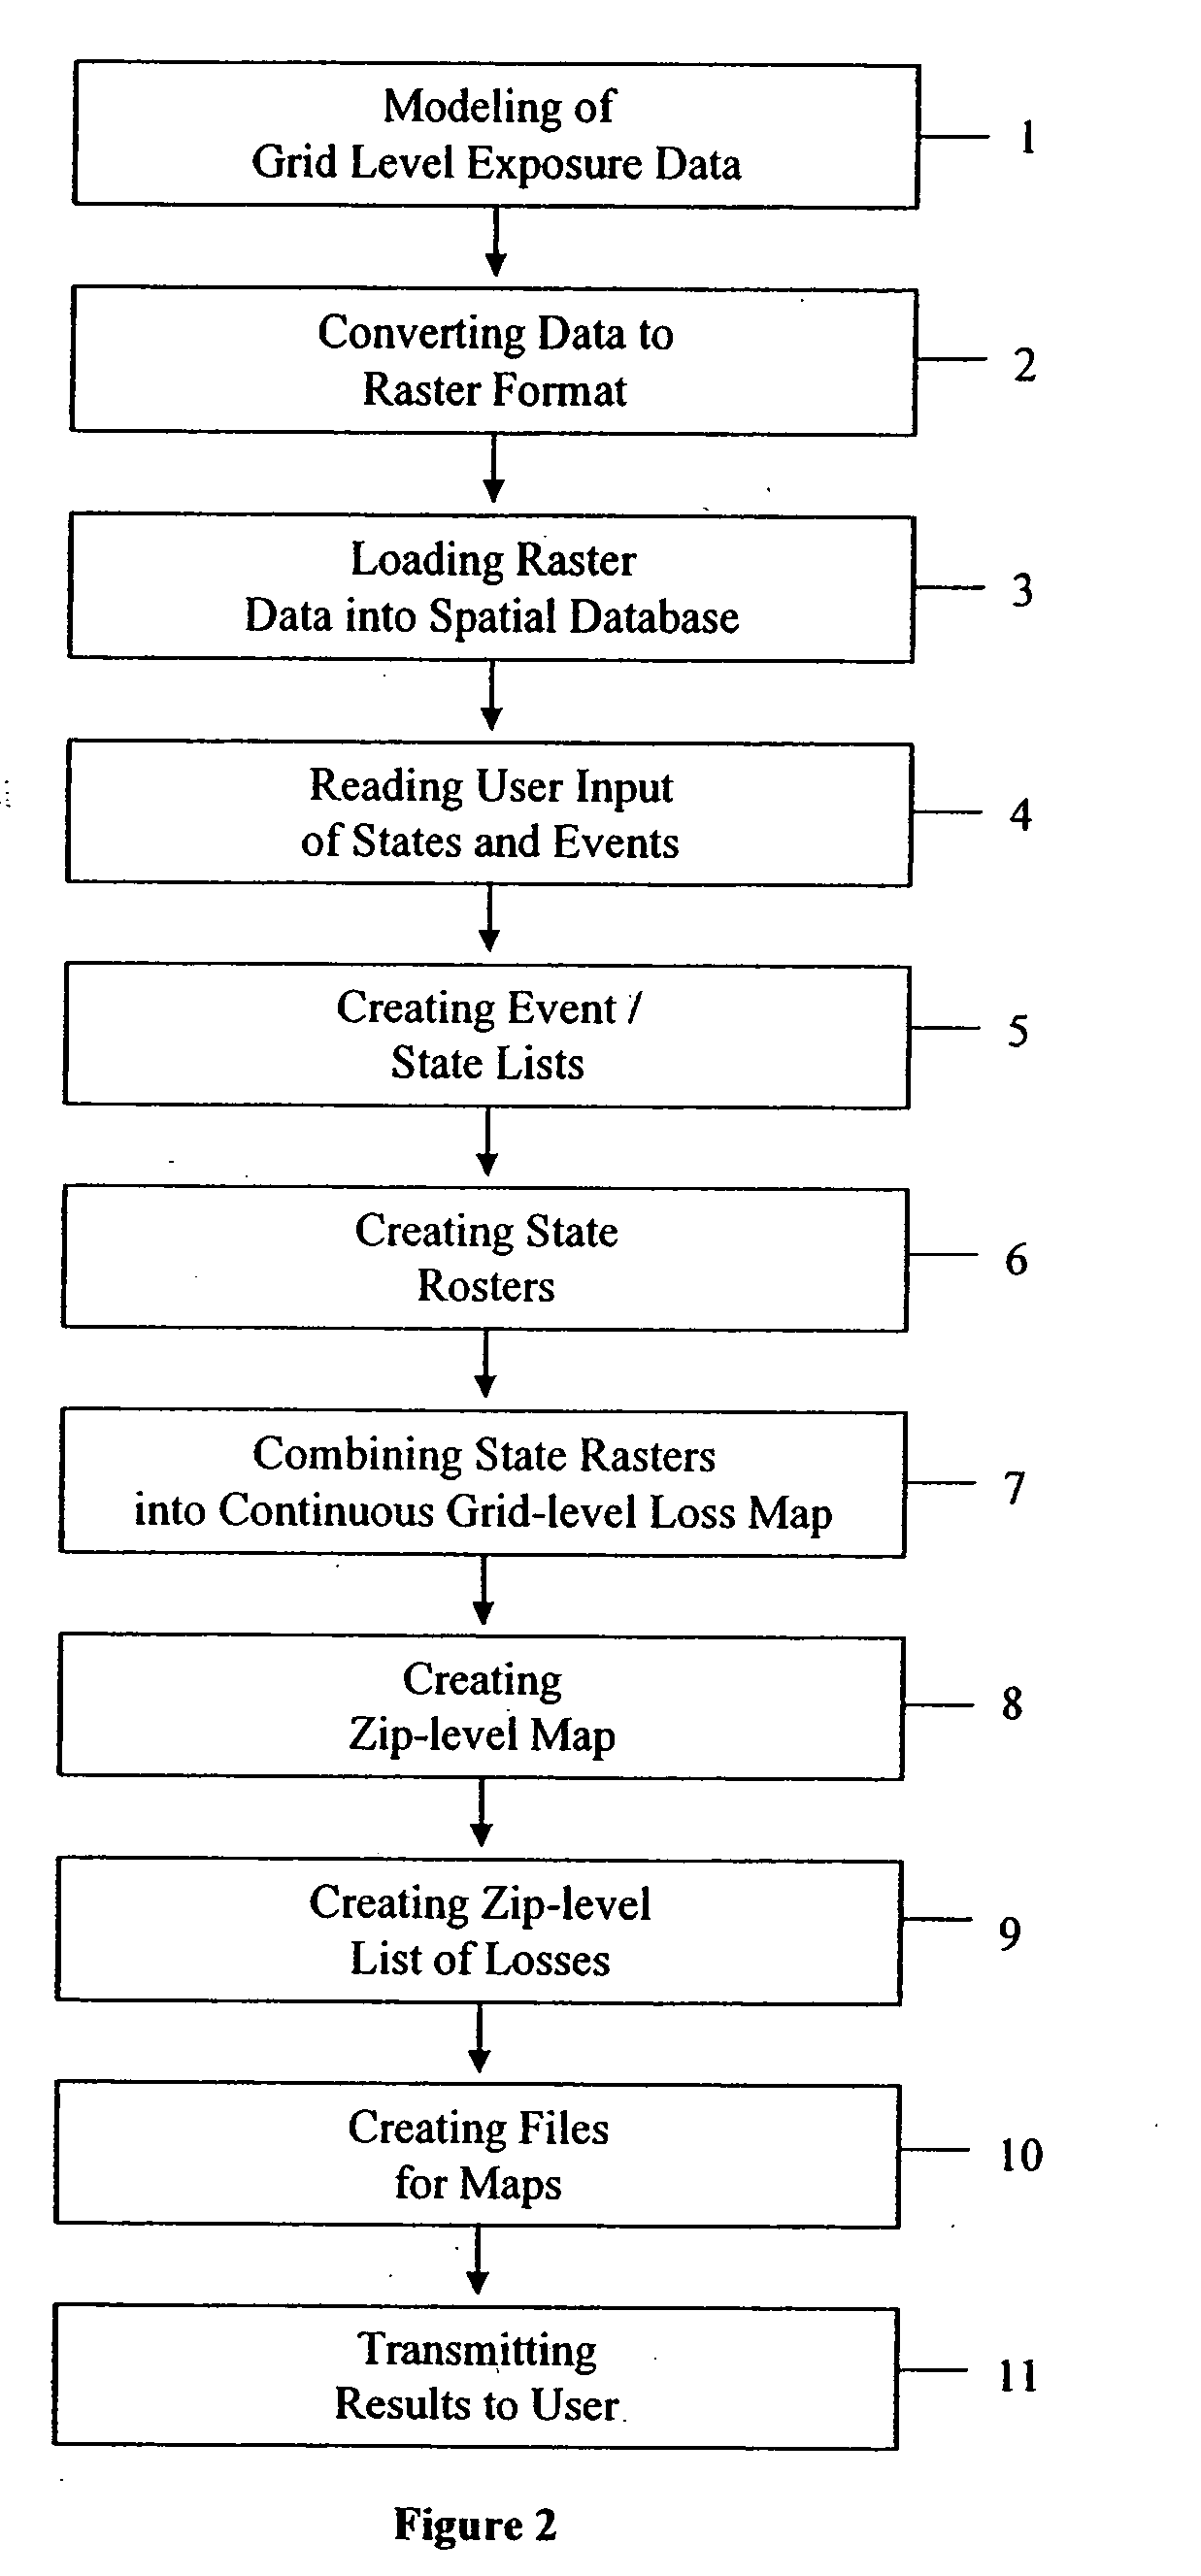
[0039]The major steps of an embodiment of the present invention are depicted in FIG. 1 and FIG. 2. Step 1 involves modeling of grid-level exposure data from the grid-level exposure database 10 and to obtain grid-level loss by event from the grid-leve...


PUM


Abstract

The present invention provides a tool to depict the relative impact to the losses of a insurer's portfolio from catastrophic events, such as a hurricanes or earthquakes, at a specific risk level by geographic area using a grid level database and a spatial database to generate maps. The maps developed using this tool help visualize the potentially dangerous areas for writing new business and/or identify preferential places for growth. The tool also creates a list of zip codes with incremental losses at a particular risk level representing the relative attractiveness of writing new policies (or eliminating existing policies) in one zip code versus another. The spatial database provides rich spatial geometry features in the form of raster images available in the spatial database and the invention provides the corresponding spatial algebra to create relativity maps with gradient features and zip code loss information.

Description

[0001]The present application claims its priority date from co-pending provisional patent application Ser. No. 60 / 776,987 filed Feb. 27, 2006.BACKGROUND[0002]The present application pertains to a portfolio management system and method for managing data and portfolios and displaying loss data on maps using gradient features generated and stored by a grid-level database and a spatial database.[0003]Currently, more and more insurance companies are taking a pro-active approach to portfolio management and, instead of just assessing potential losses of the current portfolio of insurance policies, they are trying to evaluate the geographic impact of writing new policies based on their portfolio's performance. Typically, there is a certain layer of risk that is the most critical for managing called a Risk Managed Layer (RML). The selection of a RML can be affected by a variety of factors and parameters, such as a reinsurance layer's attachment and limit, A.M. Best's rating requirements, etc...

Claims


Application Information

Patent Timeline
Patent Type & Authority Applications(United States)
IPC IPC(8): G06Q40/00
CPCG06Q40/08G06Q30/02
Inventor MATHAI, SHAJYBELUBEKIAN, MAYA E.SOH, ELIZABETH
Owner GUY CARPENTER
Why Eureka
Try Eureka