
Charting with depth of market volume flow

a flow chart and market technology, applied in the field of information, can solve problems such as general limitations in their indication of current and likely future trends

Inactive Publication Date: 2008-04-10
CQGT
View PDF30 Cites 60 Cited by
  • Summary
  • Abstract
  • Description
  • Claims
  • Application Information

AI Technical Summary

Benefits of technology

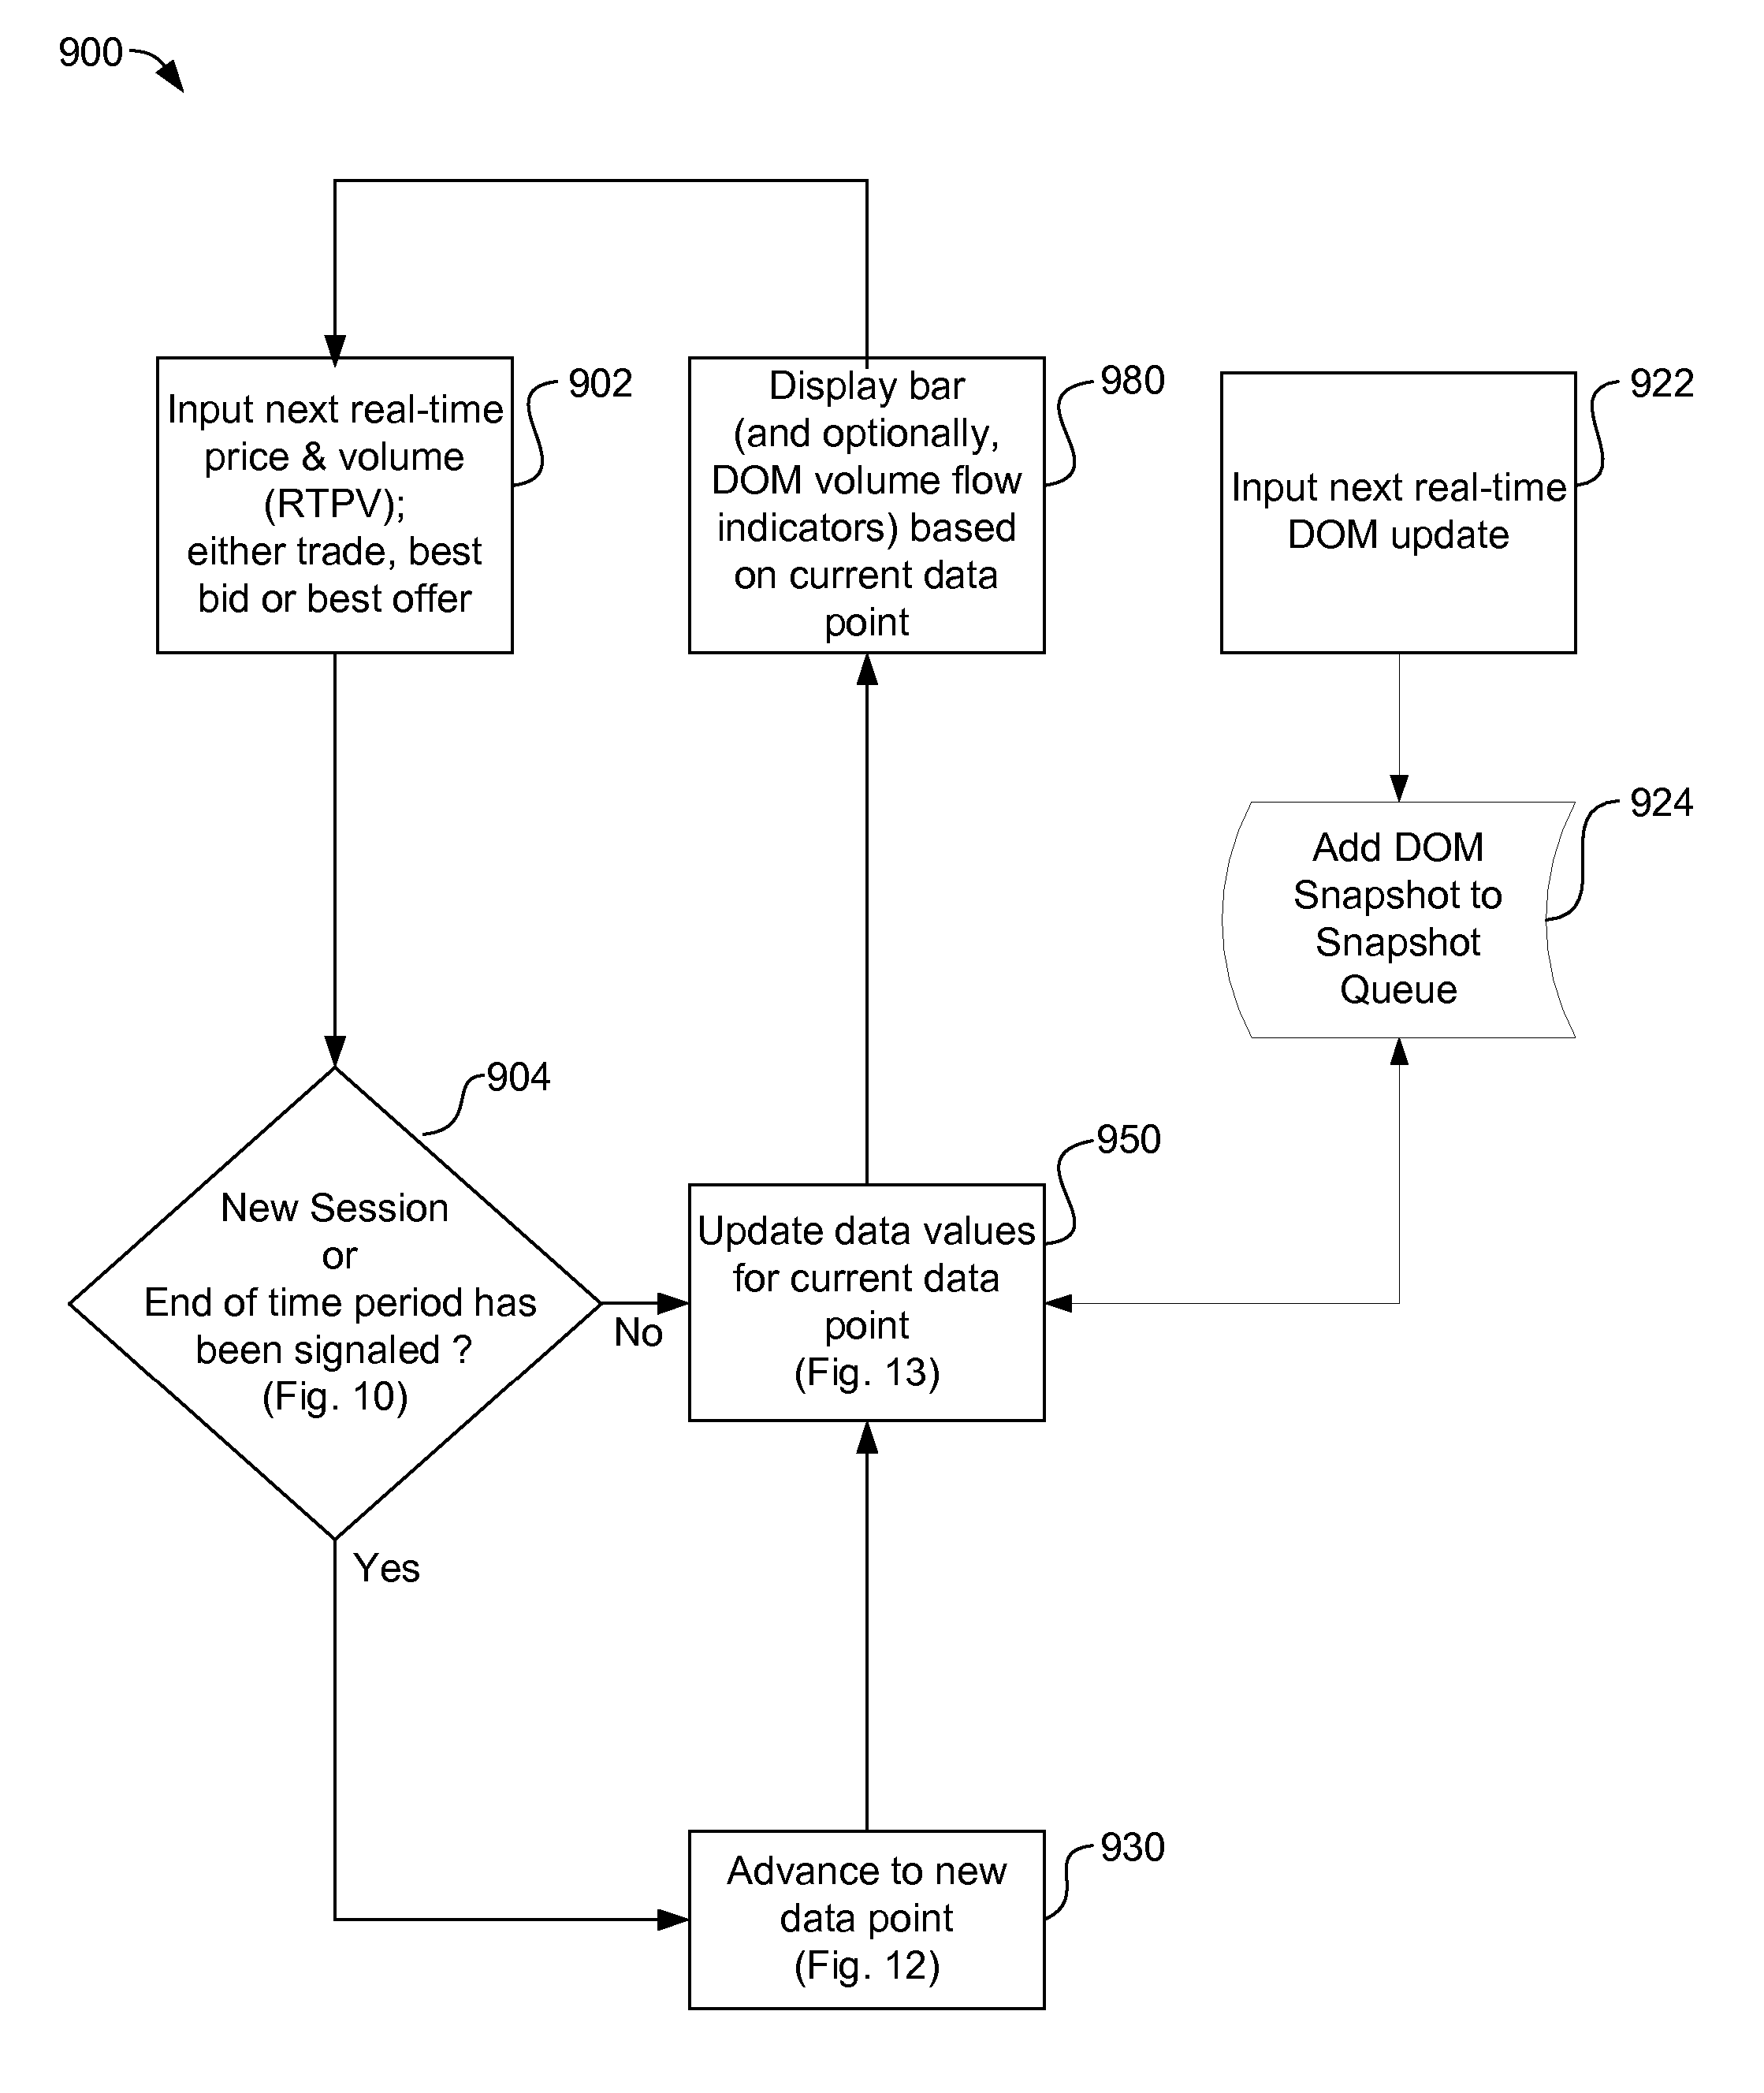
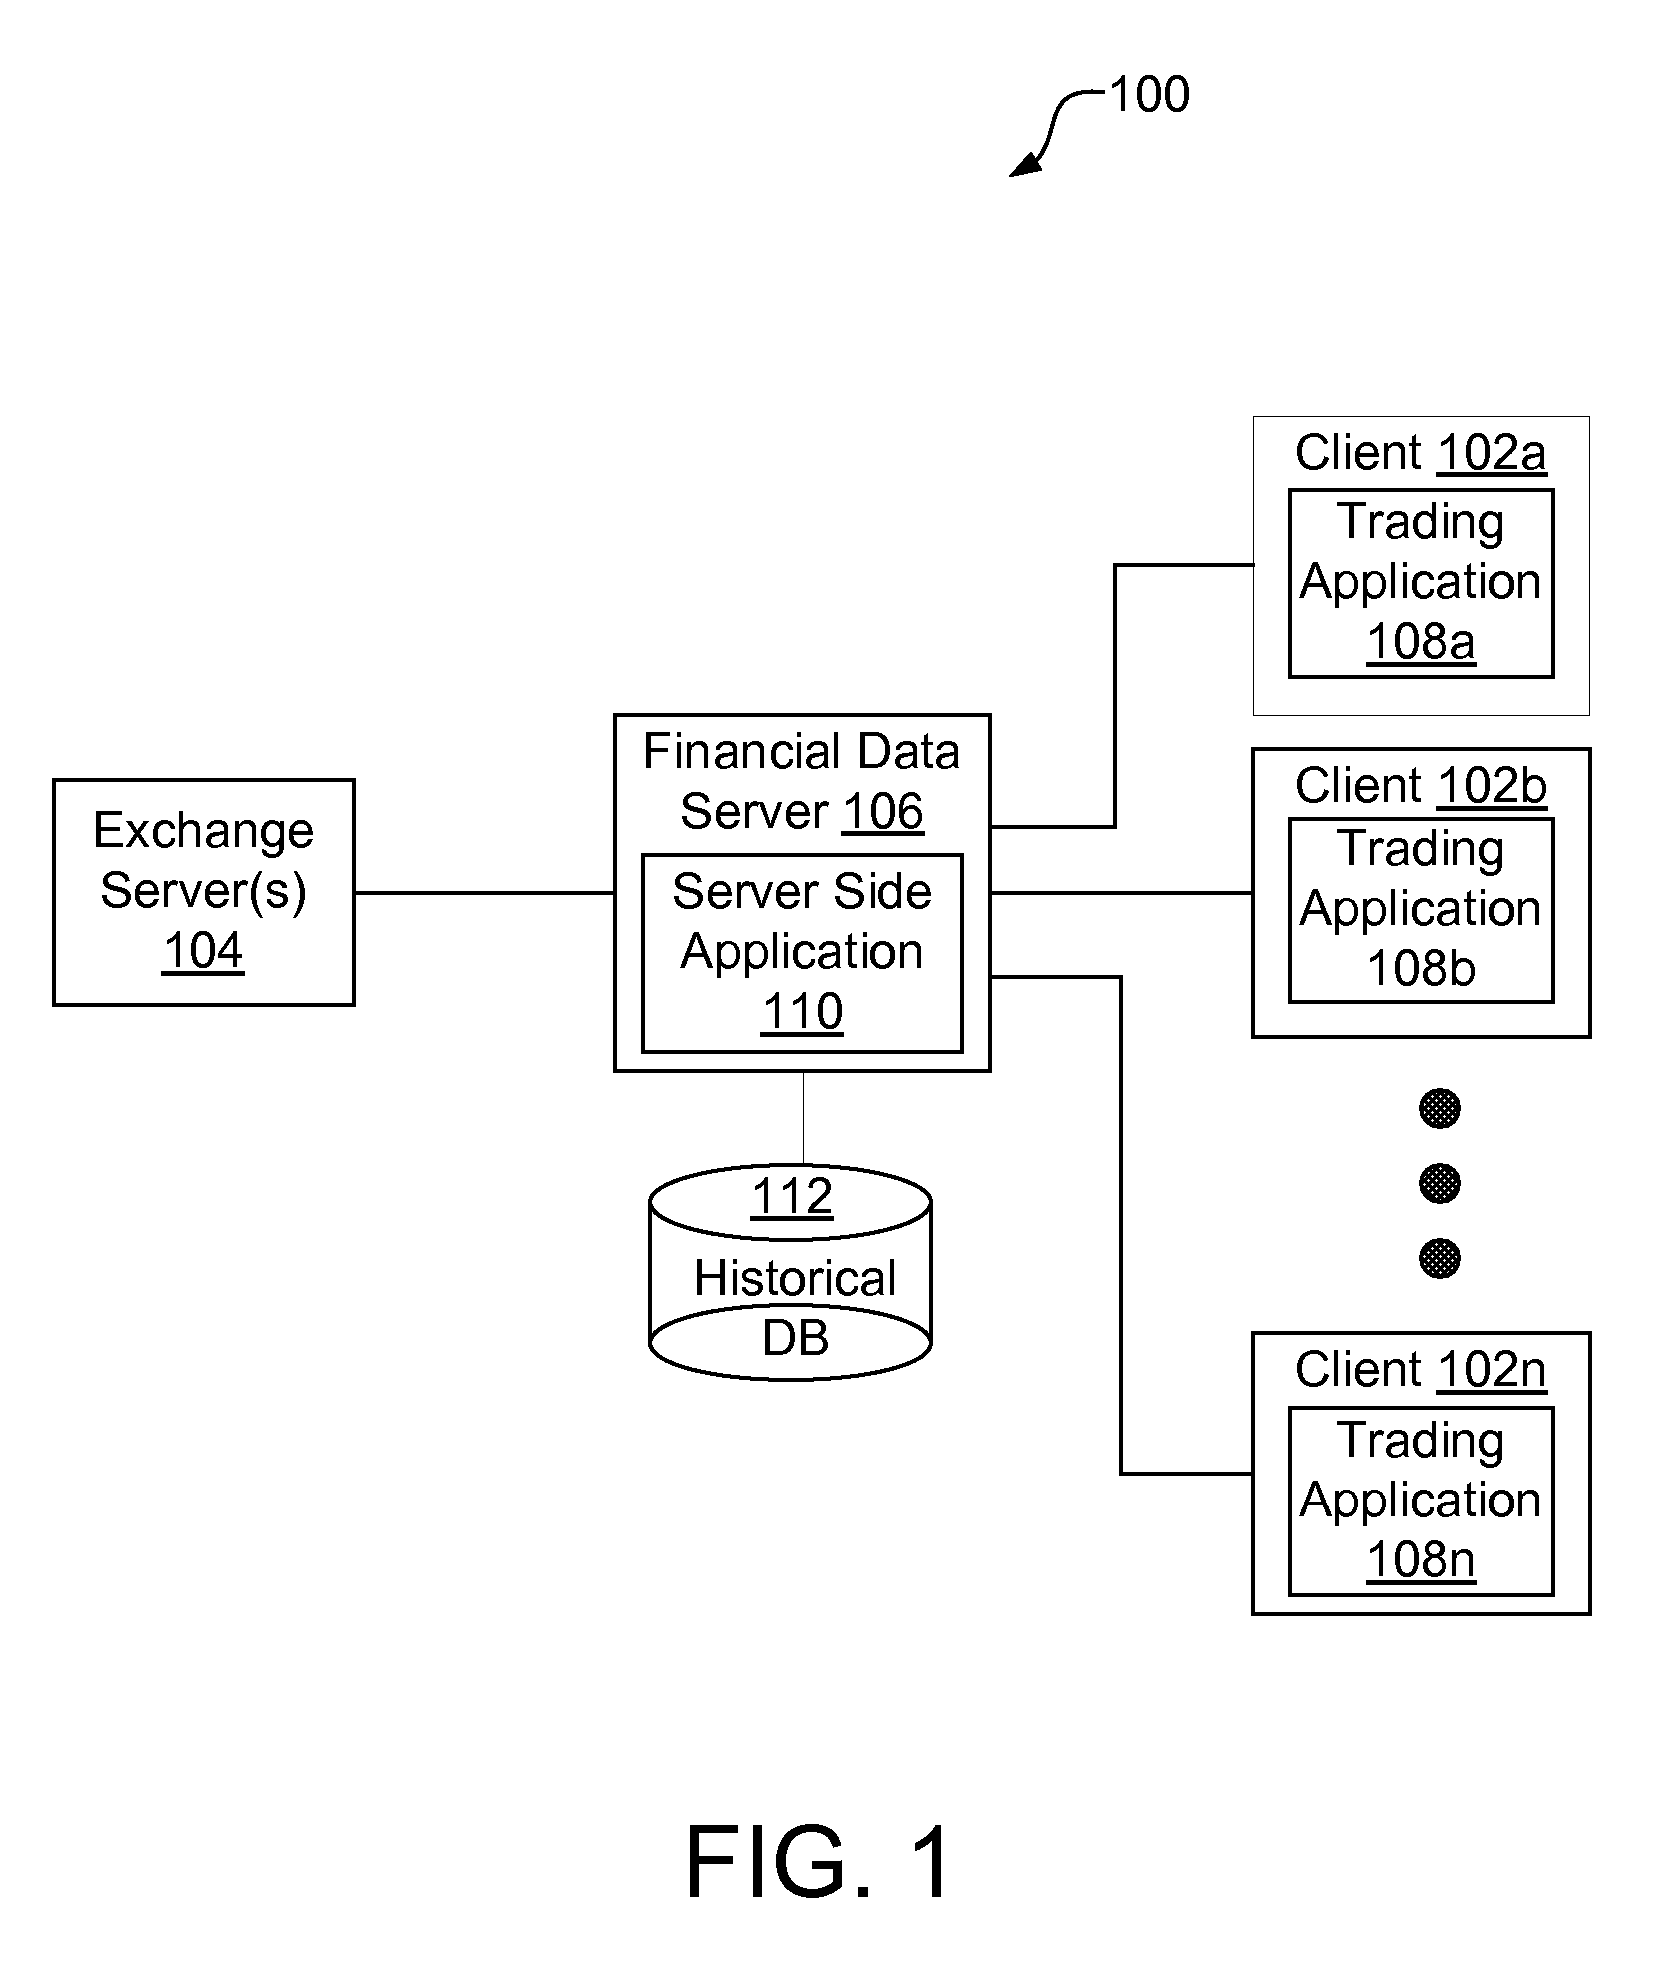
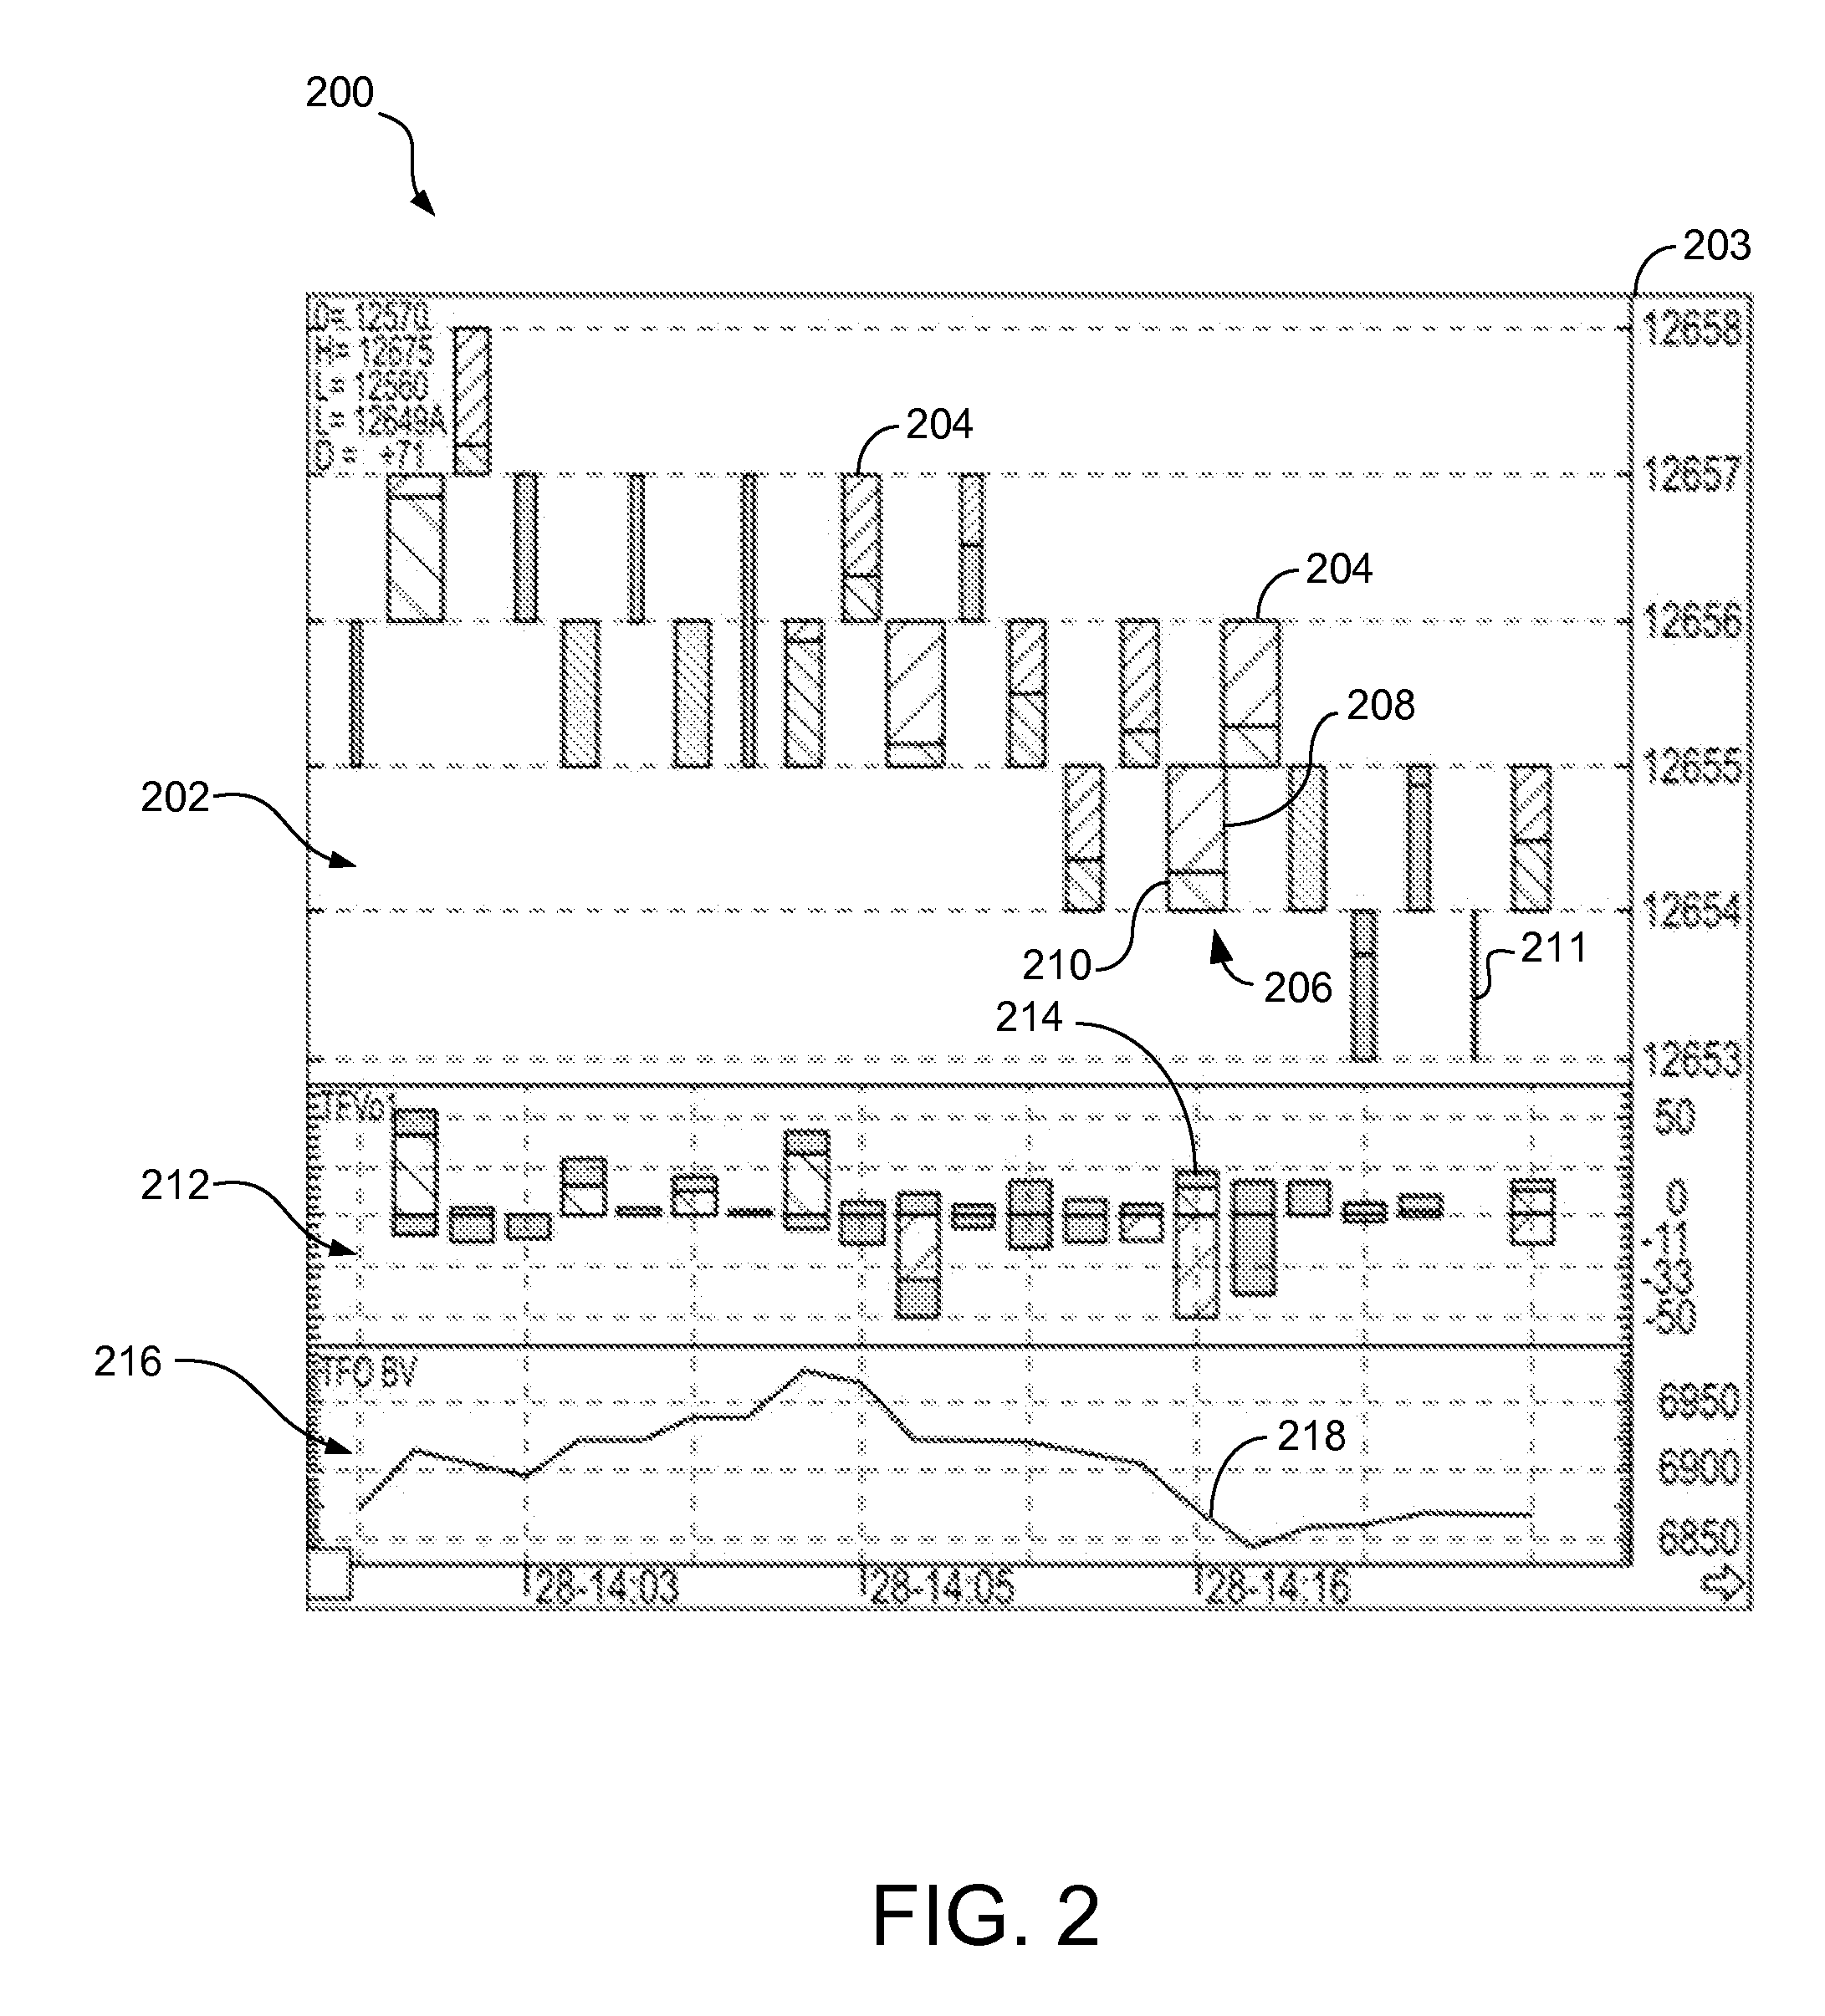
[0006] Systems and methods are described for generating depth of market (DOM) volume flow charts. According to various embodiments, the DOM volume of a financial instrument is monitored. The DOM volume can include volume elements corresponding to bid order volume and / or ask order volume of orders for the financial instrument that are open on an electronic exchange. A DOM volume flow may then be computed, according to some embodiments, by evaluating a function of one or more elements of the DOM volume and / or a change in the DOM volume elements. Then, indicators of the computed DOM volume flow may be displayed on a chart.

Problems solved by technology

While conventional methods for generating and presenting bar charts can be useful, they are generally fairly limited in their indication of current and likely future trends of financial data.

Method used


Image

  • Charting with depth of market volume flow
  • Charting with depth of market volume flow
  • Charting with depth of market volume flow

Examples


Embodiment Construction

[0027] Various embodiments of the present invention relates generally to displaying information related to financial instruments. More specifically, embodiments of the present invention relate to systems and methods for generating depth of market volume flow charts.

[0028] Some embodiments are described for computing depth of market volume flow data values related to order volume of orders for financial instruments at a financial exchange. The depth of market volume flow data values can be used in financial analyses and in generating financial charts. Some embodiments of the present invention relate to determining data points used in generating bars in bar charts. Algorithms are presented that determine when and how the data points are generated. Data points for a bar are determined in a manner that provides information about changes in the inside market price and / or in the order volume. In this manner, a trader may be able to more readily identify possible trends in price, volume, ...


PUM


Abstract

Systems and methods are described for generating depth of market (DOM) volume flow charts. According to various embodiments, the DOM volume of a financial instrument is monitored. The DOM volume can include volume elements corresponding to bid order volume and / or ask order volume of orders for the financial instrument that are open on an electronic exchange. A DOM volume flow may then be computed, according to some embodiments, by evaluating a function of one or more elements of the DOM volume and / or a change in the DOM volume elements. Then, indicators of the computed DOM volume flow may be displayed on a chart.

Description

CROSS-REFERENCE TO RELATED APPLICATIONS [0001] This application claims the benefit of Provisional Application No. 60 / 833,095, filed on Jul. 25, 2006, which is hereby incorporated by reference for all purposes.COPYRIGHT NOTICE [0002] Contained herein is material that is subject to copyright protection. The copyright owner has no objection to the facsimile reproduction of the patent disclosure by any person as it appears in the Patent and Trademark Office patent files or records, but otherwise reserves all rights to the copyright whatsoever. Copyright © 2006-2007 CQG Inc. TECHNICAL FIELD [0003] Various embodiments of the present invention generally relate to displaying information related to financial instruments. More specifically, embodiments of the present invention relate to systems and methods for generating depth of market volume flow charts. BACKGROUND [0004] In the field of financial trading, trading of financial instruments (e.g., securities, commodity, currency, or index fut...

Claims


Application Information

Patent Timeline
Patent Type & Authority Applications(United States)
IPC IPC(8): G06F17/40G06F17/10G06Q40/00
CPCG06Q40/06G06Q40/00
Inventor MATHER, TIMOTHY S.
Owner CQGT
Learn More