Method of displaying data in a table

a table and data technology, applied in the field of can solve the problems of many limitations in the use of microsoft excel, difficulty in determining the correct width amount of each column, and difficulty in displaying data in a table, so as to achieve the effect of easy to s

Inactive Publication Date: 2008-05-01
CHIN PHILIP KING
View PDF13 Cites 78 Cited by
  • Summary
  • Abstract
  • Description
  • Claims
  • Application Information

AI Technical Summary

Benefits of technology

[0033] The instant method also allows displaying a multi-column drop down list in a web page. It aligns the columns of a top row of data with the columns of the bottom rows of data while additionally collapsing or expanding the bottom rows of data depending upon the user input. The method allows users to see in a Web page, the fixed Header rows that users now see in spreadsheet programs such as Excel when they scroll vertically through rows...

Problems solved by technology

However, Microsoft Excel is not a traditional Web Page that uses HTML (Hyper Text Markup Language), or CSS (Cascading Style Sheets), that is an application suitable for displaying data on an Internet-web page.
Although Microsoft Excel spreadsheet can still be viewed in a browser, yet this is still not a typical web page that uses HTML or CSS; it has many limitations in its use and where it can be used.
The disadvantage of this method is that one has difficulty in determining the correct width amount to set each column.
Furthermore, if the data comes from a database, the data can constantly change as well, thus the top table's columns width amounts can either be too large or too small for the data and headers to be displayed.
There are numerous web sites that list the disadvantages of FRAMES in the use of web pages.
Some disadvantages are the difficulty in book marking and printing.
Still another disadvantage is the difficulty of the design and maintenance of the FRAMED or IFRAME web pages.
This cross-browser compatibility is also very difficult to achieve even without the use of stationary headers.
Thus, setting the width attribute is very difficult.
This also affects the alignment of the columns.
Slight differences can cause columns to be misaligned.
If the browser is maximized, this also can affect the alignment.
That is, certain font unit sizes can be adjusted by some browsers while other browsers cannot adjust the text.
For example, IE Text Size adjustment cannot adjust fo...

Method used


Image

  • Method of displaying data in a table
  • Method of displaying data in a table
  • Method of displaying data in a table

Examples


Embodiment Construction

[0055] Turning now to the drawings in more detail. FIG. 10 illustrates an HTML table having a header 12, rows 14 and 16 and a plurality of vertical columns A, B, C, and D. HTML Tables will naturally collapse around the widest cell in a columns if the columns width attribute is not set (or declared) to some pixel width or percentage width. For example, ColumnA, the cell in row #2 is the widest. In ColumnB, the cell in row #1 is the widest. However, in ColumnC, the cell that contains the text, “ColumnC” in the header row is the widest of all rows, including row #1 and row #2. In this example, an HTML table without any width attributes that are declared will naturally collapse or shrink around the widest cell for each column.

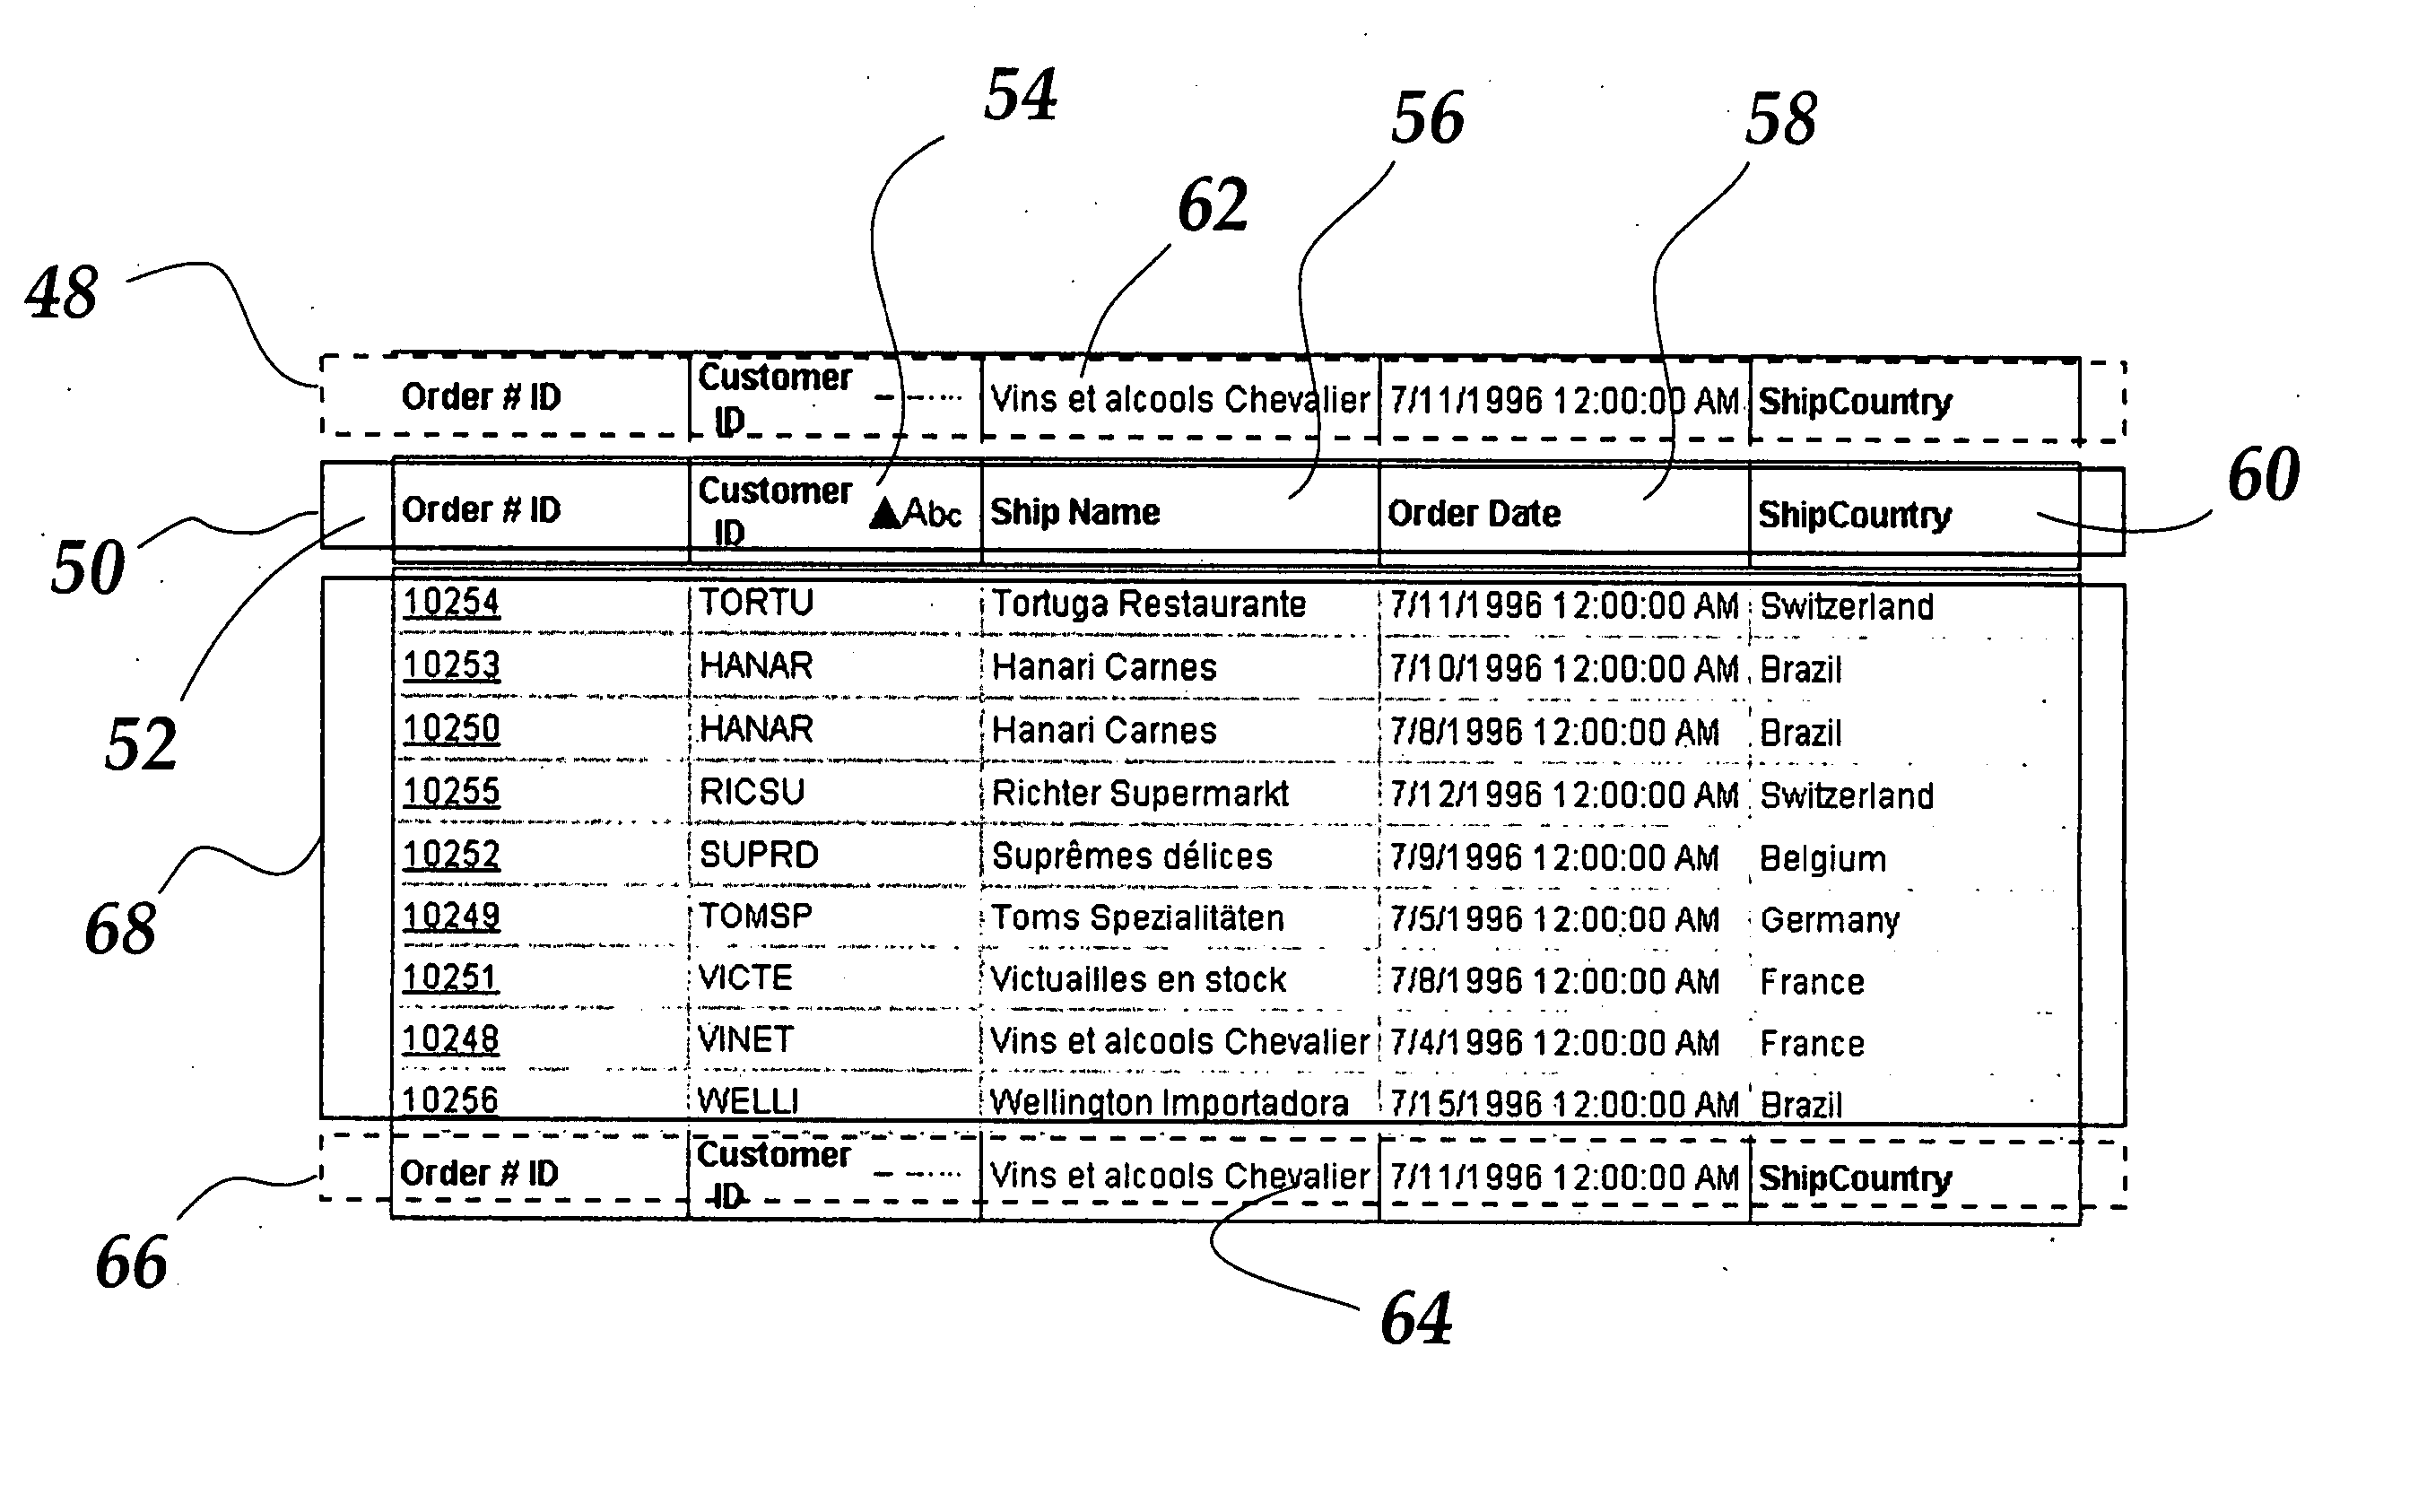
[0056] This invention provides a method of organizing a display wherein a single datagrid is designed with individual tags and controls to make the fixed header section. FIG. 11 illustrates such a datagrid containing a header and another datagrid directly undernea...


PUM


Abstract

A method and computer-executable program code for displaying data in a table having columns, rows and a plurality of cells defined by the columns and rows. The method involves the steps of creating a first and a second sub-tables positioned one above another or side-by-side. The top sub-table defines a non-scrollable, fixed header, while the bottom table defines a scrollable data table. The top table has a visible part and a hidden part, which contains records copied from a maximum width cell in the top or bottom table corresponding to each individual column. To form a fixed sidebar, the code computer-executable program code adjusts the height of the rows based on the parameters of a maximum height cell in the row.

Description

CROSS-REFERENCE TO RELATED APPLICATIONS [0001] This application is a continuation-in-part of my co-pending application Ser. No. 11 / 284,942 filed on Nov. 21, 2005, which is based on my provisional application No. 60 / 631,152 filed on Nov. 26, 2004, entitled “Method For Creating a Data Table with a Stationary Header in a Web Page,” the priority of which is hereby claimed and the full disclosures of which are incorporated by reference herein.BACKGROUND OF THE INVENTION [0002] Ever since the beginning of the Internet and web pages, there has been a need to have tabular data displayed in an easily readable form. When a web page designer needs to display multiple rows of data, e.g. 20, 50, 100, or more rows, it is highly desirable for the headers or labels of each column of data row to remain “fixed” or “stationary” while a user, or person using a browser, can scroll down the rows of data while still being able to see and read the column headers or column labels at the top of the table. Th...

Claims


Application Information

Patent Timeline
IPC IPC(8): G06F17/30
CPCG06F17/245G06F40/177
Inventor CHIN, PHILIP KING
Owner CHIN PHILIP KING
Why Eureka
Try Eureka