
System and method for determining composite indicators

a composite indicator and indicator technology, applied in the field of determining composite indicators, can solve the problems of difficult use and/or difficult combination of a large amount of information

Inactive Publication Date: 2008-06-12
RISK MANAGEMENT ASSOC THE
View PDF6 Cites 13 Cited by
  • Summary
  • Abstract
  • Description
  • Claims
  • Application Information

AI Technical Summary

Benefits of technology

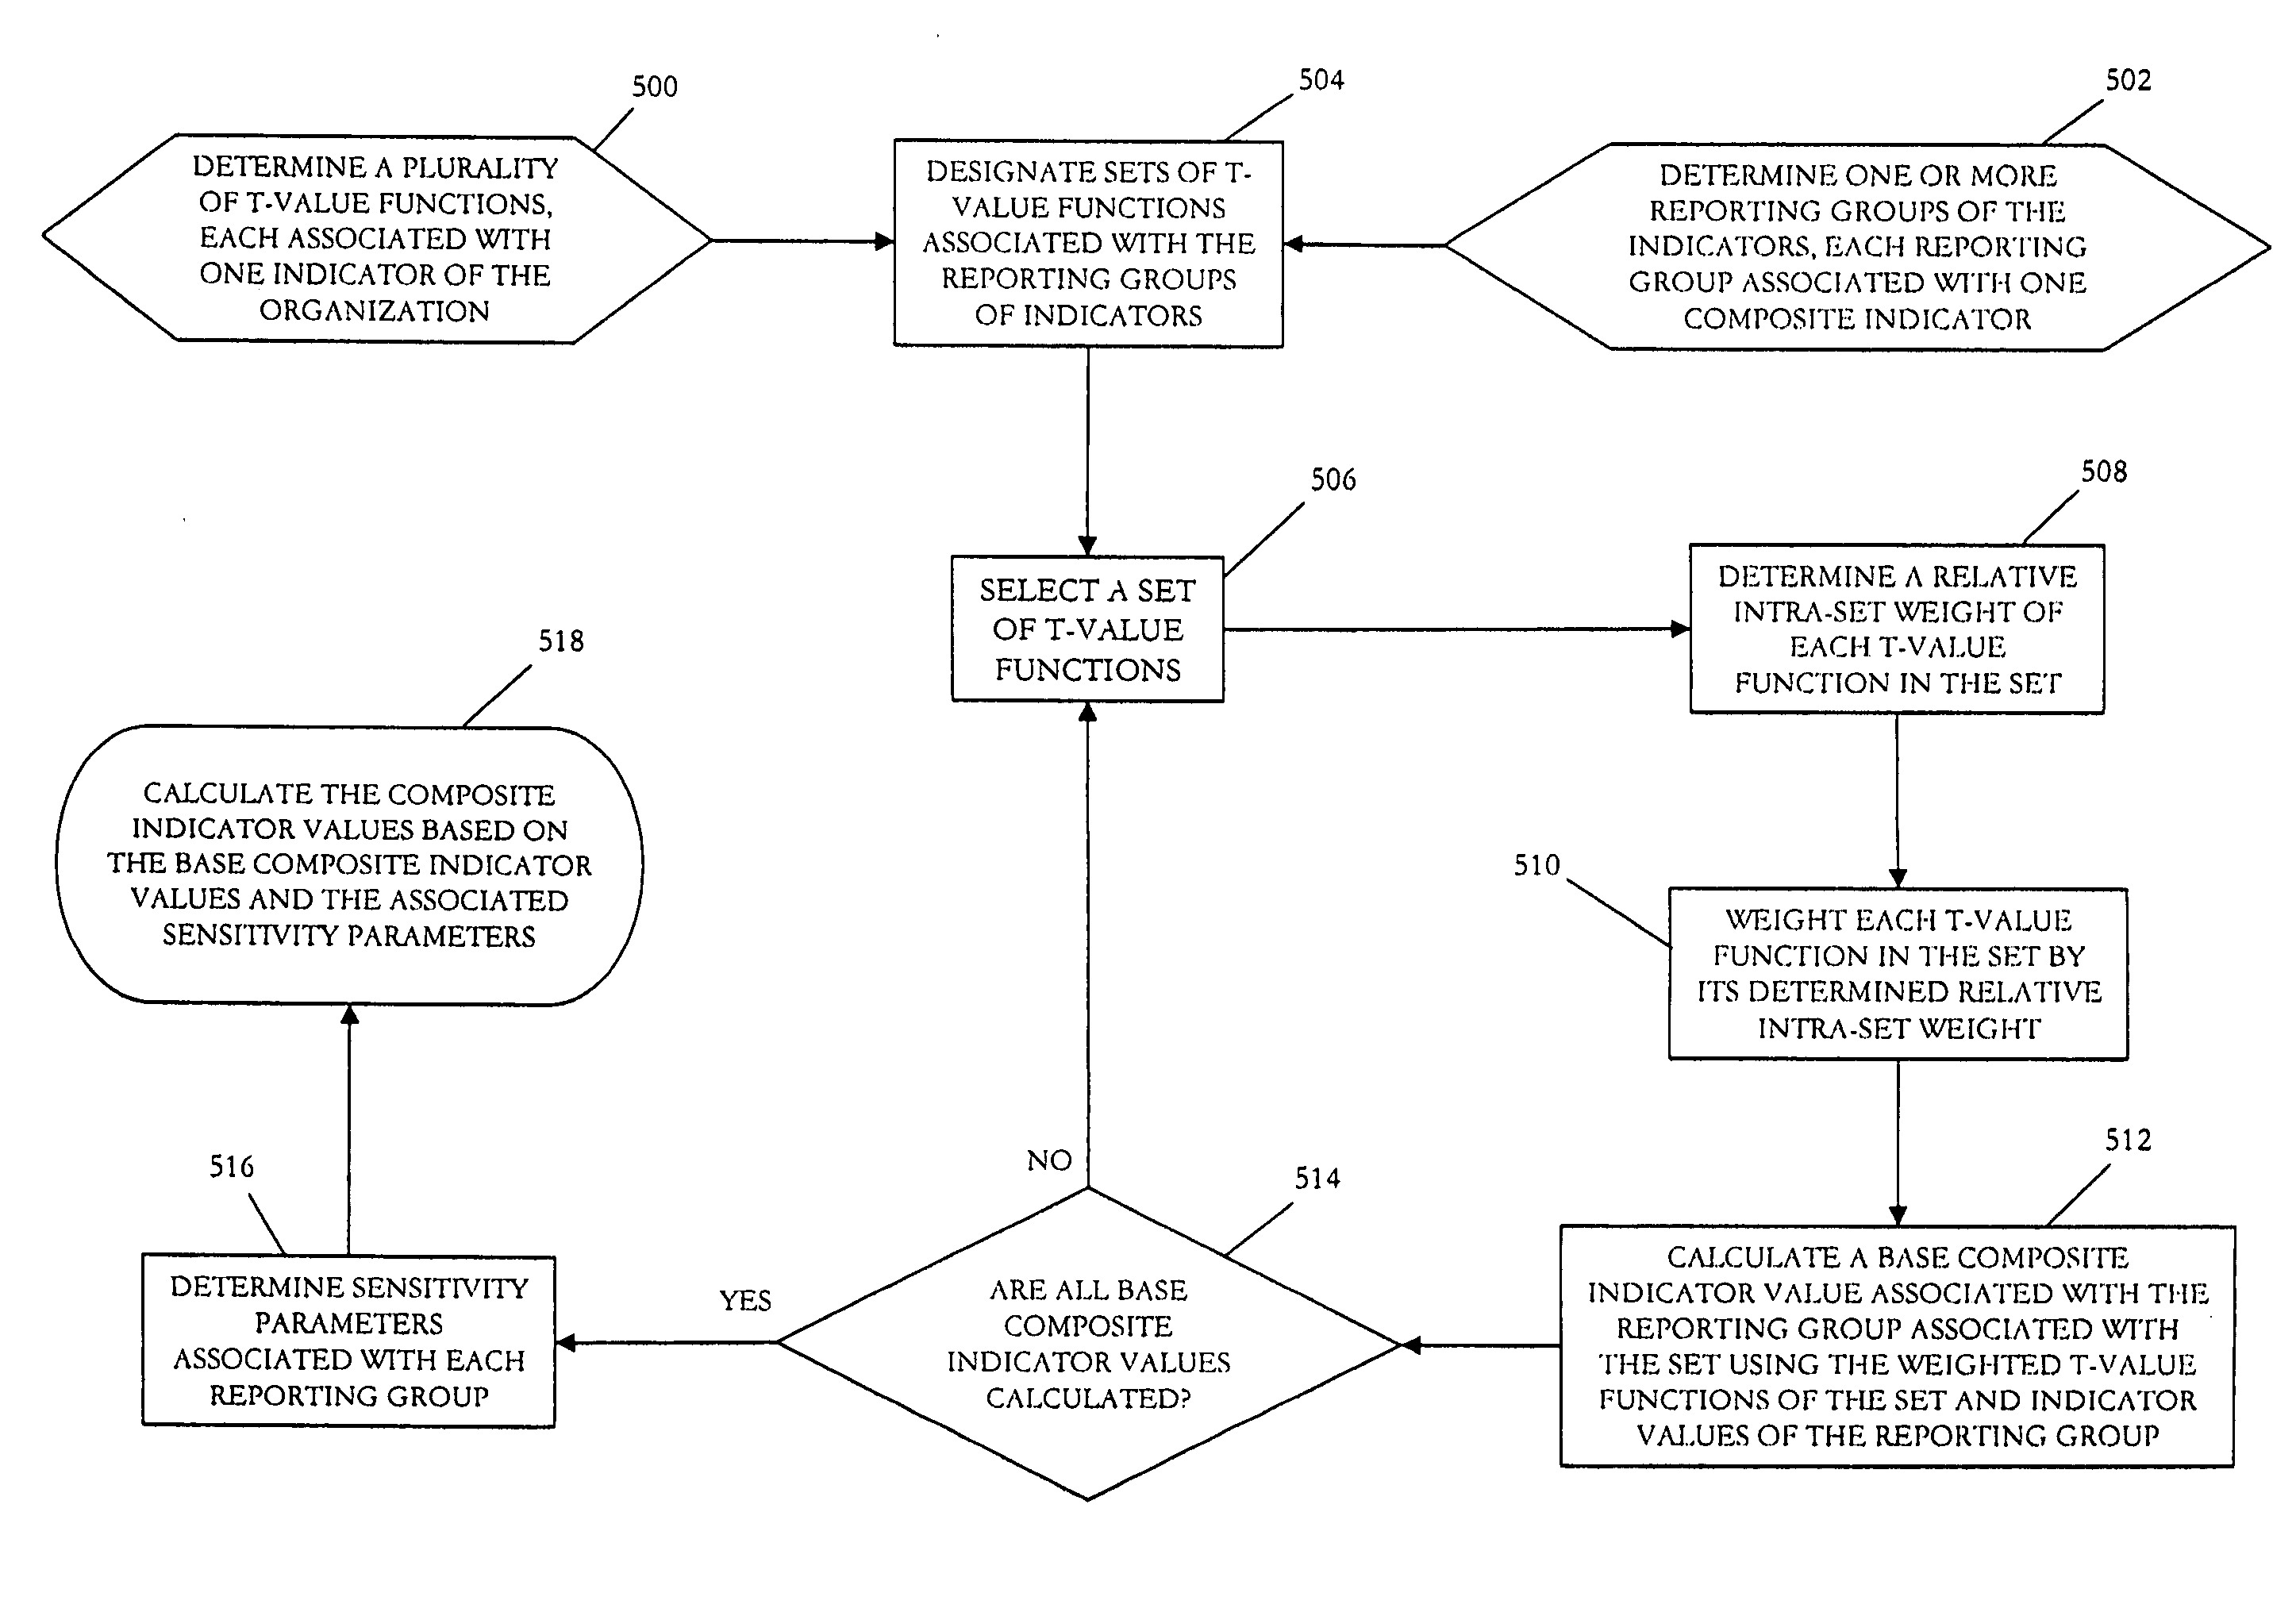
[0007]A further exemplary embodiment of the present invention is a method of forming one or more composite indicator values for reporting on a number of indicators of an organization. A T-value function associated with each of the indicators is established. One or more reporting groups of the indicators are determined. Each reporting group is associated with one of the composite indicators. One or more sets of T-value functions are designated from the established T-value functions. Each set of T-value functions includes T-value functions associated with one reporting group of indicators. For each set of T-value functions,

Problems solved by technology

This multitude of information can be difficult to combine and / or difficult to use for extracting the “key” values that management (or any central control) might find useful.
One context in which this problem arises is the management of operational risk in large financial institutions.
Corporate operational risk managers have faced the problem for some time of determining how to extract useful decisionable information for reporting up to higher management levels, including senior management.

Method used


Image

  • System and method for determining composite indicators
  • System and method for determining composite indicators
  • System and method for determining composite indicators

Examples


Embodiment Construction

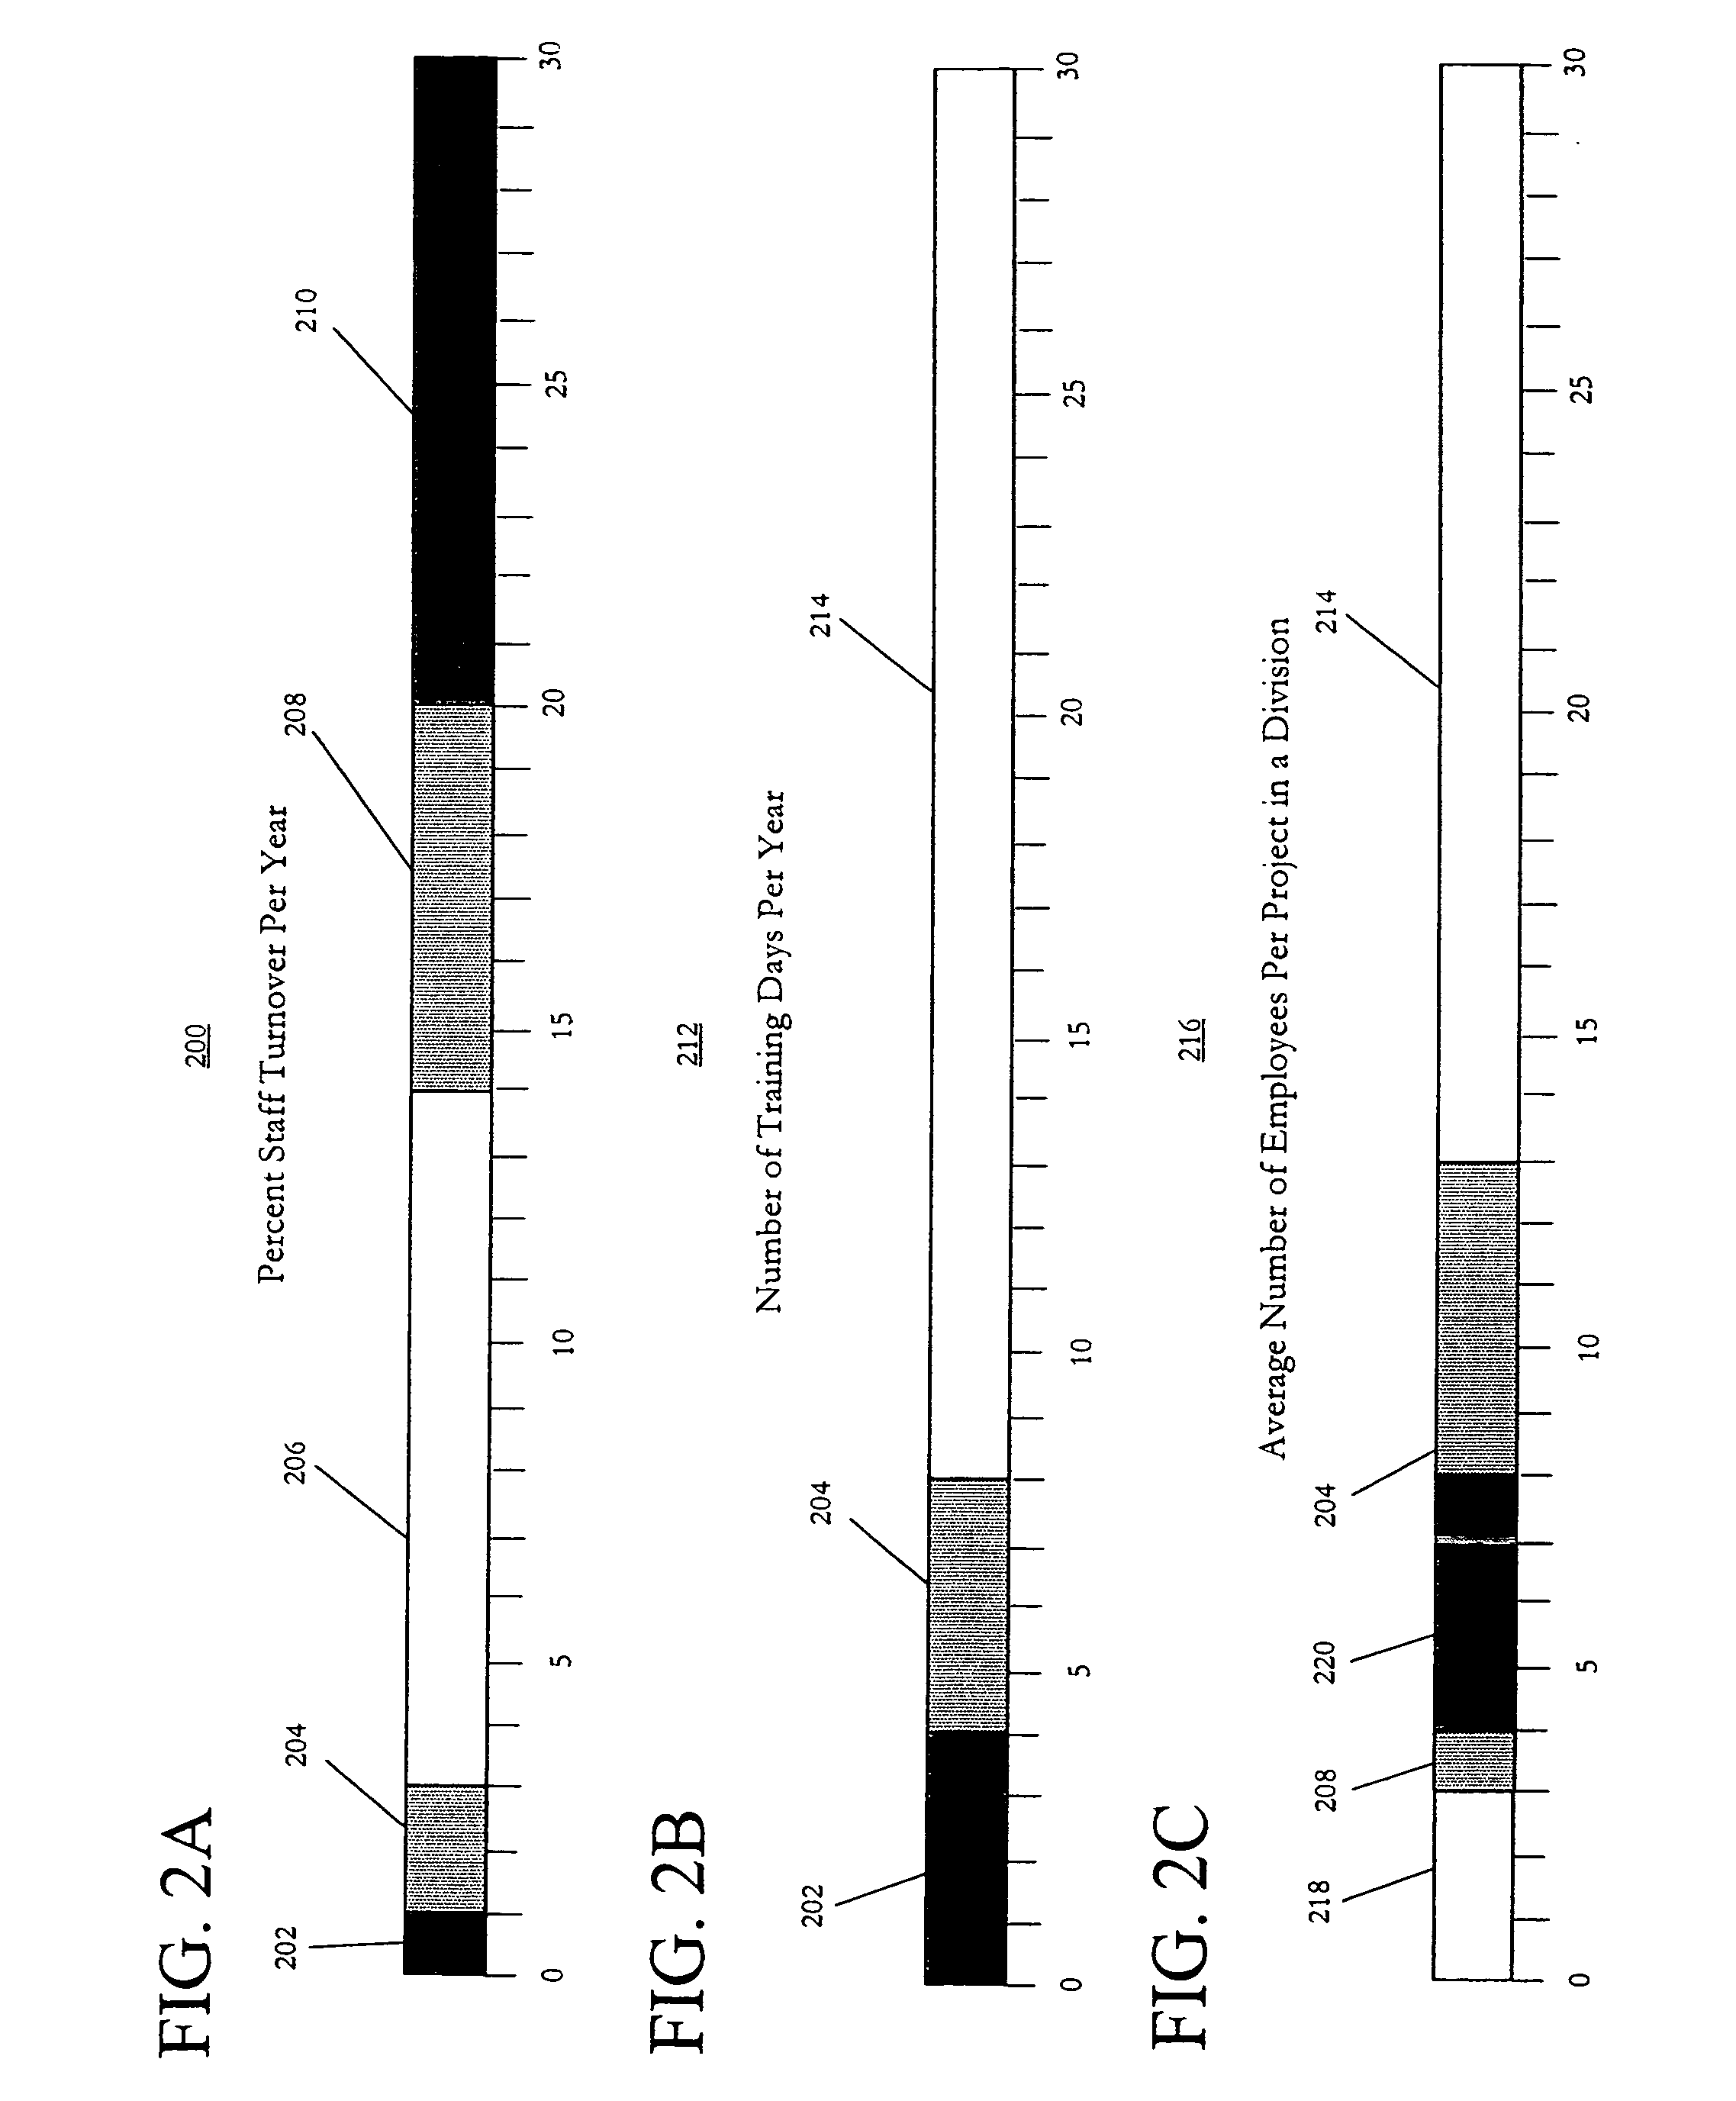
[0017]In exemplary embodiments of the present invention, composite indices or indicators may be calculated as simple functions of a group of underlying variables, either weighted or unweighted. Such composite indices have proved durable and valuable in many aspects of economic life and in many aspects of engineering. The underlying reason for this durability is that any continuous multivariate partially differentiable function is approximately linear at any particular point, and, therefore, may be approximated by its tangent line or space over short ranges with some accuracy by a comparatively simple linear or multiplicative formula. In many exemplary methods of the present invention, the use of such approximations may lead to only a slight loss of generality, because these exemplary methods presuppose that the ranges of values of most interest are known (i.e. the defined ranges around thresholds). Additionally, the resulting simplification of the mathematical formulae used in the c...


PUM


Abstract

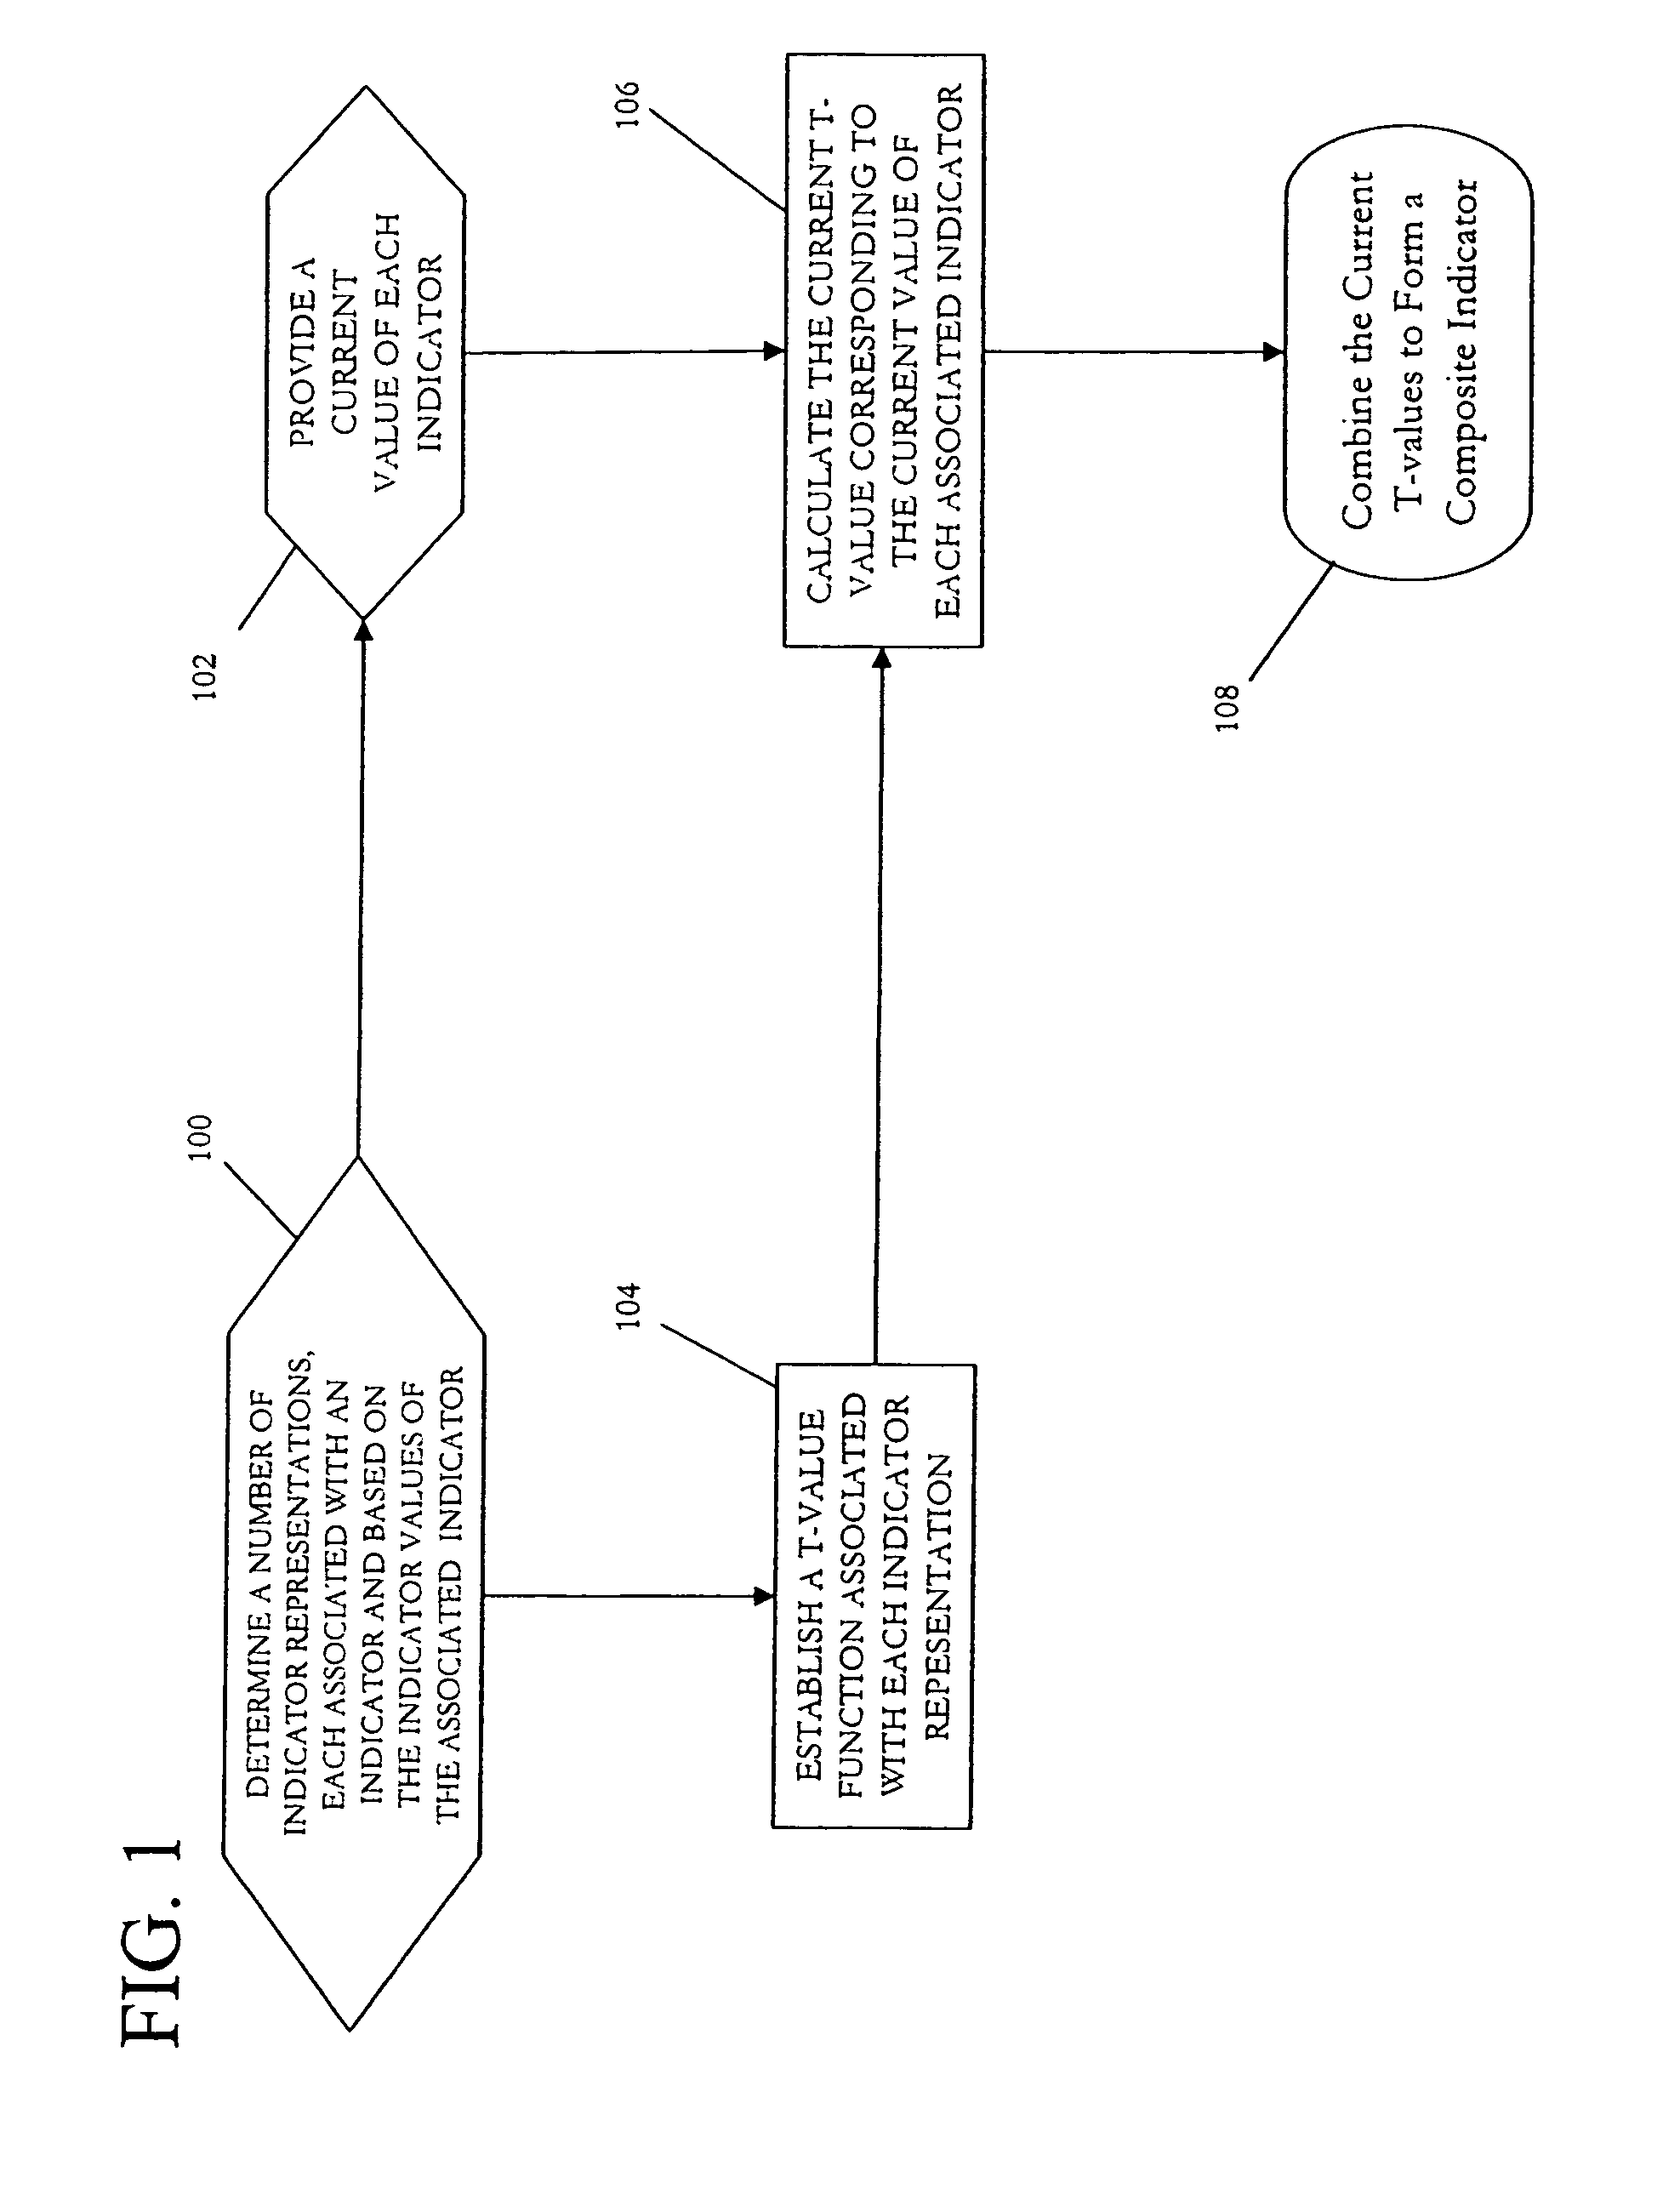
A method for determining a composite indicator value associated with a number of indicators. Indicator representations, each associated with an indicator and based on its indicator values, are determined. A current indicator value is provided for each indicator. A T-value function associated with each indicator representation is established. Each T-value function is a continuous function of the associated indicator having: a first T-value for indicator values in a first range of the associated indicator representation; a third T-value equal to or greater than a minimum value for indicator values in a third range of the associated indicator representation; and a second T-value for indicator values in a second range of the associated indicator representation that varies monotonically between the first and third range values. Current T-values corresponding to the current indicator values are calculated using the associated T-value functions. These current T-values are combined to calculate the composite indicator value.

Description

FIELD OF THE INVENTION[0001]The present invention generally relates to a method of determining composite indicators from diverse indicator representations based on various indicators of an organization, and more particularly, this method may be used to determine composite risk indicators that allow for the efficient disclosure of potential operational risks.BACKGROUND OF THE INVENTION[0002]Quantitative measures, indicators, or indices of performance are commonly recorded and tracked in businesses and organizations. In many organizations and processes, these indices come in many different forms, scales, and kinds. This multitude of information can be difficult to combine and / or difficult to use for extracting the “key” values that management (or any central control) might find useful.[0003]One context in which this problem arises is the management of operational risk in large financial institutions. In this context, so-called “key risk indicators” are a common way of monitoring risk ...

Claims


Application Information

Patent Timeline
IPC IPC(8): G06Q99/00
CPCG06Q10/06G06Q10/063G06Q10/0635G06Q90/00G06Q10/06393G06Q10/06398G06Q30/0201G06Q10/06375
Inventor TAYLOR, CHARLES
Owner RISK MANAGEMENT ASSOC THE
Learn More