Interactive graphics-based planning systems

Active Publication Date: 2008-08-14
PMA TECH
10 Cites 48 Cited by

AI-Extracted Technical Summary

Problems solved by technology

These methods are effective tools when used by highly-trained, experienced, knowledgeable planning professionals, but they are extremely complex and generally cannot be effectively used by inexperienced professionals or laypeople wanting to plan a single project.
The disconnected, serial, complex protocols typically require much iteration before the plurality of activities and relationships depicting the project are satisfactorily completed.
Thus, planning and scheduling become very time-consuming iterative processes; only through laborious trial and error are realistic project...

Method used

[0154]As noted, when Project Planning System 109 (operationally enabled on Computer 105) detects a change of any kind to Project Plan 111, Project Planning System 109 executes one ore more computational and display steps comprising: calculating and displaying Relationship Float (also sometimes herein referred to as Logic Float or Gap); calculating and displaying Buffer Float (also sometimes herein referred to as Free Float or bFloat); calculating and displaying Activity Float (also sometimes herein referred to as Forward Float); and, if in lean planning mode, calculating and displaying Cut Float (also sometimes herein referred to as Controlled or Bound Float) and, if in the reverse mode, calculating and displaying Reverse Float (also sometimes herein referred to as Back Float). Thus, Project Planner 102 may preferably make changes in Activity 201 and/or Link 203 and/or Milestone 213 and receive immediate feedback from Project Planning System 109 which, in turn, permits Project Planner 102 to make adjustments to Project Plan 111 quickly and easily. Additionally, Project Planner 102 may work in the personally most effective sequence of steps to complete Project Plan 111 thereby effectively combining project planning and scheduling into a continuous process to yield Project Plan 111 in the shortest possible time. In addition, the preferred processes of Interactive Graphics-Based Planning System 100 enables users to make their own choices as to which project activities to move to earlier or later time frames, “crash” or extend to improve manpower loading and optimize time-dependent costs.
[0173]Preferably, the impact of planning and scheduling decisions are immediately presented to Project Planner 102, which preferably enables rapid iterative development of Project Plan 111, as shown above. When Activities 201 are connected and dated in one step in full view of stakeholders, they can apply their collective judgment to select/re-select activity dates and prevent inadvertent error during planning. Thus, as the evolving schedule nears full development, Project Planner 102 and key stakeholders are able to resolve resource constraints, accomplish schedule recovery, look for optimal date scenarios, and otherwise quickly rework the initial draft plan, visually, without having to rely on the black box calculations performed by conventional scheduling methodologies.
[0177]Cost Optimization in preferred embodiments of Interactive Graphics-Based Planning System 100 is preferably handled in a similar interactive manner. Provided time-cost data is similarly associated with project tasks/activities, as such activities are added, deleted and/or repositioned on Time-Scaled Calendar 200. In the event the evolving plan breaches a milestone, preferably, Interactive Graphics-Based Planning System 100 offers the unique functionality of identifying all zero or small float activities that can be crashed or extended at optimal cost. Enabling such a comprehensive overview within Interactive Graphics-Based Planning System 100 greatly assists Project Planner 102 in selecting the order in which activities should be revised to optimize the project. Again, Interactive Graphics-Based Planning System 100 allows the evolving plan to be accelerated or relaxed, to adhere to deadlines (or to improve project pace) at the same time activities are positioned and interconnected on Time-Scaled Calendar 200. Again, this preferred system process is only possible owing to the concept of simultaneity as embodied within the preferred processes of Interactive Graphics-Based Planning System 100. The above-described cost optimization feature of Interactive Graphics-Based Planning System 100 at least embodies herein; associating time-cost data, by such at least one project planner using such at least one computational device, with such at least one symbol representing each such activity of such at least two activities of such plurality of activities on such at least one time-scaled calendar on such at least one graphical user interface; re-positioning, by such at least one project planner using such at least one computational device, such at least one symbol representing each such activity of such at least two activities of such plurality of activities on such at least one time-scaled calendar on such at least one graphical user interface; re-calculating, by such at least one computational device, such time-cost data, relating to at least one such activity repositioning, to provide at least one re-calculated time-cost profile; and displaying, essentially continuously, by such at ...

Benefits of technology

[0114]Web Browser. A software application that enables a user to display and interact with text, images, and other information typically located on a web page at a website on the World Wide Web or a local area network. Text and images on a web page can contain hyperlinks to other web pages at the same or different websites. Web browsers allow a user to quickly and easily access information provided on many web pages at ...

Abstract

This invention relates to providing a system for project planning and scheduling which supports simplified, interactive, graphics-based project planning and scheduling using new planning concepts, new scheduling concepts and new graphics-based software systems. Further, this invention permits an inexperienced user to simultaneously plan and schedule a project including establishing appropriate relationship (or dependency) links between activities, also commonly referred to as tasks, and between activities and milestones. This invention offers the simplest possible scheme of thought that can tie together activities, relationships and milestones, with or without deadlines, to yield a complete, correct network project schedule in the shortest possible time.

Application Domain

FinanceResources +4

Technology Topic

Program planningProject planning +5

Image

  • Interactive graphics-based planning systems
  • Interactive graphics-based planning systems
  • Interactive graphics-based planning systems

Examples

  • Experimental program(1)

Example

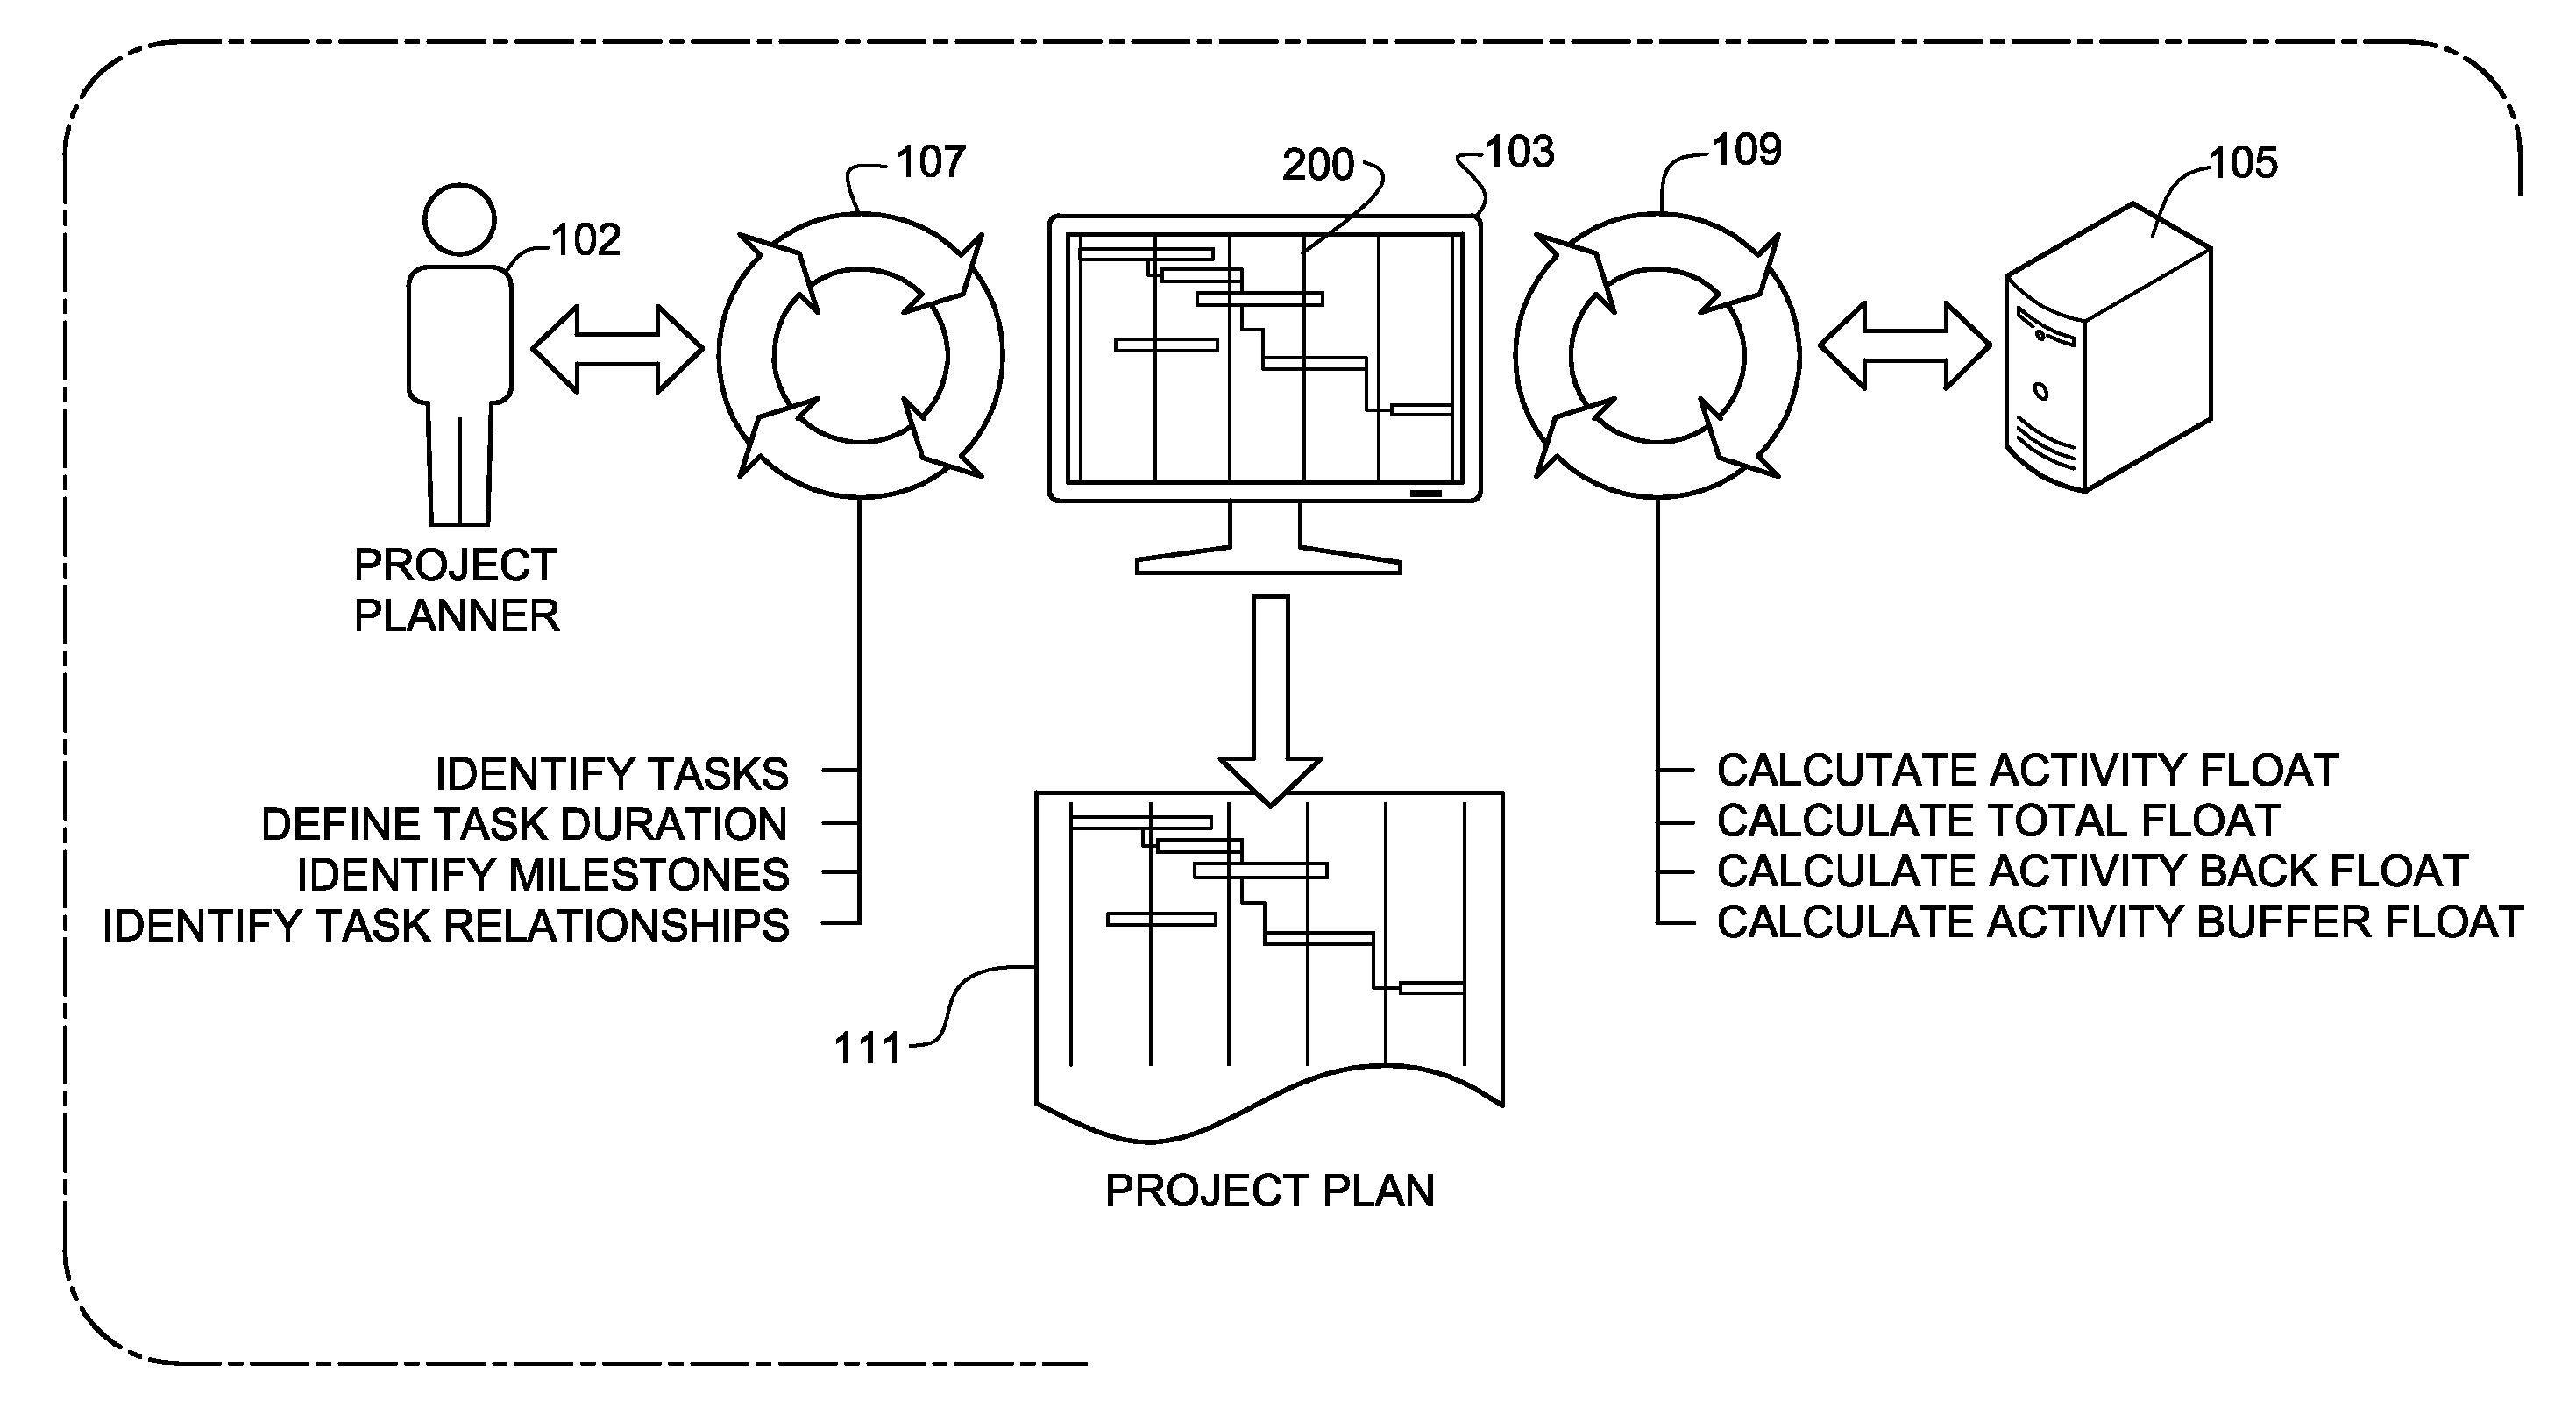
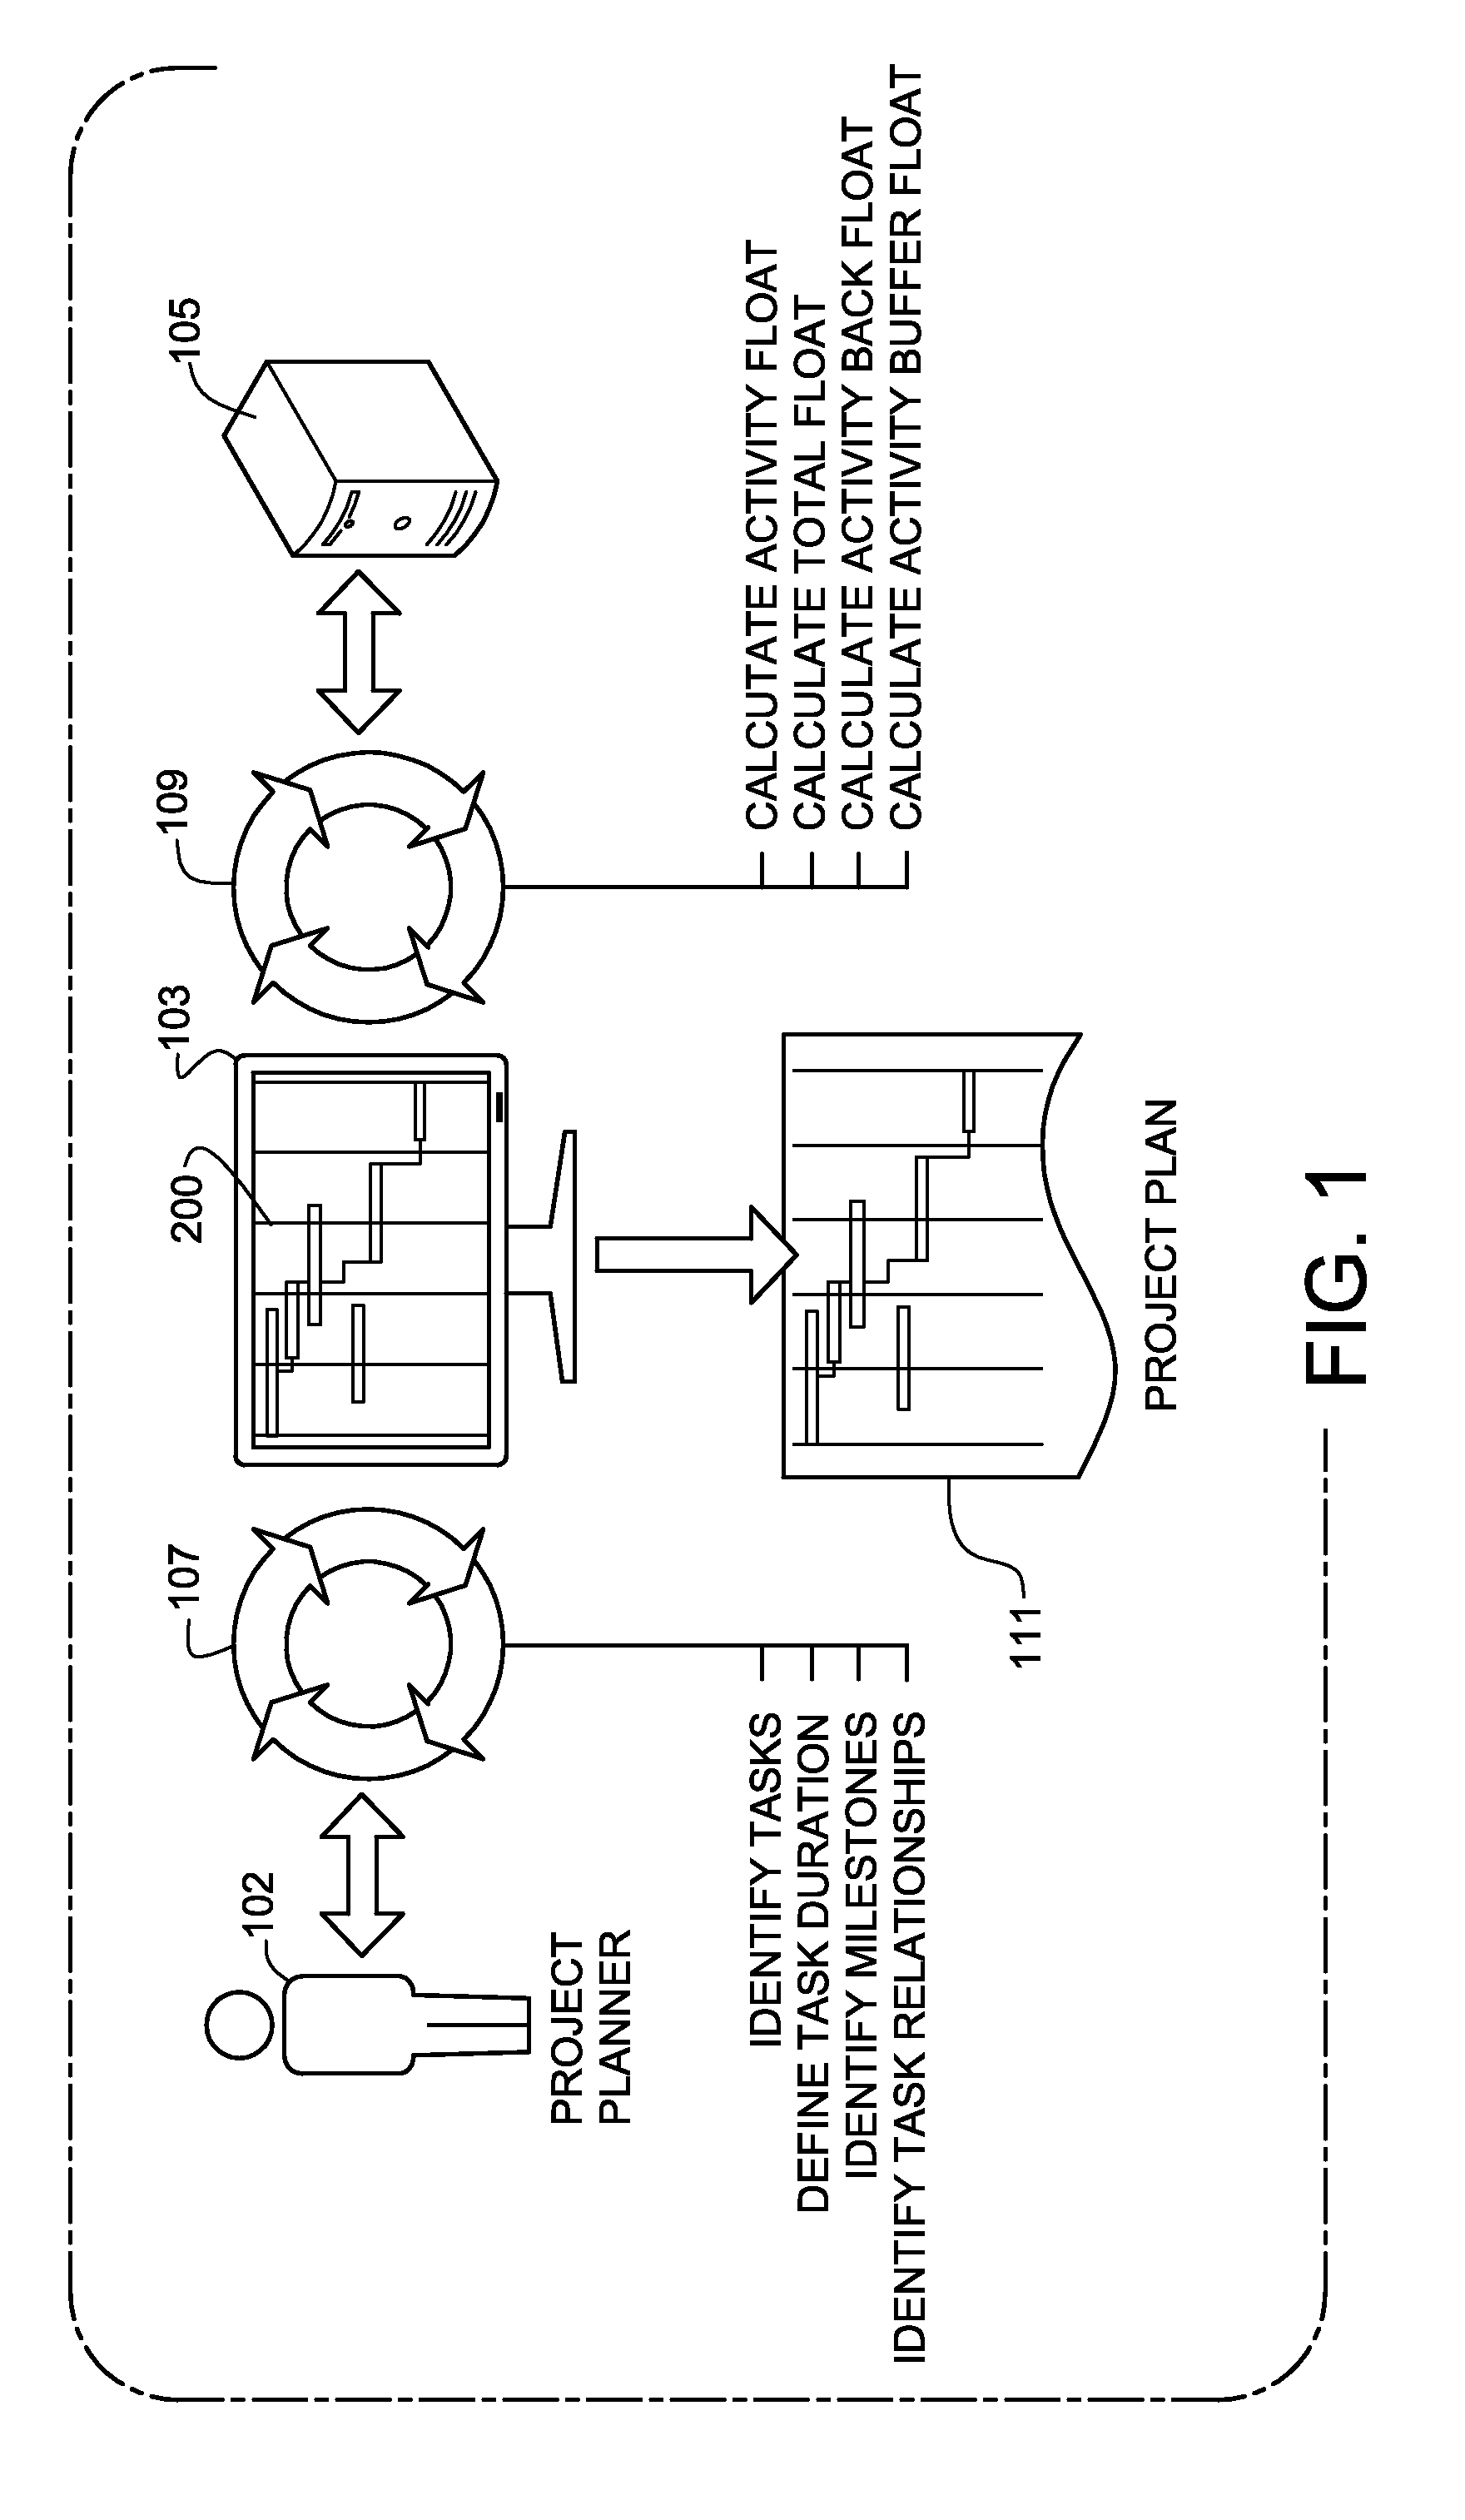
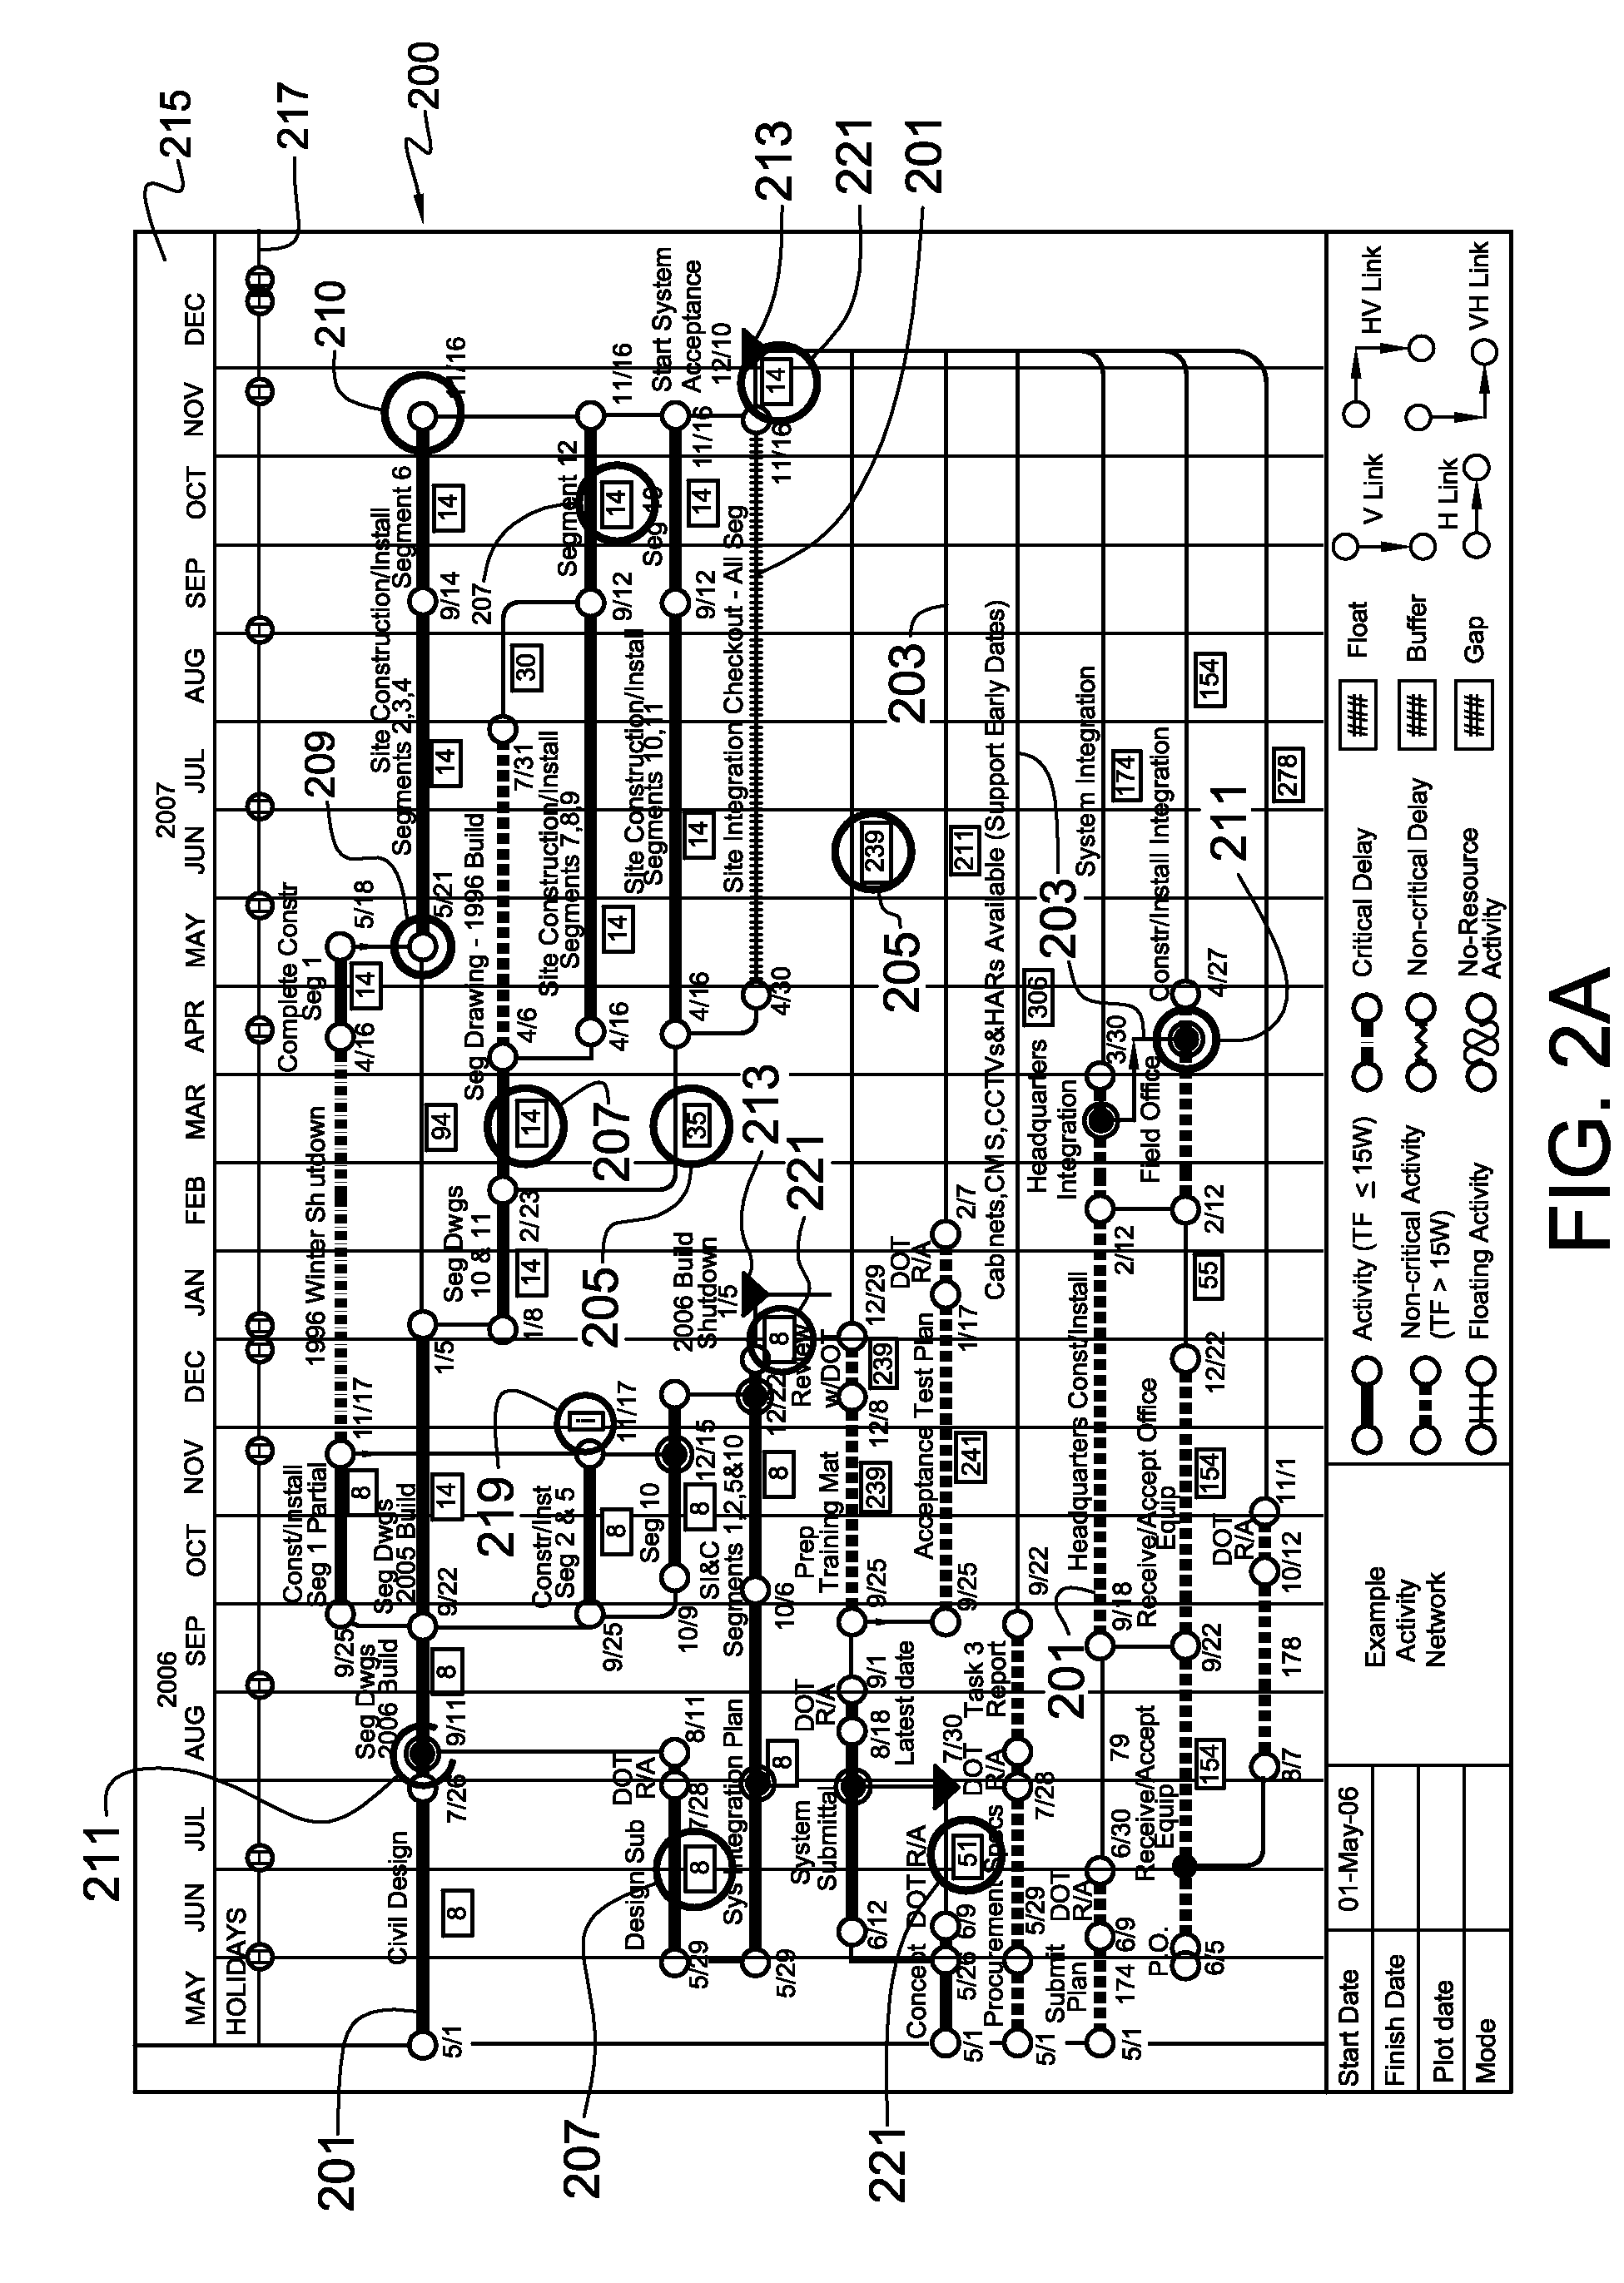
[0136]Referring to FIG. 1, a summary diagram illustrating the interactive planning and scheduling method provided by Interactive Graphics-Based Planning System 100 according to a preferred embodiment of the present invention, and referring to FIG. 2A, FIG. 2B, and FIG. 2C, a sample project schedule created through the use of the interactive planning and scheduling method provided by the Interactive Graphics-Based Planning System 100 according to a preferred embodiment of the present invention: Interactive Graphics-Based Planning System 100 was developed to make planning and scheduling an intuitive process for the user. The system is preferably designed to suit itself to a users' own heuristics and thought process developed through years of collective experience (which is not contingent on experience with conventional network-based planning and scheduling).
[0137]Graphics-Based Planning System 100 preferably relies on graphics technology where the visual display of diagramming objects (depicting the evolving schedule) is an intrinsic part of planning. The technology is preferably comprised of an event-driven Graphical User Interface 120 with multi-document capability and GPM (see glossary) algorithms and rules processors. Preferably, all work by Project Planner 102 is done on Time-Scaled Calendar 200 that is preferably displayed on Computer Monitor 103 of Computer 105. Project Planner 102 may simultaneously plan and schedule a project using an intuitive Graphical User Interface 120 implemented within Graphics-Based Planning System 100, as shown. Graphical User Interface 120 preferably comprises a plurality of interface tools, including menus, dialog boxes, toolbars, as described below.
[0138]It is again emphasized that Interactive Graphics-Based Planning System 100 preferably comprises a visual, planning-centric process for network-based planning and scheduling. Preferably, planning on Time-Scaled Calendar 200, as opposed to schematically is more efficient and allows planning to evolve spontaneously rather than sequentially. Preferably, for the same reason, planning may switch from working forward from release dates to backwards from target dates or milestones, and vice versa.
[0139]Preferably, in Project Planning Process 107, Project Planner 102 iteratively completes a variety of steps to plan and schedule Project Plan 111. Simultaneously, as changes and additions are made to Project Plan 111, Computer 105 completes a variety of calculations as using Project Planning System 109, the results of which are displayed on Computer Monitor 103. Thus, Project Planner 102 may complete Project Plan 111 interactively, fully controlling both the planning and scheduling, including determining activity duration and activity relationship ties (logic ties). Preferably, Interactive Graphics-Based Planning System 100 enables the generation of Project Plan 111 in a time scaled, collaborative, graphical, planning environment, preferably allowing a project planner with limited scheduling training to simultaneously and collaboratively plan and schedule a project.
[0140]By design preference, the steps used to generate Project Plan 111 may be completed in any order by Project Planner 102. Preferred steps include: identifying project activities (Activity 201), represented by dimension lines, preferably with or without, arrowheads, and placing them on Time-Scaled Calendar 200, setting the duration for each Activity 201 (as represented by the length of the line representing Activity 201), identifying and placing Milestone 213, preferably with or without deadlines, on Time-Scaled Calendar 200 and defining relationship ties (dependency relationships), as shown by Link 203, between two or more Activities 201 or between one or more Activities 201 and Milestone Deadline 213. It is noted that the development of Project Plan 111 may preferably comprise additional steps to enable the management of supplementary planning processes, such as, for example, Resource Optimization, Cost Optimization, and Schedule Risk, as further described below.
[0141]Preferably, Project Planning System 109 permits at least twelve combinations of relationship ties, connect Activities 201, and Milestone Deadlines 213. In principle, predecessor Activity 201 has three possible connect points, that is: Start Node (“I” node 209); Embedded Node 211; and Finish Node (“J” node 210). Preferably, any of them can connect to three connection points for successor Activity 201, that is: Start Node (“I” node 209); Embedded Node 211; and Finish Node (“J” node 210); and also to one connection point to Milestone Deadline 213. Therefore, the preferred twelve combinations are: [0142] 1. Predecessor Activity Start Node (“I” node 209) to Successor Activity Start Node (“I” node 209) It is noted that interdependent Start and Finish Nodes are graphically conveyed as shared (superimposed) nodes; [0143] 2. Predecessor Activity Start Node (“I” node 209) to Successor Activity Finish Node (“J” node 210); [0144] 3. Predecessor Activity Start Node (“I” node 209) to Successor Activity Embedded Node 211; [0145] 4. Predecessor Activity Embedded Node 211 to Successor Activity Embedded Node 211; [0146] 5. Predecessor Activity Embedded Node 211 to Successor Activity Start Node (“I” node 209); [0147] 6. Predecessor Activity Embedded Node 211 to Successor Activity Finish Node (“J” node 210); [0148] 7. Predecessor Activity Finish Node “J” node 210) to Successor Activity Start Node (“I” node 209); [0149] 8. Predecessor Activity Finish Node (“J” node 210) to Successor Activity Finish Node “J” node 210); [0150] 9. Predecessor Activity Finish Node (“J” node 210) to Successor Activity Embedded Node (“E” Node 211); [0151] 10. Predecessor Activity Start Node (“I” node 209) to Milestone Deadline 213; [0152] 11. Predecessor Activity Finish Node (“J” node 210) to Milestone Deadline 213; and [0153] 12. Predecessor Activity Embedded Node 211 to Milestone Deadline 213.
[0154]As noted, when Project Planning System 109 (operationally enabled on Computer 105) detects a change of any kind to Project Plan 111, Project Planning System 109 executes one ore more computational and display steps comprising: calculating and displaying Relationship Float (also sometimes herein referred to as Logic Float or Gap); calculating and displaying Buffer Float (also sometimes herein referred to as Free Float or bFloat); calculating and displaying Activity Float (also sometimes herein referred to as Forward Float); and, if in lean planning mode, calculating and displaying Cut Float (also sometimes herein referred to as Controlled or Bound Float) and, if in the reverse mode, calculating and displaying Reverse Float (also sometimes herein referred to as Back Float). Thus, Project Planner 102 may preferably make changes in Activity 201 and/or Link 203 and/or Milestone 213 and receive immediate feedback from Project Planning System 109 which, in turn, permits Project Planner 102 to make adjustments to Project Plan 111 quickly and easily. Additionally, Project Planner 102 may work in the personally most effective sequence of steps to complete Project Plan 111 thereby effectively combining project planning and scheduling into a continuous process to yield Project Plan 111 in the shortest possible time. In addition, the preferred processes of Interactive Graphics-Based Planning System 100 enables users to make their own choices as to which project activities to move to earlier or later time frames, “crash” or extend to improve manpower loading and optimize time-dependent costs.
[0155]Illustrating a preferred embodiment: Project Planner 102 will first define Time-Scaled Calendar 200 preferably by using Schedule Attributes dialog box 202 as shown in FIG. 6 and Holiday Definition dialog box 212 as shown in FIG. 7. Once Time-Scaled Calendar 200 is established, Project Planner 102 may identify/define any number of tasks (also herein referred to as Activities) preferably in one of two ways. Project Planner 102 may preferably open Activity Properties dialog box 215, as shown in FIG. 3, to complete the information necessary to place Activity 201 on Time-Scaled Project Calendar 200. Alternately preferably, Project Planner 102 may place Activity 201 on Time-Scaled Calendar 200 by clicking Activity Icon Button 401 on tool bar 230 (as shown in FIG. 4) and then draw Activity 201 as a dimensioned line on Time-Scaled Calendar 200. Preferably, activities comprise an initial estimated duration. Similarly, Project Planner 102 may place Milestone 213 on Time-Scaled Calendar 200 in two ways, preferably either by opening Milestone Event Properties dialog box 216, as shown in FIG. 5, or alternately preferably, by clicking Milestone Icon Button 403 on the tool bar 230 (as shown in FIG. 4). Either method preferably enables the subsequent drawing of Milestone Deadline 213 on Time-Scaled Calendar 200. Preferably, Project Planner 102 may then establish Link 203 as relationship ties (also sometimes herein referred to as logic ties or dependency relationships) between two or more Activities 201. This is also preferably accomplished in one of two ways, preferably either by clicking Link Icon Button 402 on tool bar 230 (as shown in FIG. 4) and then drawing Link 203 on Time-Scaled Calendar 200 between predecessor and successor Activities 201 or, alternately preferably, by selecting “Link” from the menu and defining the type of relationship tie between predecessor and successor Activities 201. Preferably, Project Planner 102 may also establish Link 203 relationship ties between one or more Activities 201 and between one or more Activities 201 and Milestone Deadline 213. Preferably, the attachment point for Link 203 may be the start of Activity 201 (“I” node 209), the end of Activity 201 (“J” node 210) or at a particular point within the duration of Activity 201 (Embedded Node 211). Preferably, points of attachment for Link 203 with each respective Activity 201 are not lost if Project Planner 102 re-positions Activity 201 or modifies the duration of Activity 201. Preferably, relationship ties represented by Link 203 between Activity 201 and Milestone Deadline 213 are not lost if properties of Activity 201 or Milestone Deadline 213 are modified. Furthermore, the addition of new Activities 201, establishment of logic ties (relationship ties) between two or more Activities 201, shown as Link 203, between one or more Activities 201 and Milestone Deadline 213 may be completed in any sequence desired by Project Planner 102.
[0156]Referring again to FIG. 2A, FIG. 2B, and FIG. 2C, preferably, Interactive Graphics-Based Planning System 100 presents key scheduling information utilized during Project Planning Process 107. Preferably, this scheduling information comprises Relationship Float 205 (depicting relationship ties between at least two Activities 201), either Activity-related float 207 (Activity Float in FIG. 2A, 2B, 2C) and Relationship Float 221 (depicting relationship tie between Activity 201 and Milestone Deadline 213). Preferably, Activity-related Float 207 may display the results of a calculation of Activity Float (Forward Float) or Cut Float when Lean Planning calculation mode is selected in conjunction with forward-planning mode calculation. Preferably, Activity-related Float 207 may also display Reverse Float (Back Float) if Project Planner 102 selects backward-planning mode calculation (lean planning mode calculation is preferably not used in conjunction with backward planning mode calculation, for the sake of simplicity). For example, if Project Planner 102 prefers to view float values calculated from the end of the project, Activity Float (also sometimes herein referred to as Forward Float, a distantly analogous concept to total float in CPM) related to Activity 201 will be continuously calculated and displayed below Activity 201 as Activity Float 207. On the other hand, if Project Planner 102 prefers to view float calculated from the beginning of the project, i.e. in the backward-planning mode, Reverse Float (also sometimes herein referred to as Back Float) will be continuously calculated and displayed below Activity 201 as Total Float 207. Preferably, if lean planning mode calculation is selected in conjunction with forward planning mode calculation, Cut Float values (also sometimes herein referred to as Controlled or Bound Float) is continuously calculated and displayed below Activity 201 as Total Float 207 when relationship tie, represented by Link 203 between Activity 201 and Milestone 213, when Milestone 213, representing a Milestone Deadline, are defined. Preferably, Project Planner 102 may add hyperlinks to other documents or other information sources such as web sites using Information Object Properties dialog 231, as shown in FIG. 9. Preferably, the hypertext link is then displayed as Information Object 219. Preferably, Project Planner 102 may optionally add Horizontal Divider 223 (shown on FIG. 10 and FIG. 11 only for clarity) to assist in isolating related groups of Activities 201 by selecting Horizontal Divider Icon 405 (as shown in FIG. 4) and completing the Horizontal Divider Line Properties dialog box 232 as shown in FIG. 8. Preferably, Project Planner 102 may then graphically re-position Horizontal Divider 223 using the mouse or similar graphical pointing device of Computer 105.
[0157]Preferably, Relationship Float (also sometimes herein referred to as Buffer), displayed below Link 203 as Relationship Float 205, is calculated as the elapsed time between the start and end points of Link 203, which represents a time-dependent relationship between two or more activities within Project Plan 111. Preferably, Relationship Float 205 is calculated as Hi,j=Hj−Hi; for each “J”, where “Hj” denotes the connection date to at least one successor activity “J” of a plurality of such successor activities and “Hi” denotes the connection date from at least one predecessor activity “I” of a plurality of such predecessor activities. For example, if the starting connection date of Link 203 is Jan. 20, 2007 and its ending connection date is Jan. 22, 2007 the Relationship Float is 2 days.
[0158]Preferably, Buffer Float (BF) is calculated as a function of Relationship Float (H), and the relationship is algorithmic where BFi=min [Hi,j], for all “J”, where “J” denotes each and every successor activity to the “I” Activity 201. Preferably, Buffer Float (BF), if turned on, is continuously calculated and displayed below Activity 201 as Buffer Float 207 when Project Planner 102 has chosen to show calculation of floats from the end of the project.
[0159]Preferably, Activity Float (AF) is calculated as a function of Relationship Float (H), and the relationship is algorithmic where AFi=min [Hi,j+AFj], for all “J”, where “J” denotes each and every successor activity to the “I” Activity 201. Preferably, Activity Float (AF), if turned on, is continuously calculated and displayed below Activity 201 as Activity Float 207 when Project Planner 102 has chosen to show calculation of floats from the end of the project.
[0160]Preferably, Cut Float (CF), continuously calculated and displayed below Activity 201 as Cut Float 207, is an algorithmic calculation where CFi=min [min[Hi,j+AFj], Hi;m], where Hm denotes the link float between the “I” Activity 201 and a connected, “M” Milestone Deadline 213. Preferably, Cut Float values are only calculated and displayed if the user turns on the lean planning mode calculation. If not, then preferably Activity Float values are calculated with respect to the overall schedule completion date and displayed.
[0161]Preferably, Reverse Float (RF) is calculated as a function of Relationship Float (H) and the relationship is algorithmic where RFj=min [RFi+Hi,j], for all “I”, where “I” denotes each and every predecessor activity to the “J” Activity 201. Preferably, Reverse Float (RF) is continuously calculated and displayed below Activity 201 as Reverse Float 207 when Project Planner 102 has chosen to show calculation of floats from the beginning of the project.
[0162]Upon reading the teachings of this specification, those with ordinary skill in the art will now understand that, under appropriate circumstances, considering such issues as advances in technology and user preference, etc., other methods of displaying Buffer Float, Activity Float, Cut Float and Reverse Float, such as side-by-side display of Activity Float and Reverse Float, or the use of mouse-over displays of Activity Float and Reverse Float or another display method, etc., may suffice.
[0163]Additionally, Project Planner 102 may preferably re-arrange Activities 201, adjust durations of Activities 201, move or adjust Milestone 213 and set up or remove Link 203 in any sequence desired by Project Planner 102, thus planning may proceed in a manner that is best suited to Project Planner 102. As changes are made to Project Plan 111 each value described above is re-calculated and the updated value displayed, which provides feedback to permit Project Planner 102 to determine the optimum schedule for Project Plan 111 without relying on complex and possibly disjointed steps or having substantial training and experience in the theory and practice of project planning. FIG. 10 and FIG. 11 illustrate examples of how changes made by Project Planner 102 are preferably presented. Preferably, Interactive Graphics-Based Planning System 100 permits the implementation of overlapping logic on otherwise non-overlapping ADM networking techniques through the use of Embedded Node 211 and Link 203 as a means for describing overlapping time-dependent relationships between Activities 201.
[0164]Preferably, Interactive Graphics-Based Planning System 100 permits Project Planner 102 to substitute ADM notation, or PDM notation for LDM notation by selecting the desired notation style from the Tools menu of Graphics-Based Planning System 100. It is noted that Interactive Graphics-Based Planning System 100 preferably utilizes attribute color to assist Project Planner 102 in differentiating graphical composition. Upon reading the teachings of this specification, those of ordinary skill in the art will now understand that, under appropriate circumstances, considering such issues as intended use, user preference, etc., other graphic arrangements, such as varying line types, etc., may suffice.
[0165]Referring again to FIG. 2A, FIG. 2B, and FIG. 2C, showing a sample project schedule created through the use of the interactive planning and scheduling method provided by the Interactive Graphics-Based Planning System 100 according to a preferred embodiment of the present invention, shown below are preferred attributes of:
1) Time-Scaled Calendar 200 Attributes (denotes icon, which pops dialogue box) Calendar Beginning Any date after 01-Jan-1900 Starts the time- Date scaled calendar Calendar Ending Date Any date after 01-Jan-1900 Fixes the end of the calendar Strips (@ top of Year/Quarter/Month/Week/Day A sightline for each calendar) strip/time unit Optional Strips Bottom and any chosen gridline Point & Click or enter gridline # Sightlines Year/Quarter/Month/Week/Day Heaviest for Y & Q; thinnest for Day Non-Working, Holidays Countries' menu; list legal Allow user to add holidays and delete dates Non-Working, Fri, Sat or Sun may be non- Allow user to add Weekends working back specific dates Non-Working, Special Specific day(s) or interval(s) Strictly user-defined Days Non-Working Day Line Below strip, (H) or (N) (2 > ea. date Repeat for optional strips Planning Mode Forward Planning Display aFloat or bFloat Forward/Lean Planning Calc & Display cFloat Backward Planning Calc & Display rFloat
2) Activity 201 Attributes (denotes icon, which pops dialogue box) Activity Description Return key allows Once input, converts to text box multiple rows I-Node (LDM & ADM) Automatic by clicking Display date as user on LDM icon clicks/drags node J-Node (LDM & ADM) Automatic by clicking Display date as user on LDM icon clicks/drags node Planned Start Date (PSD) Point & Click; input; Place right of I-node; converts or calculate to text box Planned Finish Date Point & Click; input; Place left of J-node; converts (PFD) or calculate to text box Duration (DUR) Input or calculate Calendar Days (CD) or from start/finish Work Days (WD); show/lock value as user Buffer Float (bFloat) Calculate in Work Days Calculate as BFi = min Hi, j (WD) or Calendar Days (CD) based on DURATION Activity Float (aFloat) Calculate in Work Days Calculate as AFj = min [Hij + AFj] (WD) or Calendar Days (CD) based on DURATION Cut Float (cFloat) Calculate in Work Days Calculate as CFi = min [min[Hi, j + AFj], (WD) or Calendar Days Hi, m] (CD) based on DURATION Reverse Float (rFloat) Calculate in Work Days Calculate as RFj = min [RFi + Hi,j] (WD) or Calendar Days (CD) based on Activity Color Option Forward Planning Mode Red if aFloat < float threshold float Backward Planning Mode Red if rFloat < float threshold float Activity Node Paint Blank, activity color or User selects option for Option yellow selected nodes Activity Input Display Start date; finish date; User selects attribute(s) to display Options duration Float Display Options aFloat or bFloat Forward Planning Mode cFloat Forward/Lean Planning Mode rFloat Backward Planning Mode Reset Start/Finish Dates Fix start, calculate finish User option based on duration or vice versa Activity Gridline Gridline on which Calculate based on user's point activities are displayed & click
3) Link 203 Attributes (denotes icon, which pops dialogue box) Embedded Node or Small yellow node between Show/lock date as user eNode (LDM) start & finish nodes points/clicks Relationship (Zero- V (vertical only) Hi, j = Hj − Hi = 0 Link Float) Ties Relationship Float H, VH or HV, VHV Hi, j = Hj − Hi (Positive-Link Float) Ties Predecessor Node (I) Select link type and click May be I-node or embedded node on I-node Successor Node (J) Move cursor to J-node May be J-node or embedded node and click Relationship Float Calculate in Work Days Calculated as Hi, j = Hj − Hi; (Buffer) (WD) or Calendar Days Placed in a box; converts to (CD) as selected by User text box
4) Milestone Deadlines 213 (Benchmark) Attributes (denotes icon, which pops dialogue box) Conventional Milestone Triangle with or without tail User sizes tail by point & click Benchmark, i.e., Hourglass, with or without Must have logic tie from an Zero-Float Milestone tail activity “I,”“J” or “E” node Activity to Benchmark H, V, VH or HV, VHV Calc in Work Days (WD) or Relationship Tie CD based on activity duration Cut Float (cFloat) Calculate in Work Days CFi = min [min[Hu + AFj], (WD) or Calendar Days Hi, m] (CD) based on Duration Floating Milestone Green triangle; highlights It moves with the node; no logic a node ties allowed Milestone Description Return key allows Once input, converts to text box multiple rows Milestone Date Point & Click; input; Placed below right, convert or calculate to text box Milestone Tail Sized by input or point Move to front, back or & click forward option Milestone Duplicate(s) Essentially copy & Helpful for larger schedule paste icon plots
5) Textural Elements (denotes icon, which pops dialogue box) Text Box Icon Point, drag, click on Return key allows multiple location Information Object Point, drag, click on Input hyperlink Icon location Title Block Text input by user Return key allows multiple rows (4 max) Title Block Activity Click on red or Upon clicking, accept Notation Legend green activity appropriate float value
6) Special Features (denotes icon, which pops dialogue box) Multiple Cloning Repeat fragment by point Refresh dates and floats; & click hold the rest Schedule Grid Dialogue box gives Any gridline is moveable global spacing by point & click Activity Color Max displayed float If displayed float value is Threshold value denoting red above threshold, green is used Special Activities Floating (muted No DUR or float for green); dashed floating activities; only PDM Activity Notation Solid bar w/o nodes All attributes are as for LDM notation Restraints or Zero- Orange bar, solid or dashed Length set by clicking Resource Activities Window Text Box Start/finish date Blue long dashes; (left/right line); text arrow bookends lines Data Date Line Draw line if input in Allow custom width and style title block Flashing Feature Display floats and Values that changed from Relationship floats prior pause Font and Font Sizing Default: Arial. Global Any text box can be resized size option by user Logic Tie Arrows User controls how many Default provided when link on link 1st drawn Activity Duration Color = bar color; Once a text box, user can Display below description move at will Activity-related Float Below bar, in box color = bar Once a text box, user can Display color move at will Relationship (Logic) Relationship Float in Once a text box, user can Tie Data Display blue box, centered move at will Lean Planning Option If on, milestone If off, milestone relationship relationship ties used ties ignored Sightline Options Global or individual Width and style (like customization Word Border option) Activity Bar & Node Global or individual Bar width and node Option customization diameter/bar width Title Block Dates Calculate Start Date Data Date and Plot Date and Finish Date are input
[0166]Referring to FIG. 10 (forward-planning mode, Activity Float turned on), which shows a simplified sample project schedule created through the use of the interactive planning and scheduling method before re-positioning one or more activities provided by the Interactive Graphics-Based Planning System 100 according to a preferred embodiment of the present invention, and FIG. 11 (forward-planning mode, Activity Float turned on), which shows a simplified sample project schedule created through the use of the interactive planning and scheduling method after re-positioning one or more activities provided by the Interactive Graphics-Based Planning System 100 according to a preferred embodiment of the present invention, a demonstration is provided illustrating how changes, by Project Planner 102, in activity duration, activity start date and end date changes results in automatic re-calculation and display, by Project Planning System 109, of Relationship Float 313, Relationship Float 315, Relationship Float 319, and Activity Float (or Reverse Float as selected by Project Planner 102) 311, Activity Float 317 (or Reverse Float as selected by Project Planner 102), and Relationship Float 321. On comparison of FIG. 10 and FIG. 11, it can be seen that project activities: First Activity 301, Second Activity 302, Third Activity 303, Fourth Activity 304, Fifth Activity 305, Sixth Activity 306, and Seventh Activity 307 have all been modified either as to duration and or start and end date by Project Planner 102. As a result of these changes, on comparison of FIG. 10 and FIG. 11, it is seen that: [0167] Relationship Float 313 was originally 6 days, as shown on FIG. 10, has been re-calculated as 10 days as shown on FIG. 11; [0168] Relationship Float 315 was originally 2 days, as shown on FIG. 10, has been re-calculated as 3 days as shown on FIG. 11; [0169] Relationship Float 319 was originally 6 days, as shown on FIG. 10, has preferably been re-calculated as 12 days as shown on FIG. 11; [0170] Activity Float 311 (or Reverse Float as selected by Project Planner 102) was originally 6 days, as shown on FIG. 10, has preferably been re-calculated as 10 days as shown on FIG. 11;
[0171]Activity Float 317 (or Reverse Float as selected by Project Planner 102) was originally 20 days, as shown on FIG. 10, has preferably been re-calculated and remains as 20 days as shown on FIG. 11; and [0172] Relationship Float 321 was originally 8 days, as shown on FIG. 10, and remains as 8 days as shown on FIG. 11.
[0173]Preferably, the impact of planning and scheduling decisions are immediately presented to Project Planner 102, which preferably enables rapid iterative development of Project Plan 111, as shown above. When Activities 201 are connected and dated in one step in full view of stakeholders, they can apply their collective judgment to select/re-select activity dates and prevent inadvertent error during planning. Thus, as the evolving schedule nears full development, Project Planner 102 and key stakeholders are able to resolve resource constraints, accomplish schedule recovery, look for optimal date scenarios, and otherwise quickly rework the initial draft plan, visually, without having to rely on the black box calculations performed by conventional scheduling methodologies.
[0174]In its simplest embodiments, Interactive Graphics-Based Planning System 100 allows stakeholders to collaboratively and intuitively drive a schedule toward a preconceived optimal duration, whether for the whole or any portion of the schedule, by spontaneously sliding activities back and forth, crashing or extending activities, or both, without any explicit consideration given to specific resource levels or time/cost tradeoffs. It is noted that Interactive Graphics-Based Planning System 100 does not limit the types of data that can be associated with an activity. From a functional standpoint, it is generally preferred that Interactive Graphics-Based Planning System 100 preferably include the simultaneous management of three central planning processes identified herein as Resource Optimization, Cost Optimization, and Schedule Risk. Preferably, such fundamental planning processes or functionalities, which heretofore could only be dealt with in batches, are managed essentially at the same time that activities are defined, connected, and repositioned within Time-Scaled Calendar 200. If resources and crashing costs are assigned to such activities, with each activity move, whether sliding back and forth, shortening or extending activities, there is immediate feedback on how resource profiles and/or costs are impacted. The preferred functional relationships of these planning processes, within Interactive Graphics-Based Planning System 100, are further described below.
[0175]Resource Optimization preferably occurs interactively within Project Plan 111. In preferred embodiments of Interactive Graphics-Based Planning System 100, provided resource units are preferably associated with project tasks/activities as such activities are added, deleted and/or repositioned on Time-Scaled Calendar 200. Interactive Graphics-Based Planning System 100 offers the unique functionality of continuously displaying the evolving resource profiles. In other words, if a hypothetical piping activity requires five or six pipe fitters, the evolving resource “histogram” for pipe fitters is easily revised to reflect five or six more pipe fitters for the days corresponding to the activity's positioning. In fact, as activities are positioned or repositioned, if the evolving resource profile starts to trend unfavorably, such trends can be reversed by simply repositioning the activity to a position that resolves the impasse. Preferably, Resource Optimization is calculated as RESn=RESn +Ri, where “n” denotes every day between the planned dates for activity “I” and “Ri” denotes the resource daily rate for activity
[0176]If resources are associated with the activities, resource-limited activity dates and floats are preferably solidified as the plan evolves. In other words, Interactive Graphics-Based Planning System 100 is preferably structured and arranged such that resources can be displayed and leveled at the same time activities are positioned and interconnected on Time-Scaled Calendar 200. This is only possible owing to the concept of simultaneity as embodied within the preferred processes of Interactive Graphics-Based Planning System 100. The above-described resource optimization feature of Interactive Graphics-Based Planning System 100 at least embodies herein: associating at least one daily resource requirement, by such at least one project planner using such at least one computational device, with such at least one symbol representing each such activity of such at least two activities of such plurality of activities on such at least one time-scaled calendar on such at least one graphical user interface; re-positioning, by such at least one project planner using such at least one computational device, such at least one symbol representing each such activity of such at least two activities of such plurality of activities on such at least one time-scaled calendar on such at least one graphical user interface; re-calculating, by such at least one computational device, increment and daily resource requirements, for at least one distinct resource, relating to at least one such activity repositioning; and displaying, essentially continuously, by such at least one computational device, re-calculated daily resource requirement values on such at least one time-scaled calendar on such at least one graphical user interface.
[0177]Cost Optimization in preferred embodiments of Interactive Graphics-Based Planning System 100 is preferably handled in a similar interactive manner. Provided time-cost data is similarly associated with project tasks/activities, as such activities are added, deleted and/or repositioned on Time-Scaled Calendar 200. In the event the evolving plan breaches a milestone, preferably, Interactive Graphics-Based Planning System 100 offers the unique functionality of identifying all zero or small float activities that can be crashed or extended at optimal cost. Enabling such a comprehensive overview within Interactive Graphics-Based Planning System 100 greatly assists Project Planner 102 in selecting the order in which activities should be revised to optimize the project. Again, Interactive Graphics-Based Planning System 100 allows the evolving plan to be accelerated or relaxed, to adhere to deadlines (or to improve project pace) at the same time activities are positioned and interconnected on Time-Scaled Calendar 200. Again, this preferred system process is only possible owing to the concept of simultaneity as embodied within the preferred processes of Interactive Graphics-Based Planning System 100. The above-described cost optimization feature of Interactive Graphics-Based Planning System 100 at least embodies herein; associating time-cost data, by such at least one project planner using such at least one computational device, with such at least one symbol representing each such activity of such at least two activities of such plurality of activities on such at least one time-scaled calendar on such at least one graphical user interface; re-positioning, by such at least one project planner using such at least one computational device, such at least one symbol representing each such activity of such at least two activities of such plurality of activities on such at least one time-scaled calendar on such at least one graphical user interface; re-calculating, by such at least one computational device, such time-cost data, relating to at least one such activity repositioning, to provide at least one re-calculated time-cost profile; and displaying, essentially continuously, by such at least one computational device, such at least one re-calculated time-cost profile on such at least one time-scaled calendar on such at least one graphical user interface. In managing Schedule Risk, provided duration probability distribution functions are, in a similar manner, preferably associated with project task/activities, as activities are added, deleted and/or repositioned on Time-Scaled Calendar 200. Through Monte Carlo simulation techniques, iterating many times through the plan, Interactive Graphics-Based Planning System 100, preferably calculates the corresponding probability distribution function for the plan overall completion, as well as to what extent the activities turned out as having zero float (commonly referred to as activity criticality indexes). Using this highly preferred feature of Interactive Graphics-Based Planning System 100 allows the evolving plan to be risked at any time, further allowing the project to be “reworked” to attain a better risk profile. The above-described cost optimization feature of Interactive Graphics-Based Planning System 100 at least embodies herein; associating duration probability distribution functions, by such at least one project planner using such at least one computational device, with such at least one symbol representing each such activity of such at least two activities of such plurality of activities on such at least one time-scaled calendar on such at least one graphical user interface; re-positioning, by such at least one project planner using such at least one computational device, such at least one symbol representing each such activity of such at least two activities of such plurality of activities on such at least one time-scaled calendar on such at least one graphical user interface; re-calculating, by such at least one computational device, such duration probability distribution functions, relating to at least one such activity repositioning, to provide at least one project risk profile; and displaying, essentially continuously, by such at least one computational device, such at least one project risk profile on such at least one time-scaled calendar on such at least one graphical user interface.
[0178]Interactive Graphics-Based Planning System 100 preferably provides a process that, except for the initial calculation of link gaps, activity buffers, and floats concedes to human judgment in all respects, including the determination of activity early dates. Rather than relying on heuristics that few can use or understand, Interactive Graphics-Based Planning System 100 lets users make intelligent choices as to which activity(ies) to tackle first, i.e., moving to later timeframes and/or crashing/extending durations to improve manpower loading and/or shorten/extend the schedule. To put it in other words, Interactive Graphics-Based Planning System 100“adapts” itself to the users' own heuristics, developed through their many years of experience with or without CPM. Unlike CPM, which provides algorithms for calculating early/late dates, floats and schedule optimization, Interactive Graphics-Based Planning System 100 preferably provides only float algorithms and allows the user to heuristically configure the schedule in all other respects. Thus, the “one-step” scheme embodied within Interactive Graphics-Based Planning System 100 contrasts sharply with the conventional CPM “mental world” of batching (including such conventional variants as critical chain and lean construction phase scheduling). Thus, those skilled in the art will now appreciate that Interactive Graphics-Based Planning System 100 preferably advances network-based planning and scheduling to the point where attention can now focus on improving resource profiles and optimizing critical activities.
[0179]Preferably, Interactive Graphics-Based Planning System 100 supports close working collaborations between multiple project stakeholders, who may preferably form working groups during the development of Project Plan 111. Preferably, Project Planning System 109 includes facilities to keep track of the network of project activities based on the user interaction and provides users with a networks schedule. It is noted that Project Plan 111 may preferably comprise a network schedule with or without resource/cost optimization components. Upon reading the teachings of this specification, those of ordinary skill in the art will now understand that, under appropriate circumstances, considering such issues as user preference, intended use, etc., other system features, such as providing to such at least one project planner, using such at least one computational device, computational support of; project activity resources, project activity cost loading, project resource-constrained scheduling, project multi-unit scheduling, project time-cost tradeoffs, project schedule hammocking, as-planned/as-built schedule analysis, etc., may suffice.
[0180]Referring to FIG. 12, an overview schematic representation of the computer hardware and Internet environment utilized by the Interactive Graphics-Based Planning System 100 according to a preferred embodiment of the present invention is shown. The computer hardware environment comprises Computer System 928, and, in turn, Computer System 928 comprises input and output devices as is well known in the art. For example, Computer System 928 preferably comprises a display screen or Monitor 924, Keyboard 936, Printer 934, Mouse 926, etc. Computer System 928 further preferably comprises Database 922 for storage of the data and software comprising preferred embodiments of the present invention. Computer System 928 is preferably connected to Internet 932 which serves as a preferred communications medium. Internet 932, as previously discussed, comprises a global network connecting local and regional networks and computers, public and private. The Internet 932 is the preferable connection method by Remote PC 938, Remote PC 940, Remote PC 942 and Remote PC nnn to Computer System 928 in some preferred embodiments of the present invention.
[0181]Referring to FIG. 13 a simplified functional diagram illustrating a preferred web server implementation for operating the Interactive Graphics-Based Planning System 100 according to a preferred embodiment of the present invention is shown. This figure shows the preferred relationships between Remote PC 938 (as an example of any number of Remote PC 940, Remote PC 942, Remote PC nnn), Internet 932, Web Server 946, Application Server 945 and Database server 944. As shown, a Remote PC 938 requests a page from the Project Planning Web Site 949 where a preferred embodiment of the present invention is preferably located. Remote PC 938 is preferably connected via Internet 932 to Web Server 946, which receives the web page request and initiates a call to Application Server 945. A preferred embodiment of the present invention installed on Application Server 945 then makes at least one request to Database Server 944 and generates an HTML page for transmission to Remote PC 938 following completion of the present invention's request and transmission of the requested data back to the Application Server 945 by Database Server 944. Web Server 946 then transmits the completed HTML page containing the data requested by Remote PC 938 through Internet 932 to Remote PC 938. Connection 954 is typically a TCP-IP connection, or other connection which permits communication between Application Server 945 and Database Server 944 and between Application Server 945 and Web Server 946. Connection 950 is typically TCP-IP and permits Remote PC 938 and Remote PC 940 to communicate with Web Server 946.
[0182]Preferably, application logic is divided into components according to function; and the various application components are installed on different machines depending on the tier on which the application component belongs:
[0183]1. Preferably, client-tier components run on a client machine.
[0184]2. Preferably, web-tier components and business-tier components run on a web server and an application server. (As noted the web-tier and business-tier components may both be run on a single server which acts as both a web server and an application server.)
[0185]3. Preferably, enterprise information system tier components run on the database server.
[0186]Although a web application can consist of three or four tiers, multi-tiered applications are generally three-tiered applications because they are distributed over different locations: client machines, the application server machine, and the database machines at the back end. Three-tiered applications that run in this way extend the standard two-tiered client/server model by placing a multithreaded application server between the client application and back-end storage server.
[0187]Referring to FIG. 14, showing a simplified schematic illustration of the preferred Business Method 500 relating to the licensing, implementation and use of the Interactive Graphics-Based Planning System 100 according to a preferred embodiment of the present invention, preferably System Developer 501 will develop Project Planning System 109 and offer Project Planning System 109 for licensed usage in several methods. (Refer to FIG. 15) As shown, preferably System Developer 501 will develop and operate Project Planning Web Site 949, as shown in Manage Web Site Process 521, which will preferably permit Remote Project Planner 503 to develop and save Project Plan 111. Preferably, System Developer 501 will require Remote Project Planner 503 to agree to a usage license and to pay for usage of Project Planning System 109 preferably on the basis of the number of Activities 201 contained within Project Plan 111 prepared by Remote Project Planner 503 as shown in Remote Usage Process 523. In other words, Remote Project Planner 503 will pay a set amount for each Activity 201 contained in Project Plan 111. Thus, Project Planning System 109 will preferably be available to inexperienced individuals to assist in completing Project Plan 111 with limited or no assistance of project planning and scheduling experts. Upon reading the teachings of this specification, those with ordinary skill in the art will now understand that, under appropriate circumstances, considering such issues as advances in technology, user preference, competitive requirements, user location, etc., other methods of license fee calculation, such as a monthly fee, one-time payment, etc., may suffice.
[0188]Referring again to FIG. 14, as shown by Education License Process 525, System Developer 501 will preferably offer Project Planning System 109 to Educational Institution 511 for use in classroom-based teaching of project planning and scheduling concepts and methods. Preferably, Educational Institution 511 will use Project Planning System 109 to teach Student 504 project planning and scheduling concepts as shown in Teaching Process 527. Preferably, System Developer 501 will receive license fee payments in return for licensing use of Project Planning System 109 as shown by Education License Process 525. Upon reading the teachings of this specification, those with ordinary skill in the art will now understand that, under appropriate circumstances, considering such issues as advances in technology, user preference, competitive requirements, user location, etc., other license fee arrangements, such as a license fee waiver, substantially reduced license fees, etc., may suffice.
[0189]Referring once more to FIG. 14, as shown by Corporate License Process 523, System Developer 501 will preferably offer Project Planning System 109 to Corporate Entity 513 for use by Corporate Project Planner 507. Preferably, Corporate Entity 513 will complete a license agreement to permit usage within mutually agreed limitations by Corporate Project Planner 507 in return for payment of mutually agreed license fee. Preferably, as shown in Corporate Usage Process 533, Corporate Project Planner 507 may use Project Planning System 109 implemented on standalone computer systems such as personal computers, implemented on local area networks or implemented on a corporate intranet as preferred by Corporate Entity 503. Preferably, System Developer 501 will receive license fee payments in return for licensing use of Project Planning System 109 to Corporate Entity 513, as shown by Corporate License Process 523. As used herein, Corporate Entity 503 represents any form or business entity which is for-profit or not-for-profit, or any governmental entity.
[0190]Referring once more to FIG. 14, as shown by Reseller License Process 529, System Developer 501 will preferably offer Project Planning System 109 to Software Reseller 509. Preferably, the licensing agreement will permit Software Reseller 509 to make copies of Project Planning System 109 and offer licensed copies of Project Planning System 109 to Corporate Entity 513. Preferably, System Developer 501 will receive a mutually license fee calculated on a mutually agreed basis for permitting Software Reseller 509 to copy and re-license Project Planning System 109 to Corporate Entity 513 as part of Re-licensing Process 531. As shown, Software Reseller 509 will then offer license Project Planning System 109 to Corporate Entity 513 in return for an agreed license fee as shown in Re-licensing Process 531.
[0191]Upon reading the teachings of this specification, those with ordinary skill in the art will now understand that, under appropriate circumstances, considering such issues as advances in technology, user preferences, competitive requirements, user locations, etc., other business methods, such as licensing project planning system to individuals for local implementation, licensing project planning system to corporate entities for Internet-based use, etc., may suffice.
[0192]FIG. 15 shows NetPoint™ system is Applicant's commercial implementation of Interactive Graphics-Based Planning System 100. NetPoint™ system design is preferably based on object-oriented programming. Preferably, using C++ programming language, NetPoint™ defines Classes (major components of software architecture) that support a wide variety of functions including input, output, data storage, data calculation, and graphical display of activities, logic ties and milestones combining to a plan and schedule. The preferred hierarchical structure of the classes allows for generalization and inheritance of operational functions and attributes. The preferred relationships among the classes define how these software components communicate with one another by passing and receiving data. The preferred encapsulation of data and operational functions enables the system design to be modular, reusable, and extendable in terms of software maintainability. The compiled (executable) version of the NetPoint™ system is preferably a standard Microsoft Windows application, which is based on an event-driven graphical user interface (GUI) with multi-document capability. Upon reading the teachings of this specification, those of ordinary skill in the art will now understand that, under appropriate circumstances, considering such issues as intended use, advances in software, etc., other programming arrangements, such as implementations within the Linux Operating System, Mac OS X, etc., may suffice. Low-level functions and system input/output are preferably provided through Windows' physical layer interface and software drivers. NetPoint™ preferably builds on top of the basic classes from Microsoft Windows standard libraries and Microsoft Foundation Classes (MFC). Additional classes are preferably defined to provide the unique features to model and process Applicant's novel LDM notation (Logic Diagram Method), the preferred activity-diagramming environment that integrates traditional ADM and PDM project networking techniques.
[0193]As to LDM features, NetPoint™ preferably contains specialized graphical objects that preferably depict characteristics of a project plan. These graphical objects preferably include activities; logic ties/links; at least two types of milestones; embedded nodes (through which start-to-start, finish-to-finish, start-to-finish logic can be modeled); link arrows denoting direction; calendar graphics, including non-working day lines; textboxes; and information objects. Collectively, these objects preferably allow the user to simultaneously create project plans and schedules intuitively, simply and efficiently. In contrast to conventional CPM (critical path method) software systems, where the graphical display is a post processor of data stored in a separate database structure, NetPoint™ is preferably designed as a graphic-centric system where the graphical display is preferably an intrinsic part of project planning components, such as activities, links and milestones. For example, activities preferably contain their own unique drawing functions for graphical display and data manipulations, such as calculating start and finish dates, activity durations, activity and link floats (whether based on calendar days or working days as specified by the user).
[0194]NetPoint™ system preferably derives from Applicant's Graphical Planning Method (GPM) a preferred embodiment of Interactive Graphics-Based Planning System 100. In addition to planning and scheduling project activities, GPM algorithms and rules preferably support program and decision review by project participants and executives with easily understandable graphical representations. Preferably, GPM can also facilitate modeling business process with direct reference to timeline, resources, and sequences. With proper hardware and software configuration, NetPoint's GPM can preferably support full-wall planning and collaboration sessions for mission critical projects where multiple and distributed project participants (stakeholders) can simultaneously collaborate to resolve project issues efficiently and effectively.
[0195]The following sections describe the preferred core NetPoint™ classes and their relationships (See the diagram of FIG. 15). Each Class is depicted in a rectangle with their Class name. Common attributes and operations are preferably organized in a hierarchical structure so that sub-Classes can inherit attributes and operational functions from their parent Classes. The 1:1,1:N, N:1 notations describe the one-to-one, one-to-many, and many-to-one relationships in addition to message and data passing among Class objects, as shown below.
1. NetPointApplication
[0196] Class Description: This class inherits the functions from WinApp class that carries the basic application functions and handles the event interactions with Microsoft Windows and the user. [0197] Attributes: memoryHandle, displayContent, multiDocument, tooBoxes, view, menu, and popUpmenu [0198] Operations: initializelnstance( ), IoadWindowsResources( ), setPrinterl_andscape( ), setPrinterProtrait( ), getPrinterPaperSizeQ, setPrinterPaperSize( ), checkPrintStatus( ), loadResources( ), errorExceptionHandling( ), setCalendar( ), menuToolBarl_ookup( )
2. NetPointDocument
[0199] Class Description: This class inherits the functions from CDocument class that contains the basic application functions and handles file open, close, and archive functions. [0200] Attributes: paperSize, paperColor, predecessorList, successorsList [0201] Operations: initialize lnstance( ), loadWindowsResources( ), setPrinterl_andscape( ), setPrinterProtraitQ, openFile( ), saveFile( ), getFilelnfoQ, setCalendars( ), setColors( ), serialize( )
3. NetPointView
[0202] Class Description: This class inherits the functions from CScrollView class that provides the display content for graphical display on the screen. It contains vertical and horizontal scroll bars, which allow users to view a small segment of the plan at a time because the plan can be larger than what the screen could display. This class also supports the direct draw approach for users to enter data. Mouse device is used to create, draw, move, and modify objects using interactive graphics. This class also contains the definition of how timeline and calendar strips are drawn based on user's preferences. [0203] Attributes: cursorX, cursorY, displayWidth, displayHeight, rightEdge, ieftEdge, topEdge, bottomEdge, displayOptions [0204] Operations: scrollUp( ), scrollDownQ, scrollLeftQ, scrollRight( ), validateDisplayQ, onDrawQ, drawGrid( ), drawCalendarStrip( ), drawTitleBlock( ), drawLinks( ), drawLags( ), drawFloats( ), drawArrows( ), drawLinkH2V( ), drawLinkV2H( ), editCopyQ, editPasteQ, editDelete( ), editMove( ), editAlign( ), editPasteQ, select( ), selectWithinRectangle( ), deselect( ), remove( ), getDocument( ).
3.1 CalendarView
[0205] Class Description: Inheriting the functions from NetPointView class, this class defines the look and feel and the calendar strip. It controls the view of a calendar. Five levels of display options are available: year, quarter, month, week, and day. Users define calendar options and can set different color for the calendar strip. [0206] Attributes: yearOption, quarterOption, monthOption, weekOption, dayOption, clendarColor, calendarStartDate, calendarEndDate [0207] Operations: setCalendarStripColor( ), setDlaplyOptions( ), setCalendarStartDate( ), setCalendarEndDateQ, calculateXfromCalendar( ), setOriginalXQ, updateCalendarQ.
3.2 HolidayView
[0208] Class Description: This class inherits the functions from NetPointView class. It controls the non-working day line that indicates holidays (both regular and user-defined). This non-working day lines is drawn right below the calendar heading. A holiday will be displayed on the day line as a small circle with a letter “H” within it. This symbol indicates a break in duration calculation. [0209] Attributes: holidaysCollection, startX, startY, endX, endY, color, and displayOptions [0210] Operations: findHolidays( ), updateDisplay( ), setHolidayTimel_ineColors( ), setTimeLineOn, setTimeLineOff, saveTimel_ineData( ), drawToNextHoliday( ), setl_ineColor( ), drawHsymbol( ), drawHellipseQ.
3.3 PrintView
[0211] Class Description: This class inherits the functions from NetPointView class. It controls the view when the user select a print preview. The class renders the display and maps the graphical model into printer page size and orientation (landscape or portrait). [0212] Attributes: zoomLevel, printerStatus, marginLeft, marginRight, marginTop, marginBottom [0213] Operations: setPrinterPortraint( ), setPeinterl_andscape( ), setPaperColor( ), setBackgroundCOlor, setLeftMargin( ), setRightMargin( ), setTopMargin( ), setBottomBargin( ), cancelPrint( ), getPrinterStatus( ).
4. NetPointObj class [0214] Class Description: This class inherits the functions from CObject class that defines the basic object functions and handles basic drawing capability such as drawing lines, points, circle, and polygons. Capability of drawing different color and brushes is defined in this class as well. All NetPoint™ graphical objects, including activity, milestone, infoObject, link, overlapNodes, and textbox, derive from this class. [0215] Attributes: pen, color, brush, position, topLeftPoint, bottomRightPoint, textSize, textFontType, description, displayOptions, ESD (early start date), EFD (early start date), (late start date), LFD (late finish date), ASD (actual start date), (AFD (actual finish date) [0216] Operations: setPen( ), setColor, setBrushQ, setFont( ), setTextSize( ), getposition( ), setDescriptionOn( ), setDescriptionOff, getESD( ), getEFD, getLSDQ, getLFDQ, getASDQ, getAFD( ), calcauteWorkingDays( ), calculateCalendarDays( ), findHolidays( ), findEaster( ), findMemorialDay( ), findlndependenceDay( ), findLaborDays( ), findThanksgivingQ, findXMas( ), findNewYear( ),
4.1 Activity Class
[0217] Class Description: This class inherits the functions from NetPointObj class that defines the basic graphic functions. Activity class contains two subclasses, RegularActivity and DelayedActivity. RegularActv class defines any project tasks that consume resources and/or time; whereas, DelayedActv class defines delays such as winter shutdowns. Solid bars are use to graphically display a RegularActv and disconnected bars are used to display DelayedActv. [0218] Attributes: endCircleRatio, barGapPixels, displayOptionsActv [0219] Operations: drawRegularActvQ, drawDelayedActv( )
4.2 Milestone Class
[0220] Class Description: This class inherits the functions from NetPointObj class. Milestone contains two subclasses, Event class and Constraint class. The Event class sets the milestones of a project such as material delivery or project completion. The Constraint class defines the intermediate milestones that can be connected to activities to signify activity fixed deadline. Although the Event class and Constraint class both derive from the Milestone class, the graphical display is different. The Event milestone carries a vertical line that can span across several activities; whereas, the Constraint milestone set the date boundary for an individual activity. [0221] Attributes: milestoneDate, tailLength (Event Milestone only) [0222] Operations: drawEventMilestone( ), drawConstraintMilestone, drawSingleText( ), drawMultil_ineText( ), setColors( ), setTailLength( )
4.3 InfoObject Class
[0223] Class Description: This class inherits the functions from NetPointObj class. This class allows the user to attach a file (an image, an audio file, a video clip, a text file, a Microsoft Office file, a web link, or a PDF file) to the graphical icon. By double-clicking on an InfoObject, user can view the contents of the file. [0224] Attributes: storedPath, storedFileName, storedFileExtension [0225] Operations: drawlnfoObject( ), onEditPropertieslnfoObjectQ, storePath( ), storeFileName( ), viewFileQ, openApplicationQ
4.4 Link Class
[0226] Class Description: This class also inherits the basic graphic functions from the NetPointObj class. It provides functions to draw links that connect other graphical objects such as activities and milestones. Two different link styles are V2H (vertical first, then horizontal), H2V (horizontal first, then vertical), HVH (horizontal, vertical, then horizontal) and VHV (vertical first, horizontal, then vertical). [0227] Attributes: styleLabel [0228] Operations: drawLineQ, drawCurve( ), drawArrows( ), calculateVerticalBend( ), calculateHorizontalBendQ, calculateNoOfArrowsQ
4.5 EmbeddedNode
[0229] Class Description:This EmbeddedNode class inherits the basic graphic functions from the NetPointObj class. Shaped as small circle, EmbeddedNodes can be placed on activities to represent overlapped relationships such as start-to-start (STS), finish-to-finish (FTF), and start-to-finish (STF) between two activities. The lead/lag times of these overlapped relationships are calculated from the relative location of the nodes on an activity bar. Links between activities on EmbeddedNodes represent that a predecessor and a successor's start or end dates are overlapped [0230] Attributes: overlapType [0231] Operations: calculateLeadQ, calculateLagQ, testHitOrMissQ, integrateDraw( )
4.6 TextBox
[0232].Class Description: The TextBox class inherits the basic graphic functions from the NetPointObj class. This class provides the functions for users to enter text description at any location of the screen. Text can be single line or multiple lines. [0233] Attributes: noTextLine [0234] Operations: countTextl_ine( ), drawTextBox( ), calculateTextBoxSize( )
[0235]Although applicant has described applicant's preferred embodiments of this invention, it will be understood that the broadest scope of this invention includes modifications such as diverse shapes, sizes, and materials. Such scope is limited only by the below claims as read in connection with the above specification.
[0236]Further, many other advantages of applicant's invention will be apparent to those skilled in the art from the above descriptions and the below claims.

PUM

no PUM

Description & Claims & Application Information

We can also present the details of the Description, Claims and Application information to help users get a comprehensive understanding of the technical details of the patent, such as background art, summary of invention, brief description of drawings, description of embodiments, and other original content. On the other hand, users can also determine the specific scope of protection of the technology through the list of claims; as well as understand the changes in the life cycle of the technology with the presentation of the patent timeline. Login to view more.
Why Eureka
Try Eureka