Data visualization techniques

a data visualization and data technology, applied in the field of data visualization techniques, can solve the problems of limited features, data is not easily understood, and the conversion of data into information is a significant obstacle in the information age of today's information age,

Active Publication Date: 2009-01-08
ORACLE INT CORP
View PDF91 Cites 189 Cited by
  • Summary
  • Abstract
  • Description
  • Claims
  • Application Information

AI Technical Summary

Problems solved by technology

However, obtaining information on which decision makers can act presents several practical challenges.
One such challenge is the massive amount of data available to the enterprise in today's Information Age.
Conversion of data to information which can be readily understood is a significant obstacle.
One barrier to the wide use of data visualizations is the limitation in available features which make the visualized information more meaningful to users.
For example, current treemap solutions do not provide for ways to vary an aggregation function used for generating the data visualization.
Current versions of treemap components do not address this issue, but instead have a fixed method for determining the areas of the lowest-level groups, which are typically implicit in the graph's definition and construction.
Another barrier to the use of data visualizations is that typical solutions provide default visible depth levels which cannot be modified by users.
Thus, users can easily get lost because there is no indication of an overview of how the current view corresponds to the entire hierarchical data set.
Moreover, visualization techniques tend to emphasize a small number of primary or first-order effects, making it difficult to appreciate secondary or second-order effects.
Almost any plot of the data set {1,2,3,4,5,1000000} will reveal that one value is unusual, but it may make it difficult to appreciate the linear relationship of the similar values.
However, a user is unable to easily effectuate filtering using these ranges when the user has quickly isolated the cells on the treemap which illustrate the first order effects.
Moreover, filtering based on ranges may have the added disadvantage of simultaneously hiding multiple data values at different depth levels, causing dramatic changes to the appearance of the data visualization.
In addition, it may be difficult to model the data values that contribute to the first order effect with a filter that is set up in advance.
Further, solutions are incapable of linking selected portions of the graphical visualization to related information without serious drawbacks.
These drill-in techniques have the disadvantage that they must be pre-programmed into the component's code.
Moreover, the drill-in action is typically limited to actions that can only be accomplished by the component itself.

Method used


Image

  • Data visualization techniques
  • Data visualization techniques
  • Data visualization techniques

Examples


Embodiment Construction

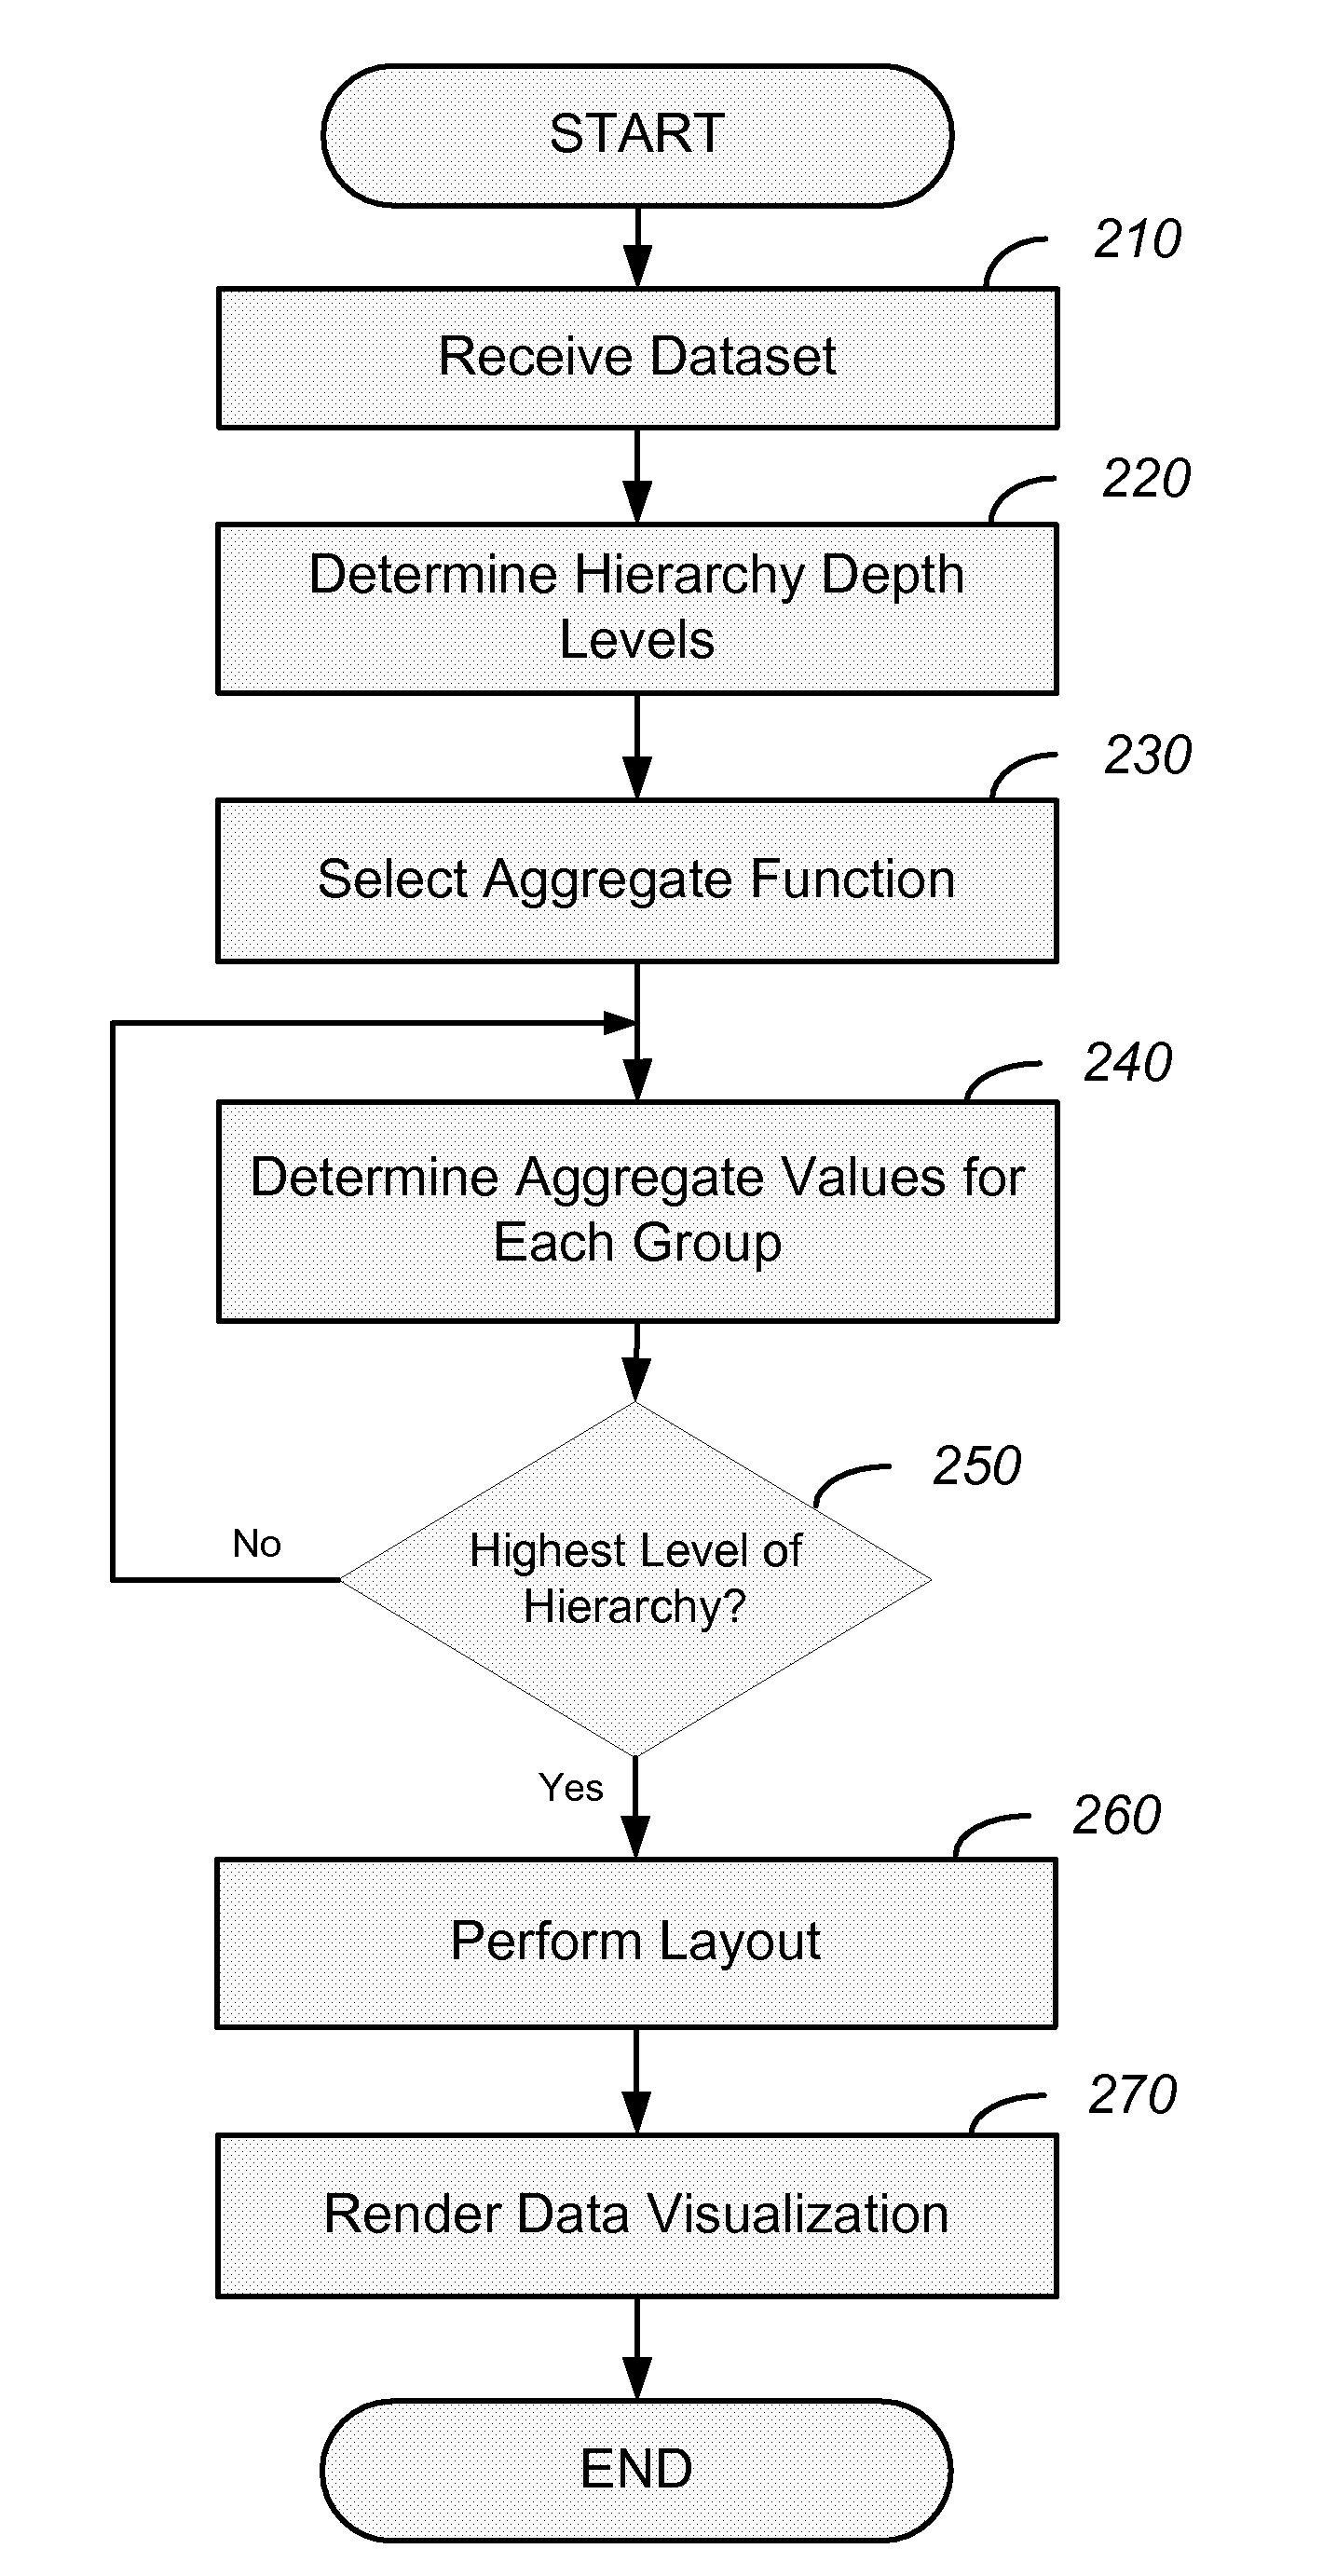
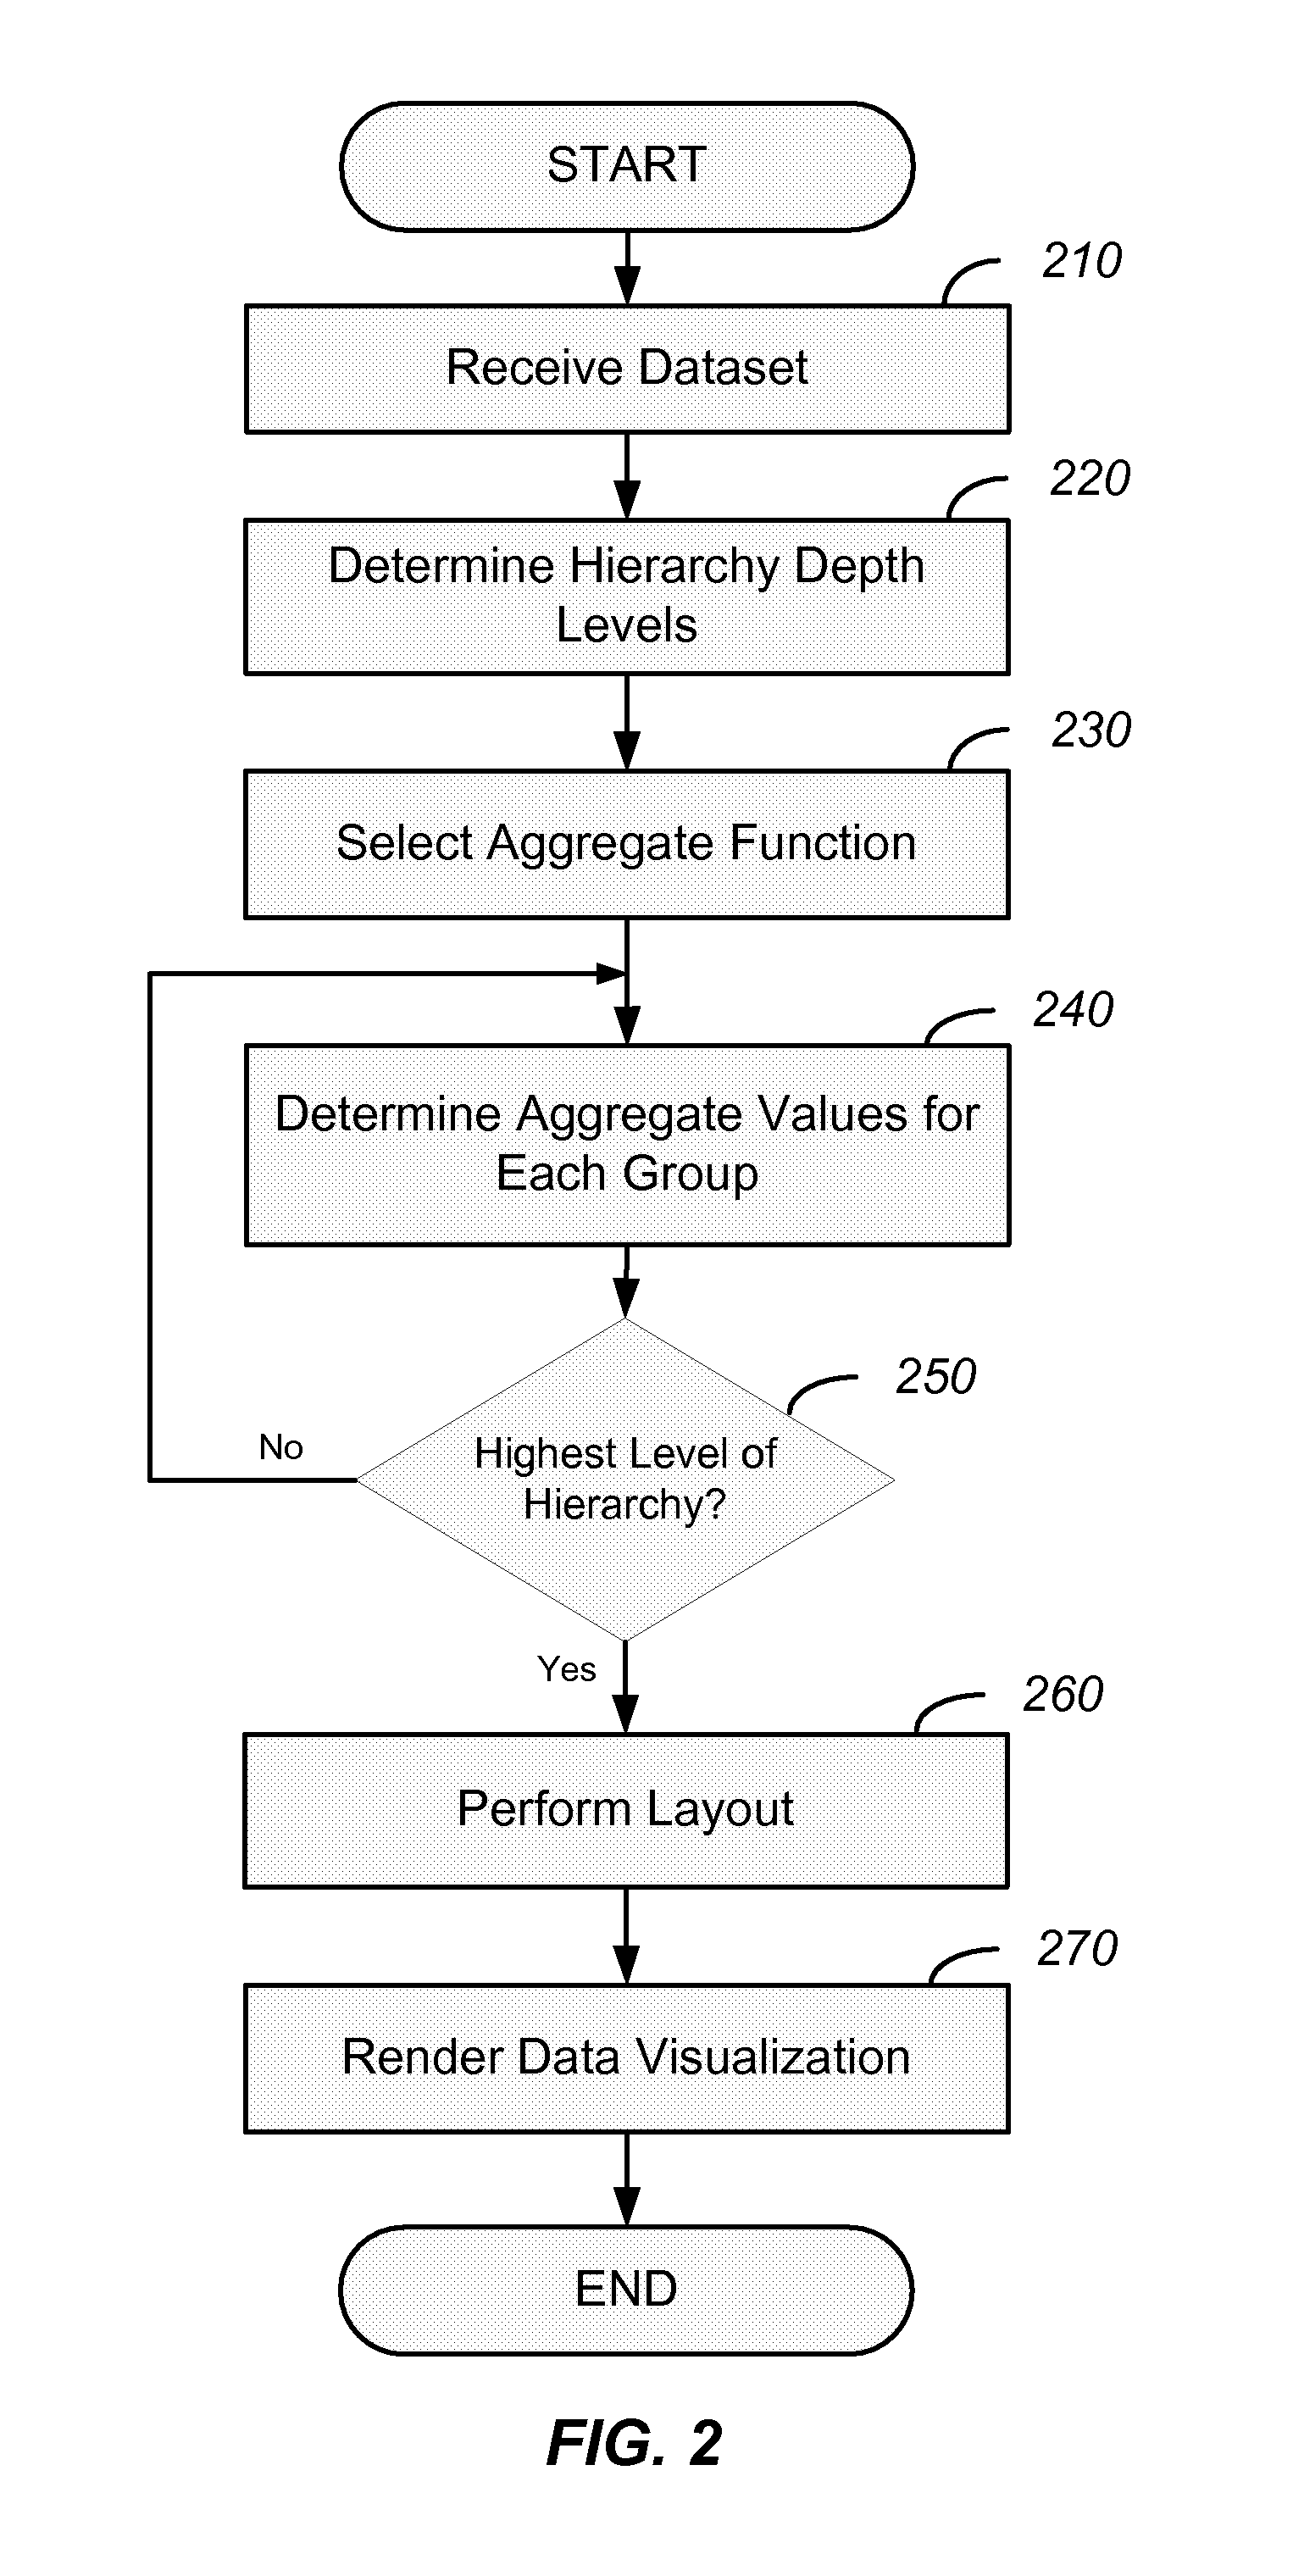
[0045]Systems and methods described herein provide for improvements to data visualization techniques. The present invention includes systems and methods for improving the usefulness and usability of visualization techniques. Implemented as an application programming interface (API), an automated or semi-automated process, and / or an interactive menu, for example, users may vary the aggregation function used for determining aggregate values of various graphical attributes, such as area or color cell characteristics in a treemap configuration. Moreover, it may be useful to automate or partially automate the selection of an appropriate aggregation function. The aforementioned aggregation solutions could be implemented for other hierarchical visualization techniques.

[0046]Current treemap solutions are able to show only a limited number of hierarchical levels at a time. When viewing an inner depth level during a drill-down action, outer depth levels are cut-off from view. Likewise, when p...


PUM


Abstract

Systems and methods in accordance with various embodiments of the present invention provide for representing a plurality of data values of a hierarchical dataset as graphical elements in a configurable data visualization. A first data visualization may be displayed in a data visualization display page, along with a user interface. A selection of a rendered root node and rendered leaf nodes to be displayed in a second data visualization is received from the user interface. Based on the selection of the rendered root node and rendered leaf nodes, a number of depth levels to display is determined. Also, which of the depth levels to display are identified based on the selection of the rendered root node and rendered leaf nodes. The second data visualization is rendered based on the determined number of depth levels and the identified depth levels.

Description

CROSS-REFERENCES TO RELATED APPLICATIONS[0001]This application also is related to the following U.S. patent applications, each of which is hereby incorporated herein by reference:[0002]U.S. patent application Ser. No. ______, filed ______, entitled “AUTOMATED TREEMAP GENERATION,” [ATTY DOCKET 021756-032600US];[0003]U.S. patent application Ser. No. ______, filed ______, entitled “AGGREGATE LAYOUT FOR DATA VISUALIZATION TECHNIQUES,” [ATTY DOCKET 021756-039300US];[0004]U.S. patent application Ser. No. ______, filed ______, entitled “FILTERING FOR DATA VISUALIZATION TECHNIQUES,” [ATTY DOCKET 021756-039400US];[0005]U.S. patent application Ser. No. ______, filed ______, entitled “LINKING GRAPHICAL ELEMENTS OF DATA VISUALIZATIONS,” [ATTY DOCKET 021756-039500US]; and[0006]U.S. patent application Ser. No. 11 / 745,280, filed May 7, 2007, entitled “RENDERING DATA VISUALIZATION WITH MINIMAL ROUND-OFF ERROR,” [ATTY DOCKET 021756-032800US].COPYRIGHT NOTICE[0007]A portion of the disclosure of this ...

Claims


Application Information

Patent Timeline
Patent Type & Authority Applications(United States)
IPC IPC(8): G06F3/048
CPCG06F17/30572G06F3/0484G06Q10/10G06F16/26
Inventor HELFMAN, JONATHANGOLDBERG, JOSEPH
Owner ORACLE INT CORP
Why Eureka
Try Eureka